Towards a Unified Pandemic Management Architecture: Survey, Challenges and Future Directions - arXiv
←
→
Page content transcription
If your browser does not render page correctly, please read the page content below
Towards a Unified Pandemic Management Architecture:
 Survey, Challenges and Future Directions
 SATYAKI ROY, University of North Carolina, Chapel Hill, USA
 NIRNAY GHOSH, Indian Institute of Engineering Science and Technology (IIEST), Shibpur, India
arXiv:2202.07448v1 [cs.CY] 4 Feb 2022

 NITISH UPLAVIKAR, University of Missouri, Columbia, USA
 PREETAM GHOSH, Virginia Commonwealth University, Virginia, USA
 The pandemic caused by SARS-CoV-2 has left an unprecedented impact on health, economy and society
 worldwide. Emerging strains are making pandemic management increasingly challenging. There is an urge to
 collect epidemiological, clinical, and physiological data to make an informed decision on mitigation measures.
 Advances in the Internet of Things (IoT) and edge computing provide solutions for pandemic management
 through data collection and intelligent computation. While existing data-driven architectures attempt to
 automate decision-making, they do not capture the multifaceted interaction among computational models,
 communication infrastructure, and the generated data. In this paper, we perform a survey of the existing
 approaches for pandemic management, including online data repositories and contact-tracing applications.
 We then envision a unified pandemic management architecture that leverages the IoT and edge computing to
 automate recommendations on vaccine distribution, dynamic lockdown, mobility scheduling and pandemic
 prediction. We elucidate the flow of data among the layers of the architecture, namely, cloud, edge and end
 device layers. Moreover, we address the privacy implications, threats, regulations, and existing solutions that
 may be adapted to optimize the utility of health data with security guarantees. The paper ends with a lowdown
 on the limitations of the architecture and research directions to enhance its practicality.
 Additional Key Words and Phrases: Pandemic Management, Internet of Things, Optimization, Machine
 Learning, Privacy
 ACM Reference Format:
 Satyaki Roy, Nirnay Ghosh, Nitish Uplavikar, and Preetam Ghosh. 2018. Towards a Unified Pandemic Man-
 agement Architecture: Survey, Challenges and Future Directions. 1, 1 (February 2018), 30 pages. https:
 //doi.org/XXXXXXX.XXXXXXX

 1 INTRODUCTION
 COVID-19 is an infectious disease that has had major health, economic and social impact on the
 world. It has infected over 293 million people and claimed nearly 5.5 million lives globally. The
 manifestation of COVID-19 ranges from asymptomatic/mild symptoms to severe respiratory illness,
 hospitalization and death, while the survivors are afflicted with several long-term effects [1]. The
 efficacy of vaccines are challenged by the rapid and unabated emergence of new strains varying
 in virulence and transmissibility [2, 3]. COVID-19 is expected to acquire an endemic status over
 ∗ Satyaki Roy and Nirnay Ghosh contributed equally.

 Authors’ addresses: Satyaki Roy, University of North Carolina, Chapel Hill, USA, satyakir@unc.edu; Nirnay Ghosh, Indian
 Institute of Engineering Science and Technology (IIEST), Shibpur, India; Nitish Uplavikar, University of Missouri, Columbia,
 USA; Preetam Ghosh, Virginia Commonwealth University, Virginia, USA.

 Permission to make digital or hard copies of all or part of this work for personal or classroom use is granted without fee
 provided that copies are not made or distributed for profit or commercial advantage and that copies bear this notice and
 the full citation on the first page. Copyrights for components of this work owned by others than ACM must be honored.
 Abstracting with credit is permitted. To copy otherwise, or republish, to post on servers or to redistribute to lists, requires
 prior specific permission and/or a fee. Request permissions from permissions@acm.org.
 © 2018 Association for Computing Machinery.
 XXXX-XXXX/2018/2-ART $15.00
 https://doi.org/XXXXXXX.XXXXXXX

 , Vol. 1, No. 1, Article . Publication date: February 2018.
2 1, 1, 2, and 3

time, causing intermittent outbreaks. Hence, it is imperative to design policies around the clinical
management strategies, rehabilitation measures, human behavior and pandemic response [4–7].
 The proliferation of digital technology has resulted in the generation of volumes of pandemic-
related data made available in the form of public repositories. These clinical, epidemiological,
physiological, socioeconomic, genomic, etc. data not only disseminate information on the latest
developments, but have opened up a new vista of computational research on COVID-19 [8]. This
research aims to create management plans to combat epidemic outbreaks by optimized allocation
of human and material resources such as manufacturing production, human labor, transportation,
etc. [9]. Furthermore, it identifies the limitations in the existing technological deployments and ways
to make them more practicable [10]. These computational frameworks propose application of a wide
array of methodologies such as artificial intelligence, machine learning, deep learning, optimization,
statistics, network science, epidemiology, bioinformatics, etc. to meet two primary goals [11]. First,
they inform the researchers, policymakers and general public of the spatio-temporal and behavioral
trends that are associated with the onset of severe outbreaks [12]. Second, they recommend the
decisions that will contribute towards curbing contagion [13]. For example, these models may
prescribe the distribution of vaccines among zones based on socioeconomic, demographic factors
and human mobility to avoid infection spread or the effective duration and timing of lockdowns to
cut down on mortality and hospitalization as well as economic losses [14].

Fig. 1. The proposed pandemic management architecture presents a holistic picture of the multilayered
interaction among the epidemiological, physiological and clinical data, methods, and the IoT communication
infrastructure.

 The advent of the Internet of Things (IoT) has revolutionized the field of healthcare. We have
seen a barrage of healthcare solutions that rely on the mobility, clinical, physiological, and epi-
demiological data generated by the IoT devices [15]. Pandemic management would undoubtedly
have been more challenging in the absence of these innovations in digital technology. At the
same time, the abundance of IoT devices and the data generated therefrom creates a problem
of plenty, necessitating a comprehensive pandemic management architecture. This architecture
should provide a blueprint for the (1) communication technologies for the collection of data using
citizens’ personalized devices as well as data repositories, (2) data offloading from user equipment
to compute/storage infrastructures, and (3) the use of computational models for data analysis to
enable informed decision-making [16].

, Vol. 1, No. 1, Article . Publication date: February 2018.
Towards a Unified Pandemic Management Architecture: Survey, Challenges and Future Directions 3

 Efforts have been made to design data-driven architectures that automate decision-making
regarding pandemic healthcare. Shamout et al. introduced a deep learning architecture to learn
pulmonary complications due to COVID-19 [17]. Karaarslan et al. proposed an epidemic manage-
ment system that employs data to distribute resources effectively, while enabling the interaction
of multiple platforms and meeting scalability and interoperability issues [18]. Alam discussed a
blockchain-based mobile healthcare architecture for real-time monitoring of the COVID-19 pa-
tients [19], while Otoom et al. explained an IoT framework that processes the real-time symptom
data to run diagnostics and monitoring [20]. However, these frameworks do not provide a unified
picture of the multilayered interaction among the data, methods, and the wireless communication
infrastructure of a realistic pandemic management architecture (see Fig. 1).

 Term Abbreviation
 Attribute-based Access Control ABAC
 Contagion Potential CP
 Differential Privacy DP
 Federated Learning FL
 Graph Attention Network GAT
 Giant Connected Component GCC
 General Data Protection Regulation GDPR
 Grant Recurrent Network GRU
 Internet of Things IoT
 Internet Protocol IP
 Internet Service Protocol ISP
 Local Area Network LAN
 Long-Term Evolution LTE
 Mobile Edge Computing MEC
 Machine Learning as a service MLaaS
 Oblivious Transfer OT
 Organization-based Access Control OrBAC
 Private Information Retrieval PIR
 Radio Access Network RAN
 Role-based Access Control RBAC
 Radio Network Controller RNC
 Received Signal Strength Indicator RSSI
 Susceptible-Exposed-Infected-Recovered-Death SEIRD
 Single Instruction Multiple Data SIMD
 Spatiotemporal Attention Network SPAN
 User Equipment UE
 Table 1. List of abbreviations

 In this paper, we propose an architecture that consolidates the features of the existing computa-
tional frameworks into IoT and edge computing technologies. It will gather sensory physiological,
clinical and epidemiological data from the general public, harness computational approaches to
process ground and historical data, and send periodic recommendations to civic authorities and
participating users. The pandemic management architecture operates on three levels, namely, in-
dividuals possessing smart devices (which we refer to as IoT devices) infused with data analytic

 , Vol. 1, No. 1, Article . Publication date: February 2018.

4 1, 1, 2, and 3

capabilities, a cloud layer comprising servers enabled with high data storage and processing power,
and an intermediate edge layer offering on-demand computation, communication, and caching
services to applications running on IoT devices. Hence, the requests from IoT devices are not
directly sent to the back-end cloud but are offloaded to intermediate edge nodes that are at the
edge of the users’ networks, resulting in improved latency and better bandwidth utilization for the
rest of the Internet.
 We discuss the relevant studies on the online data repositories and mobile contact-tracing appli-
cations as well as four representative pandemic management tasks, namely, vaccine distribution,
dynamic lockdown, contact tracing, and pandemic prediction (see Sec. 3). Next, we cover the three
layers of the architecture, followed by how the edge computation layer pulls time-series data from
cloud-hosted repositories as well as the mobile devices, runs them through the computational
models, and recommends human actions regarding vaccines, social distancing, lockdowns, etc.
(see Sec. 4). We explore the privacy concerns of sharing of confidential data and related strategies
to achieve high data utility and necessary data anonymity (see Sec. 4.3). Finally, we highlight
the shortcomings of the pandemic framework that hinder practical implementation and motivate
several new research directions (see Sec. 5).
 This paper is organized as follows. Sec. II deals with the preliminary concepts relevant to the
subsequent discussion. Sec. III presents a survey on the computational frameworks on COVID-19.
Sec. IV discusses the proposed pandemic management architecture. Finally, in Sec. V and VI, we
cover the challenges, future directions and conclusions, respectively. (Refer to Table 1 for the list of
abbreviations.)

2 PRELIMINARIES
2.1 Vaccine Distribution
The vaccines are housed in the warehouses and transferred to the vaccination sites of the zones
(see Fig. 2). (The warehouses can have their own sites as well.) The vaccine recipients from the
neighborhood visit the sites to get inoculated [21, 22].

 Fig. 2. Vaccine warehouse, zones and neighborhood

2.2 Epidemic Model
The susceptible-exposed-infected-recovered-death (SEIRD) epidemic model is applied to the mathe-
matical modelling of infectious diseases [23]. The susceptible ( ) class comprises individuals who
are not exposed to the infection. Once exposed to infected individuals, they may transfer to the

, Vol. 1, No. 1, Article . Publication date: February 2018.

Towards a Unified Pandemic Management Architecture: Survey, Challenges and Future Directions 5

exposed ( ) category, and this transition is controlled by a rate . The class comprises asymp-
tomatic or untested individuals, who transition to the (tested) infected ( ) class with probability .
The individuals in transition to another state with a probability ; this other state can be either
recovered ( ) or dead ( ) with probabilities 1 − and , respectively, as shown below. Note that
 = × 0 , where 0 is the basic reproduction number (defined as the number of new infections a
single infectious individual creates in a susceptible population [24]) that has a median value of 3,
but can be equal to 5.7 or even more as per previous literature [25, 26]. Thus, unlike, ( , , ), is
not a transition probability.

 →
 − (1)

 −
 → (2)
 ×(1− )
 −−−−−−→ (3)
 ×
 −−−→ (4)

2.3 Graph Theory
A graph is an ordered pair = ( , ) where is a finite, non-empty set of objects called vertices
(or nodes); and is a (possibly empty) set of 2-subsets of , called edges [27]. A directed graph is a
graph in which edges have directions. A directed edge ( , ) ∈ , allows unidirectional information
flow from vertex to and not necessarily from to . In a weighted graph, ( , ) ∈ is associated
with a weight , ∈ [0, 1], measuring the strength of influence of on .

2.4 Components of Wireless Communication Architecture
The major components in our envisioned pandemic management architecture are as follows:
 (1) Core network: It specifies the backbone network for the Internet, which interconnects ge-
 ographically dispersed computer networks and constitutes several core routers. The core
 network provides data routes for exchange of information between different Local Area
 Networks (LANs) and subnetworks at geographically dispersed locations. The core routers
 are owned by different cellular companies and are managed by regional and national Internet
 Service Providers (ISPs). Each router has multiple high-speed interfaces for faster exchange
 of Internet Protocol (IP) packets among communicating networks and supports a wide range
 of routing protocols.
 (2) Cloud servers: Cloud computing is a computing paradigm that offers on-demand services
 to the end-users through a pool of computing resources that includes storage services,
 computing resources, and so on [28]. It constitutes high-performance computing clusters
 hosted in a remote network and managed by infrastructure service providers. These servers
 handle application requests from the end device users, and to cater to tens of thousands of
 user requests simultaneously, they have significant capacities of computation, storage, and
 network bandwidths. Each cloud server can host multiple application containers/content
 servers that handle requests in parallel. When the data processing is complete, the cloud
 servers will send the results back to the end-users via the backhaul network(s). Moreover,
 using the storage services, these servers can store massive volumes of time-series data
 obtained at regular intervals from/by APIs managed by external data sources.
 (3) Radio Access Network (RAN): A radio access network (RAN) is a part of the mobile telecom-
 munication system, and it provides a predefined range of frequencies (frequency spectrum)

 , Vol. 1, No. 1, Article . Publication date: February 2018.
6 1, 1, 2, and 3

 for enabling wireless communication between mobile phones or any wireless controlled
 machines (laptops, tablets, wearables, etc.) with the mobile core network [29]. With the
 accustomed support of mobile Internet using RAN long-term evolution (LTE), 4G/5G now
 has an edge over other wireless mobile telecommunication technologies providing the best
 user experience [30]. RAN covers a wide geographical area divided into cells, and each cell
 is integrated with its base station. Base stations are typically connected via microwave or
 landlines. Each base station has a radio network controller (RNC) that carries out mobile man-
 agement functions and connects the former with backhaul networks through the Ethernet
 interface, which supports a high data transfer rate [29]. Mobile Edge Computing (MEC) – a
 combination of mobile devices, applications and the data they consume and produce – offers
 cloud computing capabilities within the RAN by pushing cloud resources to the mobile edge.
 Thus, instead of allowing direct mobile traffic between the core network and the end-user,
 MEC connects the user to the nearest cloud service-enabled edge network. Deploying MEC
 at the base station enhances computation and avoids bottlenecks and system failure [31, 32].
 (4) Users’ Equipment (UE): Users’ equipment consists of mobile, handheld devices such as smart-
 phones, laptops, tablet computers, and wearables. These devices are equipped with multiple
 sensors that can be invoked opportunistically by mobile applications for collecting environ-
 mental data. Some of the sensory data that can be obtained are of location, motion, gesture,
 audio, light, etc. These devices are intelligent as they can receive feedback from applications
 and perform subtle actuation to adapt to varying environmental conditions. Besides this,
 users can also participate in data acquisition tasks by voluntarily sharing their personal or
 environmental data. Such devices communicate with remote content and compute servers
 using Wi-Fi, LTE/4G/5G technologies, and can communicate with neighboring devices us-
 ing short-range communication protocols such as BLE/Bluetooth, ZigBee, and Wi-Fi direct
 protocols.
 (5) Mobile Edge Computing (MEC) servers: Mobile edge computing (MEC) constitutes geo-distributed
 servers with built-in IT services [32]. These servers have fair amounts of computing, storage,
 and communication bandwidth. MEC servers may be deployed at a fixed location, such as
 at an LTE base station or a multi-technology (3G/LTE) cell aggregation site [31]. MEC may
 utilize cellular network elements, such as the base station, Wi-Fi access point, or femto access
 point (i.e., low power cellular base station) [32]. The fundamental value proposition of MEC
 is that it pushes cloud capabilities (compute, storage, communication) to the edge of the users’
 network. It enables most applications (running on UEs) to offload general-purpose requests to
 the nearby MEC servers rather than sending them to the remote cloud. Such offloading helps
 to fulfill the QoS requirements of resource-intensive, delay-sensitive, and high-bandwidth
 demanding applications running on end devices. Additionally, the bandwidth bottleneck
 situations at backhaul network(s) between the end-users and cloud servers are also avoided.
 However, the MEC server forwards them to the cloud in case of very high compute-intensive
 or large data processing requests.

3 COMPUTATIONAL PANDEMIC MANAGEMENT FRAMEWORKS
In this section, we survey the literature on online repositories, contact-tracing mobile applications,
as well as the current representative computational frameworks for COVID-19 management.

3.1 Online Repositories
We discuss standard databases that are periodically updated with emerging information on different
facets of COVID-19.

, Vol. 1, No. 1, Article . Publication date: February 2018.
Towards a Unified Pandemic Management Architecture: Survey, Challenges and Future Directions 7

3.1.1 Publication repositories. These repositories shortlist the global scientific publications specific
to COVID-19. The standard repositories include WHO COVID publication repository [33], NIST
COVID-19 repository [34], CDEI COVID-19 repository and public attitudes retrospective [35], and
the Elsevier Coronavirus Research Repository [36].
3.1.2 General data repositories. These repositories, such as NIH Open-Access Data and Compu-
tational Resources [37], Google Health COVID-19 Open Data Repository [38], iReceptor Reposi-
tory [39], Stanford Research Repository [40], Humdata [41], etc., house the genomic, biomedical,
clinical, sensor and behavioral data collected on COVID-19.
3.1.3 Epidemiological information repositories. These databases record and visualize daily infected
cases, deaths, etc., in the US and the world. Some examples include Johns Hopkins COVID resource
center [42], Our World in Data [43] and CDC COVID Tracker [44], etc.
3.1.4 Resource repository. These repositories help organize resources necessary for pandemic
management. For example, Faith and COVID-19: Resource Repository [45] offers a web platform that
allow people to participate in COVID-19 response, WASH Resources [46] offer intellectual resources
to the staff and practitioners of Water Sanitation and Hygiene, Sages COVID-19 Medical Device
Repository [47] offers information on medical toolkit for treatment of COVID-19, and COVID-19
Toolkit: Federal Depository Library Program [48] provides information on library closures, virtual
work environments, and virtual service environments.

Fig. 3. Message exchanges between server and mobile devices in the centralized and distributed architectures
of mobile contact tracing applications

3.2 Mobile Contact Tracing Applications
Let us briefly discuss the two design architectures of contact tracing applications [49] (see Fig. 3).
3.2.1 Centralized architectures. These applications, like Singapore’s TraceTogether [50] and China’s
Health Code [51], rely on the centralized back-end server to process the contact tracing information.
The server carries out the authentication, risk analysis as well as user notification. We outline the
four salient processes in the workings of centralized architecture-based apps (marked red in Fig. 3).

 , Vol. 1, No. 1, Article . Publication date: February 2018.
8 1, 1, 2, and 3

 (1) The user registers their device with the server. User identity is authenticated by exchanging
 a one-time password.
 (2) The user app exchanges Bluetooth encounter messages with peers. The timestamp as well as
 the Received Signal Strength Indicator (RSSI) is locally recorded.
 (3) If a user has tested positive and has agreed to share their medical status, the location infor-
 mation as well as the list of recent encounters are offloaded to the server.
 (4) The server estimates the risk of exposure of the peers who came in contact with the infected
 person. The assessment is based on RSSI and transmission power. Subsequently, the likely
 exposed individuals are notified and prompted to isolate and get tested.

3.2.2 Distributed architectures. These architectures, like Google-Apple contact tracing apps [52],
do away with the dependency on the server, by performing more computational tasks on the user
end. We discuss the key steps in distributed architecture based applications (marked green in Fig.
3).
 (1) The devices do not register with the server nodes. They periodically exchange short messages,
 comprising pseudo-random key and current time, with the peers.
 (2) If a person tests positive, (s)he uploads these messages (and not the list of recent encounters)
 to the server.
 (3) The server advertises the message from the infected user to all mobile users.
 (4) Users accessing the advertised messages do risk analysis locally based on proximity and
 duration of exposure.

3.3 Vaccine distribution strategies
These approaches address (1) equity and fairness and (2) epidemiological goals, such as minimization
of infection, hospitalization and mortality in the course of vaccine allocation. Emanuel et al.
discussed the three fundamental values of vaccine distribution, namely, maximizing people and
limiting harm, prioritizing the disadvantaged, and equal moral concern [53, 54]. Overall, it is
imperative that the vaccine distribution is commensurate with the population size to help achieve
aforementioned epidemiological goals [55].

3.3.1 Optimization formulation. The standard approach to design vaccine distribution solutions
is to model it as an optimization problem with constraints on the supply of vaccines. Roy et al.
designed a generalizable, multi-vaccine distribution measure that allocates vaccines based on the
socio-economic, epidemiological and demographic profiles of zones [21, 56]. In this approach, there
is a matrix of decision variables ,
 ∈ X (where ∈ [0, 1]) that represents the fraction of vaccines
of type transported from the vaccine warehouse to zone . Optimization allocates | | vaccines
among ∈ zones, while minimizing the cost, denoted by ( , ), between the warehouse and
zone (Expression. 5).

 ∑︁ ∑︁ ∑︁

 min , × ( , ) (5)
 X
 ∈ ∈ ∈
 ∑︁ ∑︁ ∑︁

 s.t. C1: , ≤ | | (6)
 ∈ ∈ ∈
 ∑︁ ∑︁

 C2: , ≥ × × | | ∀ ∈ (7)
 ∈ ∈

 , ∈ [0, 1] (8)

, Vol. 1, No. 1, Article . Publication date: February 2018.
Towards a Unified Pandemic Management Architecture: Survey, Challenges and Future Directions 9

 Number of vaccinations. The formulation allows the optimizer to distribute | | vaccines, where
inequality is replaced by an equality in Constraint 1 (C1, Ineq. 6). It preserves the inequality sign
(≤) if the goal is to minimize the number of distributed vaccines while meeting the following goals.
 Fairness based on demographic and epidemiological considerations. The optimizer can allocate
vaccines based on the susceptible count, infected count or population density depending on the
value of in Constraint 2 (C2, Ineq. 7).
 (1) Susceptible. Vaccines are allocated to zones based on the proportion of remaining susceptible
 Í
 population (after × ,
 have acquired immunity).

 Í Í
 − ∈ ×

 ,
 = Í (9)
 ∈
 (2) Population Density. Vaccines are assigned to zones based on the population density of each
 zone ∈ .

 = × (10)
 In the above equation, = Í − ( ) ,

 where is the population density of zone .
 ∈
 (3) Infected. Vaccines are allocated based on the ratio of infected population for each zone ∈ .

 = × (11)
 Í − ( )
 Here = , where is the infected ratio of zone given by .
 ∈

Here, and denote the scaled population density and infected proportions for a zone . If (or
 ) is greater than 1, its population density exceeds mean density ( ), and vice versa. Summing
 Í − ( ) Í Í ( )
over all (or ), i.e., = Í = Í − Í = 1 − 1 = 0. They consider a
 Í
 ∈
trade-off parameter ∈ [0, 1] balancing the economics vs. demographic or epidemiological factors.
Specifically, a high distributes vaccines on the basis of the factors discussed under Constraint 2;
conversely a low value of causes the optimizer to emphasize on economic cost.
 There are several works that utilize a similar optimization formulation that distributes vaccines
among communities based on their direct and herd immunity and mortality minimization [57–59].
Bertsimas et al. proposed a model that combines DELPHI epidemiological model with a bilinear,
non-convex optimization to minimize exposure, mortality, and distance between vaccination centers
and population centers [60]. Rao et al. present an analytical model for vaccine allocation with the
aim of minimizing the effective reproduction number [61]. Shim et al. learn the parameters of the
age-structured model of COVID-19 spread in South Korea to design vaccine deployment policies
such that infections, deaths could be mitigated, given the parameters of age distribution and social
contact [62], while Meehan et al. [63] and Buckner et al. [64] use the age-structured model and
epidemiological model, respectively, to suss out high-priority individuals to be vaccinated based on
their contact rates and risk of infection.
3.3.2 Measures for vaccine distribution. Jadidi proposed using bluetooth on mobile devices to create
a social graph that will identify the most well-connected individuals to be vaccinated to achieve
herd immunity [57]. These individuals, , in a social graph have a high connectivity centrality
measured as:
 ∑︁
 ( ) = ( , ) (12)

 , Vol. 1, No. 1, Article . Publication date: February 2018.
10 1, 1, 2, and 3

Given the weight of the social tie between individuals and , ( , ) measuring the likelihood
of disease transmissibility based on the duration and frequency of contacts between the people,
the distance, and their locations; and the number of simple paths between nodes and , ℎ( , ),
 ( , ) = ℎ( , )
 ( , .
 Xu et al. presented a vaccination coverage metric that determines the percentage of vaccinated
individuals [22]. The proposed metric improves upon the transportation accessibility and demo-
graphics constraints of the existing coverage metrics. Different zones are assigned levels = 1, 2, · · ·
depending on the increasing amount of tine needed to reach the vaccination site of the zone from
the neighborhood (refer to Sec. 2.1). The measure for zones in level to be covered by site is:

 ∗
 , = min(1, + × ) (13)
In the above equation, is the baseline of coverage for level zones as per Lim’s study [65],
 is the total number of public transportation stops in the vicinity of site , and measures the
convenience rendered by adding a stop near a given site .

3.4 Dynamic lockdown strategies
We discuss the models that prescribe varying levels of lockdown based on the epidemiological and
clinical parameters, such as infected cases, mortality, contact rates, healthcare facilities, etc., of
zones constituting a geographical region.
3.4.1 Supervised models. Tadano et al. employed artificial neural networks (namely, extreme
learning machine, echo state network; multilayer perceptron, and radial basis function networks)
to predict the effect of lockdown in Sao Paulo City, South America on air pollution levels [66].
Roy et al. propose a dynamic pandemic lockdown strategy that leverages reinforcement learning
and queueing models to regulate inter-zone traffic on the basis of hospitalization and healthcare
budget [67]. Roux et al. proposed an age-structured Susceptible-Exposed-Infected-Recovered model
(refer to Sec. 2.2) to estimate the right number of hospitalizations, hospital beds requirements, and
hospital deaths that could have been prevented by a timely lockdown in 13 metros of France [68].
They employed maximum likelihood estimation to train the model and show that without travel
restrictions, the pandemic would have overwhelmed the medical facilities in France.

Fig. 4. SEIR model proposed by Roux et al. [68], where , , , , , ℎ , ℎ , and represent susceptible,
exposed, pre-infected, asymptomatic, symptomatic infected, hospitalized, non-hospitalized and recovered,
respectively.

3.4.2 Unsupervised models. Rahman et al. proposed an unsupervised machine learning based
dynamic lockdown framework. The clustering algorithm identifies dynamic clusters based on the
infected cases and mobility data. The clusters are marked for hard, moderate or no lockdown
depending on the number of active or suspected clusters in them [69]. Gollier incorporated the

, Vol. 1, No. 1, Article . Publication date: February 2018.
Towards a Unified Pandemic Management Architecture: Survey, Challenges and Future Directions 11

uncertainty of the infection status of an individual into the SIR epidemic model to infer the economic
impact of the lockdown imposed [70]. Similar to the study by Tadano [66], Bao et al. performed
regression analysis on 44 cities in northern China to show the strong association between reduction
in air pollution and strong lockdown [71].
 Bosi et al. challenge the notion of indefinite immunity of the recovered (or immunized) individu-
als [72]. They employ a dynamic equilibrium model to show that positive lockdown is useful when
the society is altruistic (i.e., willing to maximize collective rewards), while zero lockdown is an
optimal lockdown policy if the agents are selfish. Pichler et al. propose a dynamic input-output
model to gauge the ramifications of COVID-19 and its consequent lockdown on the demand and
supply chain of industries in the UK [73]. Fajgelbaum et al. proposed an optimization to solve the
planning problem of determining the traffic flow across districts in two Korean cities that reduce
the economic overheads due to uncoordinated lockdown measures as well as the loss of lives [74].
The social planner optimization formulation works as follows:

 ∫ ∞ ∑︁ ∼
 = max −( + ) [ ( , ) + × ( , ) − ( , )] (14)
 ( ) 0

This equation maximizes the discounted value of real net income considering loss of lives, where
 ( , ) is the real income of location at time based on the distribution of infected cases and
lockdown and ∼ is the income if the vaccine is freely available with probability . The variable
represents the expected income of the COVID victims (measured as their expected lifetime times
annual income minus the discounted value of wages) and ( , ) is the daily infected at location
at time .
 Askitas et al. proposed a multi-event model to study the effects of different overlapping and
non-overlapping intervention measures varying in timing, duration, and intensity on the overall
incidence of COVID-19 and the resultant mobility patterns [75]. Pestieau studied how the lockdown
strategies, namely uniform lockdowns and age-differentiated lockdowns, align with social welfare
criterion, balancing the trade-off between economy and lives lost [76]. Finally, Charpentier et
al. extended the SIR epidemic model to propose the optimal lockdown model that minimizes the
socioeconomic impact of the pandemic, while meeting the capacity of the ICU [77].

3.5 Contact tracing and mobility scheduling
The contact-tracing applications discussed in Sec. 3.2 already inform human mobility [78]. While
they are yet to get traction in the realm of pandemic management, the apps possessing simple user
interface and visual depictions of infection hotspots is truly the future of pandemic management [79].
Ranisch et al. pointed out that several ethical and humanitarian challenges, such as, data protection,
potential stigmatization of patients, social justice concerns, etc., need to be ironed out before these
apps get universal acceptance [80]. These apps are connected to smart mobile devices [81] or
embedded in wearables [82]. We now discuss the models some of which have been implemented as
mobile applications to recommend destinations so that contagion can be minimized.
 Hu et al. delineated the human mobility data sources and computational approaches that aid
computational research on pandemic management. They compared the attributes of these datasets
on the basis of privacy, quality of information, storage, processing and access [12]. Similarly,
Grantz discussed the applicability of mobile applications in transmission and control of contagion
as well as the implication of selection bias in mobile phone data [83]. Oliver et al. delve into
some of the shortcomings of such data-driven research and ways to overcome them through the
involvement of government and domain experts [84]. Benita et al. apply text mining to find themes

 , Vol. 1, No. 1, Article . Publication date: February 2018.
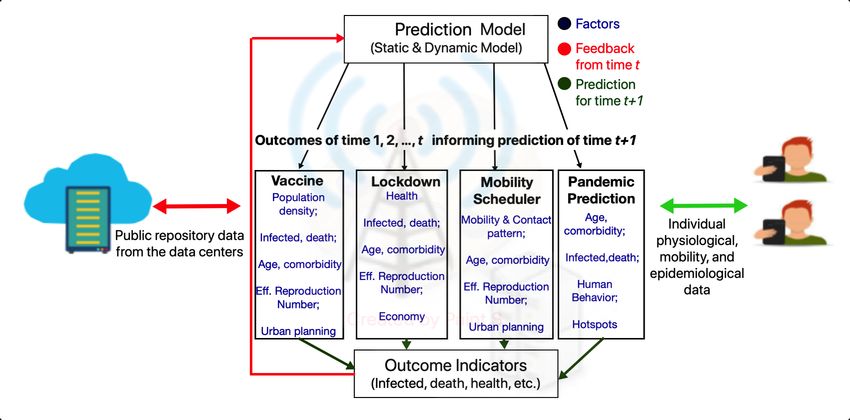
12 1, 1, 2, and 3 in scientific literature on human mobility behavior, while reporting keywords and future research directions [85]. Based on GPS-based mobility data from US counties, Tokey employed space-time cube, curve- fitting and regression to study the evolving relationship between human mobility and COVID daily infected cases over time with alteration in socioeconomic, demographic and geographic policies [86]. Loo et al. utilized mobility data from public places, like bars, shopping centres, karaoke/cinemas, mega shopping malls, public libraries, and sports centres, to learn the connectivity among populous zones and their potential to serve as infection hotspots [87]. Analogously, Orallo & Martinez explored the applicability of pure synthetic and simulated mobility models on predicting the risk of contagion [88]. Basu discussed how increasing dependency on private vehicles and dwindling mass transit ridership is a hindrance to affordable and sustainable urban mobility in the post-COVID world [89]. Fig. 5. Evolution of contagion potential (CP) over time. Every panel shows the location of nodes at time (1 ≤ ≤ ) and the spectrum of colors - dark red, light red, light blue and dark blue - represent increasing CP of the observed node (large circle) on contact with infected individuals (small circles). Roy et al. leveraged network science to propose three optimization strategies, which will result in social networks that minimize contact between the infected and susceptible individuals [90]. As part of the same goal, they introduced the notion of contagion potential that measures, on a scale of 0 to 1, the likelihood of an individuals to act as spreaders of contagion (CP). Instantaneous CP ( ( )) of an individual is measured as the number of infected people (s)he comes in contact with at time (see Fig. 5). The overall CP till time is calculated as the mean instantaneous value CP, as follows: 0, ∈ , ( ) = 1, ∈ 1 Í ( ) Otherwise =0 They introduced a mobile app, called MyCovid, that includes a case study on the proposed optimiza- tion strategies and guide the users’ mobility to minimize contagion. With prior user permission, the app creates a repository of mobility traces and enables research on informing mobility during outbreaks. Serafino et al. explored the GPS traces of mobile devices in Latin America to infer a social contact network, based on the duration of contact and proximity between the infected and susceptible individuals [81]. They demonstrated that the lockdown reduced human mobility, but did not , Vol. 1, No. 1, Article . Publication date: February 2018.
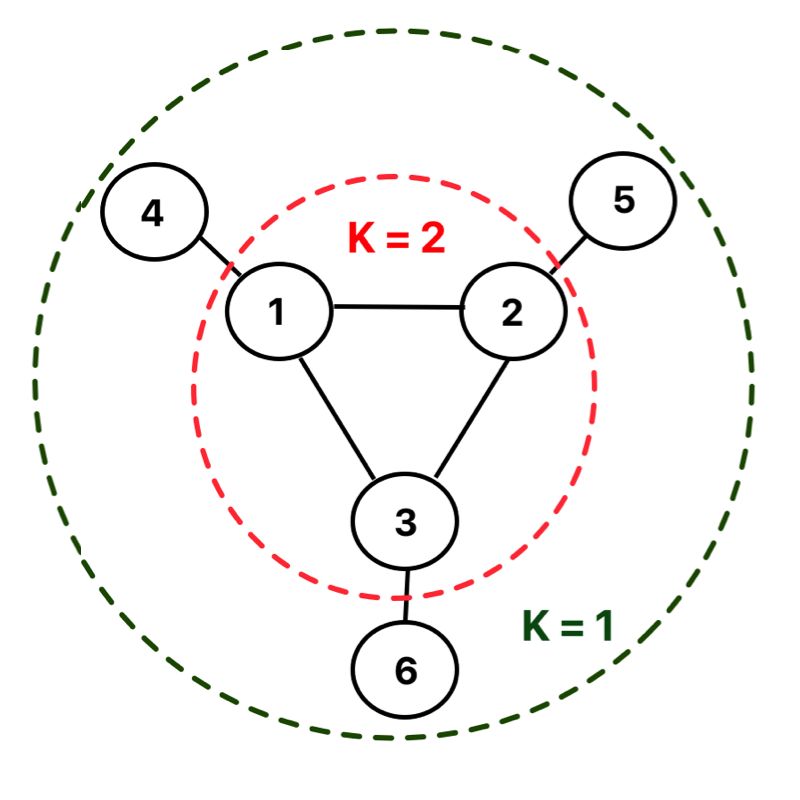
Towards a Unified Pandemic Management Architecture: Survey, Challenges and Future Directions 13

impede disease spread. They employ percolation theory to explain this idea. In bond percolation,
the network connectivity is reduced by removing a small fraction of links (bonds) in the contact
network. Serafino measure network connectivity in terms of the size of the giant connected
component (GCC) (calculated as the largest set of nodes such that each node is reachable from
every other node in that list). Through network analysis, they depict that the lockdown measures
causes a drop in GCC, thereby causing the dense contact network to be reduced to several modules
of strongly connected modules.

Fig. 6. A 6-node network with = 2, where 2-core and 1-core nodes are marked red and green, respectively

However, despite the drop in GCC, the number of cases continued to grow, albeit at a lower pace.
Serafino used the notion of − core [91] to explain this phenomenon. − core is obtained by
iteratively pruning the lowest degree nodes from the network (see Fig. 6). The high K-cores possess
a high disease transmission persistence. Despite the absence of the GCC, the maximal k-core
remained in the contact network, resulting in growing cases. Similarly, Roy et al. also employed
machine learning and network science concepts, like coloring and clustering, on daily infected
cases in New York City to propose interdiction strategies that mitigate contagion through restricted
human mobility, while meeting economic goals [92].

3.6 Pandemic Prediction and Travel Policy
In Sec. 3.5, we discussed mobility scheduling techniques which employ computational models on
human mobility data to inform short-distance mobility. The current section is dedicated to a survey
on efforts to make spatiotemporal prediction that determine global pandemic-related travel policy.
Gao et al. proposed a spatiotemporal attention network (STAN) approach for pandemic predic-
tion [93]. The proposed framework leverages static features (namely, geographic and demographic
data of states and counties) and dynamic features (namely, daily infected counts). Fig. 7 shows that
the framework constructs locations graphs with zones as nodes and inter-zone interaction as links
for the static and dynamic features.
STAN utilizes a graph attention network (GAT) to learn the spatiotemporal interaction across zones.
GAT network employs a multihead approach to learn attention scores denoting the interaction
between any pair of zones (refer to Sec. 2.3 for summary on graph theory) and combines the
attention scores to infer the embedded representation of the zones. Subsequently, STAN processes

 , Vol. 1, No. 1, Article . Publication date: February 2018.
14 1, 1, 2, and 3

the graph embedding with a gated recurrent unit (GRU) – a type of recurrent neural network –
to predict the future epidemiological parameters and infection and recovery counts and update
the loss terms. Gao et al. discuss the applicability of STAN in building spatiotemporal models for
disease status and healthcare resource utilization [93].

Fig. 7. Spatiotemporal prediction architecture [93], which employs graph attention network (GAT) and gated
recurrent unit (GRU) to predict future trends in infection and recovery.

 Pinter et al. introduced a hybrid model that combines network-based fuzzy inference system
and multi-layered perceptron-imperialist competitive algorithm to predict the infected and death
counts in Hungary [94]. Kumar et al. used PROPHET and ARIMA disease forecasting models to
gauge the trends in contagion in US, Spain, Italy, France, Germany, Russia, Iran, United Kingdom,
Turkey, and India [95]. Singhal et al. also proposed a mathematical series-based model and Fourier
decomposition method to predict trends in future cases in India, Italy, and USA [96]. Chowdhury
et al. introduced a multivariate model that uses epidemiological and clinical parameters to forecast
the spread trajectory in 16 countries [97].
 Like Kumar, Oguntokun et al. and Alzahrani et al. employed the ARIMA model to evaluate the
possibility of air- and water-based transmission of the pathogen and the impact of preventive
measures on contagion in India and Saudi Arabia, respectively [98, 99]. Kristjanpoller et al. presented
frameworks that exploited meta-learners and causal forest models to achieve dynamic quarantine
policy and model intervention during future outbreaks. They validated the dynamic policy on
the epidemiological data of Chile because of its high infection numbers and socioeconomic and
demographic heterogeneity [100]. Finally, Luo discussed the variables influencing the accuracy
of the time-series prediction models, namely, new strains, human behavior, politics, etc., and
emphasized on the need for predictive monitoring to better understand their efficacy [101].
 Watson et al. used Bayesian time series model and a random forest algorithm to predict infected
cases and death numbers. Specifically, the Bayesian model is trained on the cumulative case count
to project distribution of future cases, while the random forest algorithm works in tandem with
the epidemiological model to predict pandemic deaths [102]. Roy et al. introduce a spatiotemporal
network-inference approach that uses a sliding window to scan daily infection numbers. The
resultant temporal networks quantify the potential of inter-zone infection spread and help identify
zones with a high outflow of link weights as ones acting as disease hotspots [103]. Zhang et al.
introduced a minimization formulation that determines the extent of intervention over a period of
 days in terms of the population size [104], measured as:

, Vol. 1, No. 1, Article . Publication date: February 2018.
Towards a Unified Pandemic Management Architecture: Survey, Challenges and Future Directions 15

 1 ∑︁
 min ( ) (15)

 =1

In the above equation, ( ) denotes the prediction error in cumulative infection for a given
population count .
 Mehta et al. implemented a machine learning approach on fused health statistics, demographics,
and geographical datasets to gauge the course of the pandemic. They predicted the risk of outbreaks
in the US counties on the basis of their urban and vulnerable population demography [105]. Ahmad
et al. discussed the role of big data analytics and IoT in designing a neural network-based health
monitoring framework that possess diagnostic, predictive, and prescriptive capabilities to predict
the future of the pandemic [106]. Similarly, Kavadi et al. presented a Nonlinear Global Pandemic
Machine Learning model for global pandemic prediction. They applied the model on demographic,
clinical and epidemiological data of Indian states to show its efficacy in pandemic prediction [107].

4 PANDEMIC MANAGEMENT ARCHITECTURE
4.1 Architecture Overview
We propose a three-layer architecture for managing future pandemic situations. Currently, different
federal governments’ systems for the COVID19 pandemic management are ad-hoc and loosely
coupled. These systems lack a proper and coherent ecosystem needed for dynamic decision-making.
Our envisioned ecosystem will gather sensory data from citizens (such as co-location information,
the health status of the individual, and so on.), share them dynamically over the network to remote
servers, fuse the ground data with the historical time-series epidemiological data fed from various
other sources at the servers, and sends messages to civic authorities as well as users to take
appropriate measures.
 A schematic representation of our envisioned architecture is given in Fig. 8. It consists of three
distinct layers – (1) cloud layer; (2) edge computing layer; and (3) end device layer. We propose
using the edge computing paradigm to provide networking support for collecting and sharing
data across the different layers. The objective of edge computing is to introduce an intermediate
computing layer between the end device (bottom) and cloud layers (top) such that compute, storage,
and communication services can be brought to the edge of the end devices’ network. Another
motivation behind using edge computing is to handle the massive scale of the end devices and
the petabytes of digital footprint they create nowadays. Offloading sensory data onto remote
servers creates bandwidth bottlenecks in the backhaul networks, increasing delay and performance
loss. Thus, if the sensory data are delegated to edge nodes that are in proximity to the network
edge, not only bandwidth wastage in backhaul networks can be avoided, but also response time,
throughput, and latency can be improved to facilitate a better user experience. We describe the
different components of this architecture below.
4.1.1 Core network. The core network (Internet), managed by several regional ISPs, hosts a plethora
of epidemiological, healthcare, and demographic data hosted by different sources. These sources
include Worldometer, CDC-USA, Johns Hopkins CSSE, and Ministries of Health or other Govern-
ment Institutions and Government authorities’ social media accounts. Some of the features of such
data are – population count, population density, number of cases (infection count), mortality rate,
R-factor, number of vaccine doses administered, number of tests performed, the spread of infection
in terms of count per ten thousand/hundred thousand/million and so on. Also, healthcare data on
the number of hospitals, number of beds in the COVID ward per hospital, availability status of
COVID19 related medicines, etc., are made available in these data stores. All data can be of different

 , Vol. 1, No. 1, Article . Publication date: February 2018.
16 1, 1, 2, and 3

Fig. 8. The pandemic management architecture comprising the cloud layer, edge computing layer, and mobile
users.

granularities depending on the macro-level or micro-level views. Most of them are time-series data
updated tentatively after every 24 hours.
4.1.2 Cloud layer. This layer consists of an array of high-performance servers hosted in the cloud
capable of handling large data volumes and carrying out massive computation tasks in parallel.
The cloud-hosted servers will periodically (maybe once in a few hours) pull data from different
sources and maintain an updated repository. The servers use IPv4/IPv6 routing as the backbone

, Vol. 1, No. 1, Article . Publication date: February 2018.
Towards a Unified Pandemic Management Architecture: Survey, Challenges and Future Directions 17

network technology to pull data from the public/paid APIs provided by various sources on the
Internet. This data is used by the following four significant modules (discussed later in Sec. 4.2)
running in these servers:
 • Vaccine allocation: This module will find optimal vaccine allocation strategies across different
 zones of geographical space (city, county/district, state, etc.).
 • Dynamic lockdown: This module is responsible for determining if any zone requires lockdown
 (partial or complete) based on its current healthcare facilities available, infection spread,
 mobility of people, and other factors.
 • Contact tracing and mobility scheduling: The purpose of this module is to find people who are
 close to an infected individual. If any zone is found to have many unvaccinated and exposed
 individuals, then a spatiotemporal schedule can be recommended to curb the uncontrolled
 movement of large masses across the zone.
 • Pandemic prediction: In this module, one or more prediction algorithms will be running to infer
 the likelihood of an outbreak of the pandemic situation at a particular zone. The algorithm will
 use healthcare infrastructure data, all types of epidemiological data, and mobility and contact
 tracing information for making the prediction. Such predictions will enable decision-makers
 to allocate additional resources to that zone and prevent an unforeseen health crisis owing to
 the pandemic.
4.1.3 Edge computing layer. The edge computing layer consists of a network of mobile edge
computing (MEC) servers [108], each co-located with a cellular base station. MEC servers are
managed by different mobile network operators and have heterogeneous system resources (CPU,
memory, storage, bandwidth). A MEC server uses the radio access networks (RANs) of its co-located
base station to collect sensory data from citizens spread across multiple neighborhoods of a borough
in an urban city. Therefore, several MEC servers will be deployed in different boroughs to collect as
much human-sensed data as possible from different neighborhoods across the city. The pandemic
management agencies need to roll out smartphone-based app(s) for collection of citizens’ data who
are at different neighborhoods. We assume this/these app(s) is/are installed by the users on their
devices and necessary permissions are granted for data collection.
 The MEC servers can provide on-demand compute, cache, and communication services to data
collection application(s) running on the user devices. The server instances for these applications
run on the MEC servers. They are responsible for collecting information on vaccination status
and epidemiological condition (i.e., susceptible, infected or recovered) from individual users and
location (waypoint) information from the devices. The periodic waypoint information enables the
server to trace out the mobility of the users and also the places they are making visits. The past
application data collected from the users is pushed to the back-end cloud servers periodically. This
is useful in situations when the mobile users migrate to a new neighborhood beyond the control of
its current MEC. The architecture handles this handoff by allowing the new MEC to download the
pertinent information of that user.
 The instances of the modules running on the cloud servers will also be hosted in the MEC servers
to enable dynamic decision making at the edge of the users’ networks. These computation modules
will leverage the sensory data collected from the public and fuse them with the historical ones
(pulled from the back-end cloud storage) to develop recommendation(s) for the stakeholders (civic
authorities, healthcare specialists, caregivers, public). However, if any MEC server is overloaded or
unequipped with computational resources, the computation of the modules will be offloaded to the
cloud.
 The application(s) hosted in MEC can send alerts to the individuals if they are currently present
in a large gathering with a few infected people or if their health status necessitates isolation at the

 , Vol. 1, No. 1, Article . Publication date: February 2018.
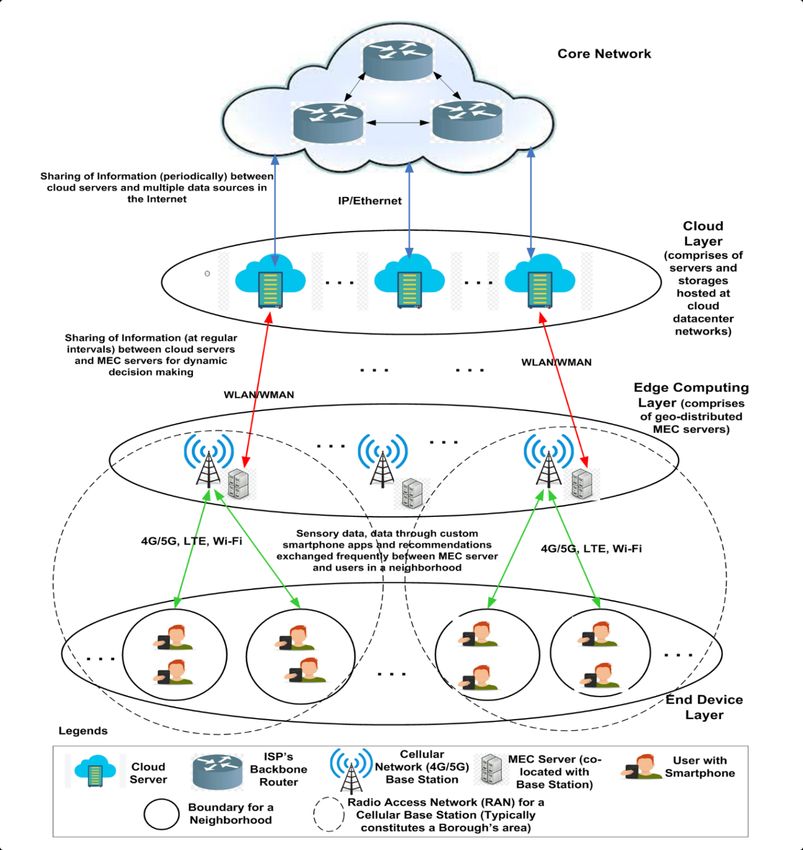
18 1, 1, 2, and 3

earliest. For communicating with cloud servers, the MEC servers will use Wi-Fi/WiMax as carrier
technologies, while for gathering ground-level public data, wireless technologies such as Wi-Fi,
LTE, 4G/5G, etc., will be used.

4.1.4 End device layer. The end device layer consists of tens of hundreds of intelligent hand-held
IoT devices such as smartphones, wearables, tablets, etc., possessed by citizens moving around an
urban area. We collectively refer to them as user equipment (UE). These users, present in different
neighborhoods and boroughs, are expected to install and register with the COVID19 app(s) and
allow it/them to collect UEs’ location information opportunistically. Besides this, the app(s) will
also request the users to share information related to his/her vaccination status, current health
condition, and previous health history (if any). The app(s) will push notifications from time to time,
asking the user to update the information provided if required and also send notifications regarding
the appropriate measures the individual has to undertake.
 The UEs can either use Wi-Fi or LTE/4G/5G communication or a combination of the two (in
hand-off scenarios to support mobility) to upload data to the application server(s) running on
the MEC servers. To support dynamic decision making in presence of mobility, the proposed
architecture should enable migration of relevant data if any user changes position from one RAN
to the other. In such scenario, following the network hand-off, once the user signs back in to the
app, his/her location is updated and corresponding epidemiological data will be migrated from
cloud storage to the nearest MEC server for sending health advisory alerts and recommendations.

Overview of the architecture. Let us discuss a pandemic stack (see Fig. 9) that captures the logical
flow of the proposed pandemic management architecture. The first layer is the application layer
that operates in two ways: (1) use of the mobile (crowdsensing and contact-tracing) applications
(refer to Sec. 3.2) to collect individual clinical, epidemiological and physiological data and (2) the
application programming interfaces to store and access data from the cloud servers. The next layer
is the privacy (and security) layer that ensures the data is obfuscated in a manner that the sensitive
user information is hidden away, while maintaining data utility (refer to Sec. 4.3). Next, the storage
layer, comprising the data servers as well as local smart device memory, stores the anonymized data.
As depicted in Fig. 8, the network layer allows the interaction between (1) cloud and edge layers, (2)
edge and mobile layers and (3) mobile users (see Fig. 5.2) through WLAN, WMAN, LTE, 4G/5G,
Wi-Fi, etc. technologies. Finally, there is the computational layer that applies the computational
models on the structured data to make prediction and recommendations over time.

4.2 Details of Intelligent Computation Modules
This section elucidates the workings of the four intelligent computation modules, the instances of
which are running on both the MEC and the cloud servers. Fig. 10 shows that the intelligent compu-
tation modules receive the data from the public repositories as well as the mobility, epidemiological
and physiological data from the mobile users, and decides (in four separate modules) the vaccine
distribution, dynamic lockdown, mobility schedules, and pandemic policy across the stipulated
zones. Lastly, the effect of the four modules are reflected in the form of outcome variables recording
the daily new infections, deaths, and the consequent pressure on the healthcare infrastructure of
the zones.
 The computation modules have three features. First, the static and dynamic prediction model (see
Sec. 4.2.3) that informs modules of the outcomes from earlier decisions and predicts future trends
of inputs. Second, each module processes a predefined list of factors (refer Sec. 4.2.1) from the input
data and the information from the prediction models. A module may apply several computational

, Vol. 1, No. 1, Article . Publication date: February 2018.
Towards a Unified Pandemic Management Architecture: Survey, Challenges and Future Directions 19

models separately and fuse their solutions using integration algorithms (see Sec. 4.2.2) to arrive
upon decisions. Let us discuss each feature.
4.2.1 Socioeconomic, demographic and epidemiological factors. We discuss the colored factors
that serve as inputs (marked blue in Fig. 10) to the four modules. (In Sec. 3, we have discussed
the computational studies on vaccine distribution, dynamic lockdown, mobility scheduling and
pandemic prediction that utilize these factors to draw inferences.)

 Fig. 9. Logical flow of the pandemic stack

 Vaccine distribution. The vaccine distribution module determines the number of vaccines received
by zones based on the following key factors (delineated during the survey in Sec. 3.3.1). (This
module can be extended to distribute drugs to treat symptoms of the virus.) Since population density
determines the frequency and duration of interaction among individuals, the vaccine distribution
modules may attempt to distribute more vaccines to densely populated zones [21, 64]. The module
may distribute vaccines based on the disease transmissibility, gauged in terms of reproduction
number (see Sec. 2.2), among the zonal population [61]. The proportion of the elderly individuals
with comorbidities may be a determinant of vaccine distribution [63]. Poor socioeconomic condition of
the population or urban planning of a zone may be grounds for the inoculation of its population [65].
 Dynamic lockdown strategies. This module determines the duration and extent of lockdown to
be imposed on zones depending on the changing socioeconomic and epidemiological conditions.
The module may recommend the imposition of stricter lockdowns in zones with a poor healthcare
infrastructure [67, 68] to prevent the patients from being denied treatment in the event of severe
outbreaks [109]. Since lockdowns have economic overheads, the module must strike a balance
between contagion and economy [70, 76]. It may assess how the restrictions disrupt the supply-
demand chain of industrial sectors [73]. Finally, age and comorbidity is another factor contributing
towards lockdown recommendations.

 , Vol. 1, No. 1, Article . Publication date: February 2018.
You can also read