Eastern Bay of Plenty Road Safety Strategy 2015-18
←
→
Page content transcription
If your browser does not render page correctly, please read the page content below

Eastern Bay of Plenty Road Safety Strategy 2015-18

   Eastern Bay of Plenty

Road Safety Strategy 2015-18

                                                                 2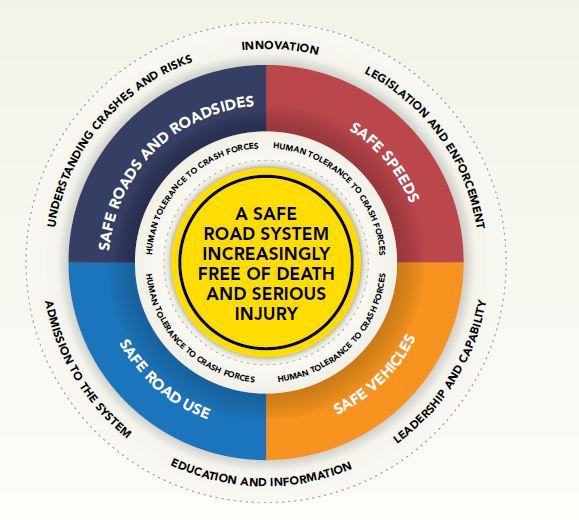
Eastern Bay of Plenty Road Safety Strategy 2015-18

TABLE OF CONTENTS

1      BACKGROUND .................................................................................................................................................... 4
2      VISION ................................................................................................................................................................ 5
3      THE EASTERN BAY OF PLENTY CLUSTER .............................................................................................................. 5
     3.1       Key characteristics ............................................................................................................................................. 6
     3.2       Roading network and registered vehicles ......................................................................................................... 8
4      ROAD SAFETY POLICY FRAMEWORK ................................................................................................................. 10
     4.1       National framework ........................................................................................................................................ 10
     4.2       Regional framework ........................................................................................................................................ 12
     4.3       Delivery model for the Eastern Bay cluster ..................................................................................................... 12
     4.4       Implementing the delivery model ................................................................................................................... 13
5      ROAD SAFETY ISSUES IN THE EASTERN BAY CLUSTER ....................................................................................... 15
     5.1       Crash numbers and casualties ......................................................................................................................... 15
     5.2       High social costs in the Eastern Bay ................................................................................................................ 16
     5.3       Communities at risk ......................................................................................................................................... 16
     5.4       A snapshot of age, gender and ethnicity of drivers at fault ............................................................................ 17
     5.5       Crash factors .................................................................................................................................................... 19
6      EASTERN BAY ROAD SAFETY RISK AREAS .......................................................................................................... 20
     6.1       Speed ............................................................................................................................................................... 20
     6.2       Rural roads ...................................................................................................................................................... 20
     6.3       Alcohol and drug impairment.......................................................................................................................... 21
     6.4       Distraction ....................................................................................................................................................... 22
     6.5       Young drivers ................................................................................................................................................... 22
     6.6       Restraints......................................................................................................................................................... 23
     6.7       Older road users .............................................................................................................................................. 23
     6.8       Other contributing factors............................................................................................................................... 24
7      IMPLEMENTATION OVERVIEW ......................................................................................................................... 25
     7.1       Eastern Bay of Plenty Signature project .......................................................................................................... 26
8      FUNDING SOURCES........................................................................................................................................... 27
     8.1       New Zealand Transport Agency ...................................................................................................................... 27
     8.2       Police activities ................................................................................................................................................ 27
     8.3       ACC .................................................................................................................................................................. 27
9      LINKING WITH OTHERS ..................................................................................................................................... 28
10     MONITORING ................................................................................................................................................... 28
Appendix 1: Summary statistics for crashes within identified priority risk areas between 2009-13 .......................... 29
Appendix 2: Priority areas in the Eastern Bay ........................................................................................................... 31
References ................................................................................................................................................................ 33

                                                                                                                                                                                      3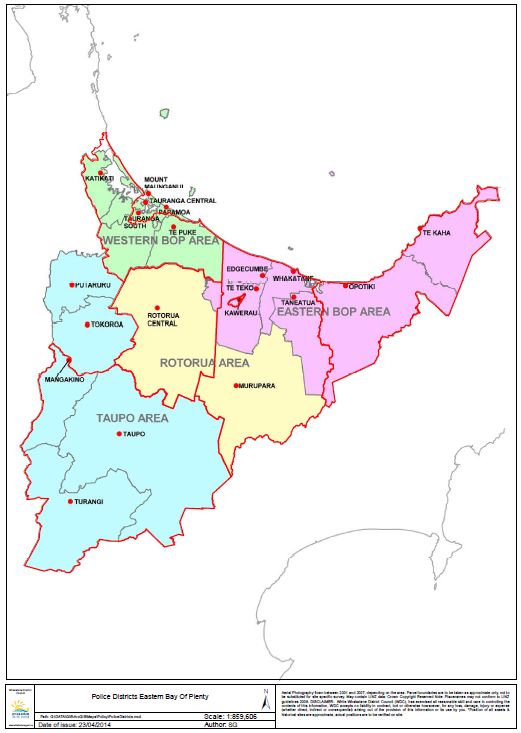
Eastern Bay of Plenty Road Safety Strategy 2015-18

1    BACKGROUND

Road safety is a complex issue. Statistics illustrate that the Eastern Bay of Plenty is a vulnerable area in
terms of road safety, with high social costs across the sub-region amounting to over $419 million over the
last five years (2009-13). A multifaceted approach to road safety is needed in the Eastern Bay along with
clear operational policy, the development of community responsibility and integrated stakeholder
involvement.

This strategy provides a framework for road safety. It essentially sets the direction and actions for the
Eastern Bay cluster over the next three years.

The purpose of this document is to ensure that the road safety programme is strategically led and
encourages communities to take greater responsibility for the driving behaviours of citizens. In particular, it
aims to:

       1. Provide high level strategic direction for road safety education in the Eastern Bay of Plenty
       2. Address local road safety needs by targeting risk areas and populations ‘at risk’
       3. Link with other areas across Councils’ activities to identify opportunities for integrating road
          safety education and risk management initiatives
       4. Outline a set of realistic actions that support the Eastern Bay of Plenty road safety vision
       5. Support other agencies working in road safety education at all levels, including aligning with the
          New Zealand Police education calendar

Road safety is an issue that involves a wide range of factors, including the engineering of roads and
roadsides, quality of vehicle fleets, and changing driving behaviours through education and promotion. It is
acknowledged that all these factors are important for improving road safety. This strategy’s focus,
however, is on changing driver behaviours through education and promotion in the Eastern Bay.

                                                                                                                    4
Eastern Bay of Plenty Road Safety Strategy 2015-18

2   VISION

          Working together to ensure a safe Eastern Bay of Plenty road system that is
          increasingly free of death and serious injury.

3   THE EASTERN BAY OF PLENTY CLUSTER

Eastern Bay communities are over represented in terms of road safety risk. The Eastern Bay of Plenty
cluster refers to the Kawerau, Ōpōtiki and Whakatāne Districts. A map showing the cluster area and the
related Police boundaries is shown in Figure 1.

               Figure 1: Map of the Eastern Bay area showing district council and policing boundaries

                                                                                                                    5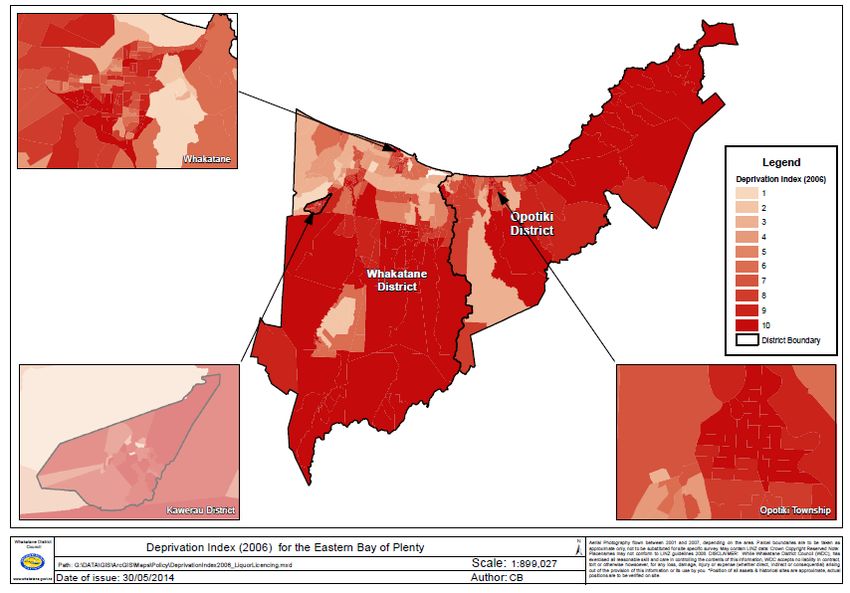
Eastern Bay of Plenty Road Safety Strategy 2015-18

3.1       Key characteristics

The Eastern Bay cluster has three main urban centres (Whakatāne, Ōpōtiki and Kawerau) and many small,
rural, isolated communities scattered throughout, particularly along the coast. Key demographic factors
characterising the Eastern Bay cluster, based on the 2013 Census, include (refer to Table 1 for more detail):

            •       Low population numbers
            •       Declining or static populations
            •       High levels of deprivation
            •       Low employment levels
            •       High proportions of low income earners
            •       High proportions of Māori and European ethnicities
            •       Low proportions of the population in the 20-30 year age group
            •       High proportions of the population in the under 15 year and over 65 year age groups.

Table 1: Demographic factors for Kawerau, Ōpōtiki and Whakatāne for 2013
      District                 Summary of demographic factors
      Kawerau                 • 6,363 people usually live in Kawerau District
                              • Total population has decreased by 558 people since 2006 Census
                              • Females make up 51.1 percent of the total population
                              • 582 people (12.3%) of the labour force are unemployed
                              • 2,742 people (58.1%) of the labour force have an income of $30,000 or less
                                                                                                                    1
                              • 3,477 Māori usually live in Kawerau District (50.5 percent of the total population)
                              • 17.6 percent are aged 65 years and over
                              • 25.8 percent are aged under 15 years
                              • 61.1 percent of people over 15 years have a formal qualification and 6.1 percent
                                   hold a bachelor’s degree or higher as their highest qualification
                              • 62 percent of households in occupied private dwellings owned the dwelling or held
                                   it in family trust
                              • Median weekly rent paid was $180

          Ōpōtiki                  •   8,433 people usually live in Ōpōtiki District
                                   •   Total population has decreased by 543 people since 2006 Census
                                   •   Females make up 50.5 percent of the total population
                                   •   393 people (6.0%) of the labour force are unemployed
                                   •   3,501 people (53.8%) of the labour force have an income of $30,000 or less
                                   •   4,518 Māori usually live in Ōpōtiki (53.6 percent of the total population)
                                   •   17.2 percent of people are aged 65 years and over
                                   •   22.8 percent of people are aged under 15 years
                                   •   65.6 percent of people over 15 years have a formal qualification and 8.7 percent
                                       hold a bachelor’s degree or higher as their highest qualification
                                   •   59.3 percent of households in occupied private dwellings owned the dwelling or
                                       held it in family trust
                                   •   Median weekly rent paid was $170

      1
        The Māori ethnic population is the count for people of the Maori ethnic group. It includes those people who
      stated Māori as being either their sole ethnic group or one of several ethnic groups.

                                                                                                                          6
Eastern Bay of Plenty Road Safety Strategy 2015-18
Whakatāne • 32,688 people usually live in Whakatāne District
• Total population has increased by 609 people since the 2006 Census
• Females make up 51.7 percent of the total population
• 1,689 people (6.7%) of the labour force are unemployed
• 12,180 people (48.5%) of the labour force have an income of $30,000 or less
• 13,032 Māori usually live in Whakatāne District (39.9 percent of the total
population)
• 15.3 percent of people in Whakatāne District are aged 65 years and over
• 23.2 percent of people are aged under 15 years
• 72.6 percent of people over 15 years have a formal qualification and 13 percent
hold a bachelor’s degree or higher as their highest qualification
• 63.1 percent of households in occupied private dwellings owned the dwelling or
held it in family trust
• Median weekly rent paid was $220
Source: Statistics New Zealand. Census data, 2013.
The deprivation index is an index of socioeconomic deprivation based on the 2006 census mesh-blocks
from Statistics NZ. It combines nine variables from the 2006 2 census into a deprivation score for each mesh-
block, reflecting the level of deprivation. The map (Figure 2) shows deprivation levels for all of the Eastern
Bay of Plenty showing the high levels (10 is highest level of deprivation) throughout most of the three
districts which puts the cluster amongst some of the most deprived communities in New Zealand.
Figure 2: Map of the Eastern Bay area showing deprivation levels
2
This information is not yet available for the 2013 Census data.
7Eastern Bay of Plenty Road Safety Strategy 2015-18
3.2 Roading network and registered vehicles
The three districts are served primarily by the State Highway (SH) network (refer Figure 3), which includes:
• SH2 running from Tauranga to Gisborne via Whakatāne and Ōpōtiki districts
• SH30 between Rotorua and Whakatāne
• SH34 linking Kawerau with SH2 at Awaiti, west of Edgecumbe, and SH30 near the Rotomā hills
• SH35 which follows the coastal route around the East Coast between Ōpōtiki and Gisborne
Other key local roads within the region include:
• Thornton Road / Wainui Road, which together form the Coastal Arterial Route through Whakatāne
and Ōhope, along the coast from Matatā in the west and around the inner margins of the Ōhiwa
Harbour to Matakerepu in the east
• Galatea Road, running from SH2 between Te Teko and Awakeri, south into the Kāingaroa
hinterland, towards Murupara
• Pokairoa Road / Ngamotu Road, running from Galatea Road, just south of the Matahina Dam,
southwest to the boundary with the Rotorua District at Rerewhakaaitu (an increasingly popular
alternative route south)
• Ruatāhuna Road – Waikaremoana Road, the old SH38 which links the Bay of Plenty with Wairoa
District via Ruatāhuna, Waikaremoana and the Te Urewera National Park.
The cluster had 38,931 registered vehicles in 2012, 360 km of state highways and 412 km of local roads
(refer Table 2). Centre for Road Safety Intelligence (2013) reported that the cluster fleet is older on average
than the rest of the country and less likely to have a current Warrant of Fitness (WoF).
Table 2: Registered vehicles and roading network for the districts in the Eastern Bay cluster
No. registered vehicles Length of SHs (kms) Length of local roads
(kms)
Whakatāne 27,163 153 998
Ōpōtiki 7,130 201 370
Kawerau 4,638 6 44
TOTAL 38,931 360 412
8Eastern Bay of Plenty Road Safety Strategy 2015-18
Figure 3: Map of the Eastern Bay area showing the main roading network
9Eastern Bay of Plenty Road Safety Strategy 2015-18
4 ROAD SAFETY POLICY FRAMEWORK
There are three tiers to the policy framework for road safety – national, regional and sub-regional (local). A
number of relevant documents at each tier influence this road safety strategy. Figure 4 illustrates the
policy framework and the relevant documents at each tier.
Figure 4: Policy framework for road safety
•Land Transport Management Act 2003
•GPS on Land Transport Funding
National •National Land Transport Programme 2012-15 & 2015-18
•Safer Journeys Road Safety Strategy 2010-20
•Safer Jorney's Action Plan 2013-2015
•BOPRegional Land Transport Strategy
Regional
•Road Safety Action Plan 2013/14
•Eastern BOP Strategy
Local •Eastern Bay Activity List
4.1 National framework
Nationally, road safety is guided through the following key documents.
Land Transport Management Act 2003 (LTMA) is the legal framework for the development and
management of the land transport system. Safety is one of the key purposes of the LTMA.
Government Policy Statement on Land Transport Funding (GPS) sets out the desired outcomes and
priorities for the land transport sector. Road Safety is one of three priority areas for the GPS, along with
economic growth and productivity, and ensuring value for money.
National Land Transport Programme (NTLP) 2012-15 gives effect to the GPS with a $12.28 billion
investment over the three year period.
Safer Journeys Road Safety Strategy 2010-2020 (Safer Journeys) is the Government's strategy to guide
improvements in road safety over the period 2010–2020. The strategy envisions a safe road system
increasingly free of death and serious injury and introduces the Safe System approach to New Zealand.
Safer Journeys highlights the need for a multifaceted approach to achieve the vision of a safe road system
increasingly free of death and serious injury. There is a need to work across all elements of the Safe System
(roads, speeds, vehicles and road use) and advocate that everyone has a responsibility for road safety.
The current Safe System approach represents a fundamental shift in the way we think about road safety in
New Zealand and acknowledges that even responsible people make mistakes. The objectives of the Safe
System are to:
10Eastern Bay of Plenty Road Safety Strategy 2015-18
• Make the road transport system more accommodating of human error
• Manage the forces that injure people in a crash to the level the human body can tolerate without
serious injury
• Minimise the level of unsafe road user behaviour
The Safe System approach delivered through Safer Journeys is illustrated in Figure 5. Four main
cornerstones used in The Safe System are safe roads and roadsides, safe speeds, safe road use, and safe
vehicles:
Safe roads and roadsides – The goal is to improve the safety of roads and roadsides to significantly
reduce the likelihood of crashes occurring and to minimise the consequences of crashes when they
do occur.
Safe speeds – Managing speed on the road network is crucial to reducing deaths and serious injuries,
because the consequences of all crashes are strongly influenced by impact speed.
Safe road use – The goal is road users who are skilled, competent, alert and unimpaired; they comply
with road rules, take steps to improve road safety and expect safety improvement.
Safe vehicles – The goal is to have a forgiving vehicle fleet that helps to reduce or avoid error, recover
from error, and absorb crash forces. This means we'll have more vehicles in the fleet that help
prevent crashes from occurring and which better protect drivers, riders, passengers and other road
users in the event of a crash.
Safer Journeys Action Plan 2013-2015 is the second action plan building on Safer Journeys.
Figure 5: The Safe System
Source: Safer Journeys: New Zealand’s Road Safety Strategy 2010-2020
11Eastern Bay of Plenty Road Safety Strategy 2015-18
4.2 Regional framework
Regional authorities must include road safety in regional land transport strategies and plans and
programmes. The Bay of Plenty Regional Land Transport Strategy 2011-2014 (Regional Strategy) sets the
direction for the region’s land transport system for the next 30 years. The region’s vision for transport is the
best transport systems for a growing economy and a safe and vibrant Bay lifestyle. The safe system
approach in Safer Journeys provides the direction for road safety in the Bay of Plenty via the Regional
Strategy. The Strategy sets out that the following ‘fatal five’ contributing factors to fatal and serious crashes
will be targeted: speed, drink and drug driving, not wearing a restraint, dangerous and careless driving, and
high-risk drivers.
Safety and personal security outcomes sought through the strategy are that deaths and serious injuries on
the region’s roads are reduced, people understand and contribute to a safety culture that is supported by a
safe system approach to road safety, and transport corridors and public spaces are safe and secure
environments to use and people feel safe using them.
Bay of Plenty Regional Council’s Road Safety Action Plan 2013/14 contributes to the Safer Journey
initiatives and road safety outcomes in the Regional Strategy by aiming to seek to fully understand crash
risks in the region, identify regional road safety priority areas, and collaboratively develop and deliver a
regional road safety campaign.
4.3 Delivery model for the Eastern Bay cluster
Road safety is a shared responsibility across the Eastern Bay. The Eastern Bay cluster is made up of the
Kawerau, Ōpōtiki and Whakatāne District Councils as well as Bay of Plenty Regional Council. The Road
Safety activity delivers a number of programmes to help promote the safety of the community on our
roads. The existing model allows stakeholders to come together at all levels of planning and operations. For
this structure to be successful, it needs to have strong governance, shared responsibility and ongoing buy-
in from all parties. Road safety also needs to be strategically led, integrated and coordinated to be
effective. The model for delivery is described below and in Figure 6.
Eastern Bay Road Safety Committee and its members are accountable for the outcomes of the Eastern Bay
Road Safety activity. They provide the governance, strategic direction, oversight and leadership to ensure
Eastern Bay roads are increasingly free of death and serious injury. The committee is made up from
representatives from the following organisations:
• Whakatāne District Council
• Kawerau District Council
• Ōpōtiki District Council
• Bay of Plenty Regional Council
• New Zealand Transport Agency (NZTA)
• Road Transport Association New Zealand (RTANZ)
• Police
• Accident Compensation Corporation (ACC)
12Eastern Bay of Plenty Road Safety Strategy 2015-18
Road Safety Coordinator reports to the Committee directly and also liaises with the Operations Group and
programme providers. This role is pivotal in coordinating all road safety activities for the Eastern Bay cluster
and includes the development of the road safety activity list. It does this through the development and
delivery of education and promotion initiatives for road safety on behalf of the three represented
authorities in the cluster (Kawerau, Ōpōtiki, Whakatāne District Councils). The Bay of Plenty Regional
Council also has a Road Safety Coordinator and has an overview of the whole Bay of Plenty region.
Coordination of external programme providers is also part of this role through the provision of funding
support and monitoring of delivery outcomes.
Eastern Bay of Plenty Road Safety Operations Group’s purpose is to provide a forum to contribute and
plan the coordinated delivery of road safety actions in the Eastern Bay cluster. This group is made up of
transport managers from each district, the road safety coordinator, NZTA and Police and focuses on
pragmatic solutions for improving safer roads and roadsides. The members of this group are also
represented on the Eastern Bay Road Safety Committee.
Road safety programme providers are those external stakeholders that deliver programmes related to
road safety that can be funded through the Eastern Bay road safety activity, for example, Ministry of
Justice, schools, iwi organisations, community education officers and Police. These are typically
independent programmes developed and implemented by external stakeholders.
Figure 6: Eastern Bay of Plenty model for road safety delivery
4.4 Implementing the delivery model
Eastern Bay Road Safety objectives aim to deliver a collaborative and integrated road safety activity. It does
this through three key strands of work:
1. Promotion and education programmes developed and implemented by the Road Safety
Coordinator for the Eastern Bay cluster
2. Road safety programmes developed and implemented through external providers with
funding support from the Eastern Bay cluster
13Eastern Bay of Plenty Road Safety Strategy 2015-18
3. Road safety work in the engineering area that focuses on road improvements to help reduce
the crash risk
First, to achieve Safer Journeys objectives, there is an ongoing need to provide road safety education
at the local level for people of all ages. Road user educational campaigns and programmes are a core
component of the approach to road safety. Education and promotional programmes aim to support
NZTA and Police national campaigns as well as targeting specific local issues. Road safety campaigns
developed and implemented through the Road Safety Coordinator for the cluster will inform road
users about priority local issues and encourage people to become ‘safe road users’ – a key component
of a safe system.
Second, building knowledge, capacity and ownership across the Eastern Bay in road safety is an
important focus. This second strand of work acknowledges that a lot of positive road safety initiatives
occur outside of the cluster councils. Funding support and coordination of these activities allows for a
wider and more effective road safety programme. In addition, often those ‘at risk’ groups for road
safety are often ‘at risk’ in terms of other social issues, such as alcohol and drug use and crime. It is
therefore important to make linkages with other Councils’ work programmes and across partner
agencies to enable the delivery of integrated road safety messages to target communities regarding
road safety along with other ‘at risk’ behaviours.
Third, improving the safety of Eastern Bay of Plenty roads and roadsides to reduce the likelihood of
crashes occurring and to minimise the consequences of those crashes that do occur is paramount. The
Eastern Bay has a small population base with challenging geography. Both these factors, along with the
high costs associated with road engineering, contribute to the difficulty of investing in safe roads. A
key challenge is finding ways to cost-effectively improve roads with high crash rates.
The three strands of work will be complementary, and opportunities to partner wider stakeholder
groups will be harnessed. The effectiveness of this structure may need to be reviewed before the three
year strategy is reviewed.
14Eastern Bay of Plenty Road Safety Strategy 2015-18
5 ROAD SAFETY ISSUES IN THE EASTERN BAY CLUSTER
The Eastern Bay is a high risk area for road crashes. This section summarises the extent of the road safety
issue.
5.1 Crash numbers and casualties
During the five year period 2009-13, there were 1520 crashes with 43 deaths, 146 serious injuries, 404
minor injuries and 927 non-injuries in the Eastern Bay of Plenty (refer Table 3).
Table 3: Crash list fatal and serious crashes 2009-2013: Eastern Bay of Plenty
Overall injury statistics Overall casualty statistics
Crash severity Number % Social cost ($m) Injury severity Number % all casualties
Fatal 43 3 193.64 Death 48 5
Serious 146 10 165.21 Serious 201 23
Minor 404 27 34.83 Minor 634 72
Non-injury 927 61 25.79
1520 100 419.47 883 100
Source: NZTA Crash Analysis Data (CAS) 2009-13
The number of crashes and the numbers of resulting casualties for each of the five years are illustrated in
Figures 7 and 8. Encouragingly, these figures show that the numbers of fatal, serious and minor crashes
have declined slightly and the numbers of non-injury crashes have declined steadily over the last five years.
This is consistent with the trend nationally.
Figure 7: Crash severity numbers from 2009-13 in the Eastern Bay
250
200
150 Fatal
Serious
100 Minor
Non-injury
50
0
2009 2010 2011 2012 2013
15Eastern Bay of Plenty Road Safety Strategy 2015-18
Figure 8: Casualty numbers from 2009-13 in the Eastern Bay
180
160
140
120
100 Fatal
80 Serious
60 Minor
40
20
0
2009 2010 2011 2012 2013
5.2 High social costs in the Eastern Bay
The estimated social cost of all crashes during 2009-13 was $419.47 million for the Eastern Bay (refer Table
3). This is an estimated social cost of loss of life or quality of life, loss of output due to injuries, medical and
rehabilitation costs, legal and court costs and property damage. Highest social costs were attributed to
rural roads ($304 million), alcohol and drug impairment ($152 million) and young drivers ($151 million). For
more detail, refer to the table in Appendix I.
5.3 Communities at risk
The Communities at Risk Register is produced annually and has been developed by NZTA to identify
communities that are over-represented in terms of road safety risk. The Register ranks communities by
local authority area based on the Safer Journeys areas of concern and is based on fatal and serious injury
crash data from the crash analysis system database over a rolling five year period.
The degree of risk of a fatal or serious injury for individual road users, for each area of concern outlined in
Safer Journeys, has been assessed by NZTA both locally and regionally. The statistics illustrate that the
three Eastern Bay districts have a similar high risk profile. Young drivers, alcohol and drugs, rural roads,
distractions and restraints are areas of concern where at least two of the three districts score in the high
individual risk category (refer to Tables 1 and 2 in Appendix 2).
A summary of the factors where one or more of Kawerau, Ōpōtiki or Whakatāne districts are represented
in either the high or medium risk categories is also provided in Appendix 2 (Tables 1 and 2). For the period
2008-12, Ōpōtiki District ranked as the community with the second highest risk factor for all crashes
compared with all 72 territorial authority districts. Kawerau District ranked fourth and Whakatāne District
was ranked 21.
16Eastern Bay of Plenty Road Safety Strategy 2015-18
5.4 A snapshot of age, gender and ethnicity of drivers at fault
Age groups
Figure 9 depicts the number of crashes in the Eastern Bay by age group. As is shown in the graph, the
younger generation is over-represented with 96 crashes recorded for drivers at fault between the ages of
15-19 years 3 and 125 crashes for drivers within the 20-29 year category.
Figure 9: Total number of crashes in the Eastern Bay (2009-13) across age groups
70+
60-69
50-59
40-49
30-39
20-29
15-19
0 20 40 60 80 100 120 140
Gender
Overall, males were at fault in more road crashes in the Eastern Bay compared with females over this five
year period (2009-13), with 66 percent of all drivers at fault being male. As shown in Figure 10, male drivers
were over-represented in all age groups. This is particularly concerning in the 15-19 and 20-29 age groups
with higher numbers of crashes. In addition, males were well over-represented in crashes involving alcohol
and drug impairment (80 percent were male) and speed related crashes (70 percent were male). Refer to
Appendix I.
Figure 10: Proportion of male and female drivers at fault across age groups for all fatal, serious and minor injury
road crashes in the Eastern Bay (2009-13)
70+
60-69
50-59
40-49 female%
male %
30-39
20-29
15-19
0% 5% 10% 15% 20%
3
Note this is the only age group with a five year instead of ten year age bracket
17Eastern Bay of Plenty Road Safety Strategy 2015-18
18Eastern Bay of Plenty Road Safety Strategy 2015-18
Ethnicity
Drivers at fault generally reflected the ethnic composition of the districts, with a relatively even split
between Māori and European.
5.5 Crash factors
Table 4 shows crash factors for all crashes in the cluster for the 2009-13 period. Poor handling and
observation are the two highest crash factors. While poor observation and poor handling feature as high
crash factors, it is likely they cover a wide range of driver errors. It is possible they are recorded in
combination with alcohol and speed crash factors that also feature near the top of the list and were the
most predominant factors when investigating the 2008-2012 period for fatal and serious crashes (Centre
for Road Safety Intelligence, 2013). Road factors also feature as a high crash factor. Further investigation
into these crashes will show if there are road improvements that could be made to help reduce the crash
rate.
Table 4: Crash factors in the cluster 2009-2013
Crash factors Number %
Poor handling 547 36
Poor observation 492 32
Too fast 299 20
Road factors 297 20
Alcohol 253 17
Poor judgement 217 14
Failed Give way/Stop 220 14
Incorrect lane/position 182 12
Other 185 12
Fatigue 129 8
Weather 115 8
Vehicle factors 82 5
Failed Keep Left 41 3
Overtaking 43 3
Disabled/old/ill 51 3
Pedestrian factors 26 2
Source: CAS Data 2009-13
In addition, Lost control / Head on (combined straight road and on bend crashes) is the most common crash
type and represents 54 percent of all cluster crashes. Crashes on the open road make up 57 percent of all
crashes across the Eastern Bay (CAS Data, 2009-13).
19Eastern Bay of Plenty Road Safety Strategy 2015-18
6 EASTERN BAY ROAD SAFETY RISK AREAS
Analysis of crash information has identified seven risk areas for the Eastern Bay cluster. These are a mixture
of high risk behaviours and high risk groups. They are:
1. Speed
2. Rural roads
3. Alcohol and drug Impairment
4. Young drivers
5. Restraints
6. Older road users
7. Distraction
6.1 Speed
Speed affects the likelihood and impact of all crashes. Small reductions in impact speeds greatly increase
the chances of surviving a crash. The Safe System goal is to reduce the number of speed-related crashes
and the severity of all crashes if they do occur, with three long term objectives:
• People will increasingly understand what travelling at safer speeds means
• Speed limits will better reflect the use, function and safety of the network
• Travel speeds will support both safety and economic productivity
As reported by the Centre for Road Safety Intelligence (2013), along with alcohol, speed is the one of the
most common single crash factors in fatal and serious injury crashes in the cluster, and these two factors
are leading to a loss of control causing crashes. Loss of control is a factor in more than 60 percent of all fatal
and serious injury crashes (2008-12) and 54 percent of all crashes in the cluster (2009-13).
These findings align with Table 4, listing speed (too fast) as the third most common factor for all crashes in
the cluster. Over the 2009-2013 period, speed was the primary factor in 299 crashes, including 13 fatal and
40 serious road crashes. Of these, the majority of crashes (82 percent) were single party crashes, and 80
percent occurred on a bend with poor handling (78 percent), alcohol (39 percent) and road factors (33
percent) being identified as attributing factors. 70 percent of speed related crashes had male ‘at fault’
drivers, and a further 54 percent were in the 15-24 year age group.
The high proportion of speed-related crashes illustrates the importance of drivers needing speed
management guidance on how to drive to the conditions on open roads.
6.2 Rural Roads
A rural road is defined by NZTA as a motorway, state highway, expressway, local road or private road with a
speed limit of 80km/h or more. As the cluster is predominately rural, this accounts for much of the roading
network in the Eastern Bay.
This is reflected in the statistics, with the total number of crashes from 2009-13 on rural roads in the cluster
totalling 862, including 33 fatal and 96 serious, with a social cost estimated at $304 million. Of these, 51
percent were on bends, 68 percent had male drivers at fault and most were spread reasonably evenly over
driver age groups. Poor handling was the common crash factor in 44 percent of crashes.
20Eastern Bay of Plenty Road Safety Strategy 2015-18
6.3 Alcohol and drug impairment
The effect of alcohol on driving has been comprehensively researched, and there is extensive evidence to
show that driving starts to be impaired with very low alcohol levels.
While the number of alcohol/drug-related fatal and serious injury crashes, especially for youth, has
declined nationally, the problem remains a significant one. Any level of alcohol increases driving errors and
affects alertness, skill, and judgements. Alcohol use also correlates with failure to wear restraints, which
remains a relatively common factor in fatal crashes, particularly in the Eastern Bay.
Although alcohol availability is not proportionally high compared with the rest of the nation, the adverse
impacts of drinking behavior and/or culture in the cluster are significant. These are also not evenly
distributed throughout the population. The Local Alcohol Policy Research Report (2013) provides insight into
the drinking behaviours in the Eastern Bay. Findings from this report included that:
• Research has shown that people living in areas of high socio-economic deprivation, Māori and
Pasifika peoples are disproportionately affected by alcohol-related harm. A 2012 Eastern BOP
Primary Health Alliance (2012) report highlighted that although Māori adults were found to be less
likely than non-Māori adults to have consumed alcohol on a daily basis, those who did drink were
more than twice as likely to have consumed large amounts. This pattern of consumption, known as
‘binge drinking’ has been found to be particularly harmful, with road traffic accidents.
• The health impacts of alcohol use in the Eastern Bay are high. The rates for alcohol-related deaths
and hospital discharges nearly all exceed national figures, as does the number of alcohol-related
injury hospital discharges for each of the three districts.
• Alcohol contributes significantly to a wide range of traffic and crime offences in the Eastern Bay of
Plenty. The rate of offences for dwelling assaults, public place assaults, alcohol offences by licensed
premises and drunks taken to detox across all three councils occur at a higher rate than national
figures. In addition, the percentage of arrests where the level of intoxication was moderate or
extreme was higher than the national average in Whakatāne and Ōpōtiki. Whakatāne District has
over twice as many drunks taken to detox per 10,000 people compared with neighbouring Ōpōtiki
and Kawerau districts and compared with national figures.
• In all three districts, 50 percent or more of those arrested where alcohol was consumed prior had
their last drink at a private residence, compared to 45 percent nationally.
As reported by the Centre for Road Safety Intelligence (2013), alcohol along with speed is the most
common single crash factor in fatal and serious injury crashes in the cluster (2008-2012), and these two
factors are leading to a loss of control, causing crashes. Loss of control was a factor in more than 60 percent
of all fatal and serious injury crashes.
Over the 2009-2013 period, alcohol was the primary crash factor in 249 crashes, including 21 fatal and 42
serious road crashes. The majority of crashes (73 percent) were single party crashes, and 51 percent
occurred on a bend. Eighty percent of alcohol/drug related crashes had male drivers at fault. In addition,
younger drivers were also over-represented, with 44 percent in the 15-24 year age group. The age group
with the second highest proportion (24 percent) of alcohol related crashes were those aged between 30-39
years (refer Appendix I).
The Centre for Road Safety Intelligence (2013) reported that 74 percent of all cluster fatal and serious injury
crashes involved residents of the clusters, and that these crashes occurred closer to their home area than
21Eastern Bay of Plenty Road Safety Strategy 2015-18
outside of their home area. The report identifies the possibility that drivers are becoming intoxicated at
their own homes or the homes of friends, then driving afterwards. Some crash reports have stated that
prior to a crash drivers were drinking with friends, and in one case that some had been drinking for a
considerable amount of time, then drove to get more alcohol. This supports the finding from the LAP report
discussed above, with high proportions of alcohol offenders having their last drink at a private residence.
The cluster has considerable on-going issues with drink drivers reoffending, with a steady rate of around 27
percent over the last few years. Recidivist drink drivers are associated with significant and avoidable health
costs.
Impairment related to drug use (legal and illegal) when driving is not as closely monitored or enforced
compared with alcohol use. Improving information around driving and drug impairment and a move
towards an approach to random roadside drug screening and testing would be useful.
6.4 Distraction
Driving safely means giving driving your full attention. Driver distraction is a serious road safety issue and
includes a range of activities where the driver's attention is directed away from the primary task of driving
towards events, objects or people, inside or outside of the vehicle. Distraction includes a range of activities
where drivers’ attention is directed away from safe driving, such as talking with passengers, using cell
phones, eating and drinking, reaching or searching for objects in the vehicle, adjusting vehicle controls,
adjusting the radio/in-vehicle entertainment system and changing CDs/cassettes, being emotionally
upset/angry, smoking, and looking at other activity/events outside of the vehicle.
For this cluster, a total of 159 crashes were attributed to distracted drivers in the 2009-2013 period,
including 8 fatal and 15 serious crashes. Of these, 31 percent occurred on a bend, 26 percent on a straight
road and 23 percent involved the car rear-ending another or hitting an obstacle. 73 percent occurred in
daylight hours, 55 percent involved a single party, and most were spread reasonably evenly over the age
groups (refer Appendix I).
6.5 Young drivers
Increasing the safety of young drivers aged 15-24 years is a high strategic priority identified in Safer
Journeys. At a national level, the First Actions have improved the safety of young drivers, and the licensing
changes mean that young drivers enter the system slightly older and with higher skill levels when they start
driving on a restricted licence. Other actions already taken to address alcohol-impaired driving include
lowering the blood alcohol concentration (BAC) limits to zero for drivers under the age of 20 years.
Given these changes, young drivers are still significantly over-represented in fatal and serious injury crashes
where the driver was at part or prime fault. Young drivers have a lower level of road safety due to factors
such as age, maturity and inexperience. Working with community leaders to engage with young drivers and
facilitating education and training is likely to reduce their involvement in fatal and serious injury crashes
(Centre for Road Safety Intelligence, 2013).
During the five year period 2009-13, 213 crashes were attributed to young drivers, including 16 fatal and 59
serious crashes (35 percent of the total number of crashes). Of these, nearly half (49 percent) of young
drivers held either a learner or restricted licence, and a further 17 percent had never held a licence. Poor
handling (46 percent), too fast (35 percent) and alcohol (29 percent) were the three most common crash
factors.
22Eastern Bay of Plenty Road Safety Strategy 2015-18
The Centre for Road Safety Intelligence (2013) identified alcohol as being particularly evident in crashes
involving young drivers in the cluster. While they stated that fatal and serious injury crashes linked to
alcohol were dropping, the young drivers were frequently very intoxicated with very high blood-alcohol
results.
In addition, the Centre for Road Safety Intelligence (2013) reported that nearly 50 percent of the drivers of
motorcycles at fault in fatal and serious crashes were aged 15-24, and only one motorcycle had a current
Warrant of Fitness. The report suggests that it is possible that the physical condition of unwarranted
motorcycles is contributing to their involvement in at-fault fatal and serious injury crashes in the cluster.
This may also reflect the high proportion of motorcycles used for farming purposes by young people in the
cluster.
6.6 Restraints
In the Eastern Bay, for the 48 fatal crashes in the last five years (2009-13), 43.8 percent involved crashes
where restraints were not being worn (refer to Appendix I). As discussed above, this is often linked to
alcohol impairment.
As reported by the Centre for Road Safety Intelligence (2013), for the fatal and serious crashes where
restraint data was available, restraints were not used in 28 percent of crashes. Restraint use for rear seat
occupants is considerably lower in the cluster (78 percent) than nationally (90 percent), whereas front seat
use is similar to the national rate (around 90 percent).
Every child under seven years of age must be properly restrained by an approved child restraint when
travelling in cars, vans and trucks. Children aged seven years must use an appropriate child restraint if one
is available, or else use an adult safety belt. Older children (aged eight and over) must use a safety belt if
available, and if no restraint is available they must travel in the rear seat. It is the driver's responsibility to
make sure all child passengers are correctly restrained (Ministry of Transport).
In February 2014, child restraint checkpoints were carried out in Ōpōtiki and Kawerau Districts 4. In
Kawerau, 62 checks were made, with 79 percent of those being incorrectly restrained, including five
children with no restraints. Similarly, 43 checks were made in Ōpōtiki District, with 63 percent incorrectly
restrained, including one child with no restraint.
CAS data shows that the Eastern Bay of Plenty has double the national rate for fatal and serious injuries in
crashes where a restraint was not worn.
Research into the reasons why and development of programmes to encourage appropriate restraint use is
needed to reduce fatal and serious injury crashes involving no restraint use or the inappropriate use of
restraints.
6.7 Older road users
Older drivers (70+ years) are the fastest-growing segment of the New Zealand population, and this trend is
also reflected in the Eastern Bay cluster. Not only will there be more drivers, but these drivers will also
drive more kilometres per year than previous generations and will drive at older ages. A number of factors
make older drivers more vulnerable. Factors include:
4
Data supplied by Eastern Bay Plunket.
23Eastern Bay of Plenty Road Safety Strategy 2015-18
• People tend to get physically frailer with age, meaning older drivers are more likely to be
injured or die following a crash than younger people
• Health problems including diminishing vision, physical and/or cognitive abilities can make
driving more difficult and risky
• Older drivers are unlikely to have had any driver education for many years, meaning there may
be gaps in general knowledge about the road code and new road rules
From 2009-13, a total of 55 road crashes were attributed to older road users, including three fatal and nine
serious road crashes. Poor observation (55 percent) and failed to give way or stop (38 percent) were the
most common crash factors. Many (85 percent) of these crashes occurred in the day, involved multiple
parties (60 percent) and happened mid-week (75 percent).
6.8 Other contributing factors
Offending
Centre For Road Safety Intelligence (2013) identified previous traffic offenders as an ‘at risk’ group. They
reported that there were 169 drivers at fault in a fatal or serious injury crash with a driver’s licence
recorded. Of these drivers, approximately 39 percent were detected committing at least one traffic offence
in the 18 months preceding the sample crash period. This compares to approximately 21 percent of the
current national licensed population committing at least one traffic offence in the last 18 months.
Aged vehicle fleet
Centre for Road Safety Intelligence (2013) reported that the cluster fleet is older on average than the rest
of the country and less likely to have a current WoF. Older and unwarranted cars were over-represented in
fatal and serious injury crashes. The report suggests that a community project to assist with maintenance
and Warrant of Fitness compliance would likely reduce the occurrence and/or severity of crashes.
ACC data
A number of crashes are not recorded in CAS. This is evident based on the higher number of ACC claims in
this cluster than are matched with CAS records. It is likely investigation into non-CAS matched ACC claims
would provide further information to support existing road safety initiatives and/or identify new
opportunities (Centre for Road Safety Intelligence, 2013).
Local issues
Local issues that are community specific also influence road safety in the Eastern Bay. Stock on roads is an
example of this.
24Eastern Bay of Plenty Road Safety Strategy 2015-18
7 IMPLEMENTATION OVERVIEW
Actions to address the seven key priority areas are summarised in Table 5 below. As shown in the table,
many of the actions are applicable across all seven key priority areas. The information in this report will
help to inform the development of the Activity List for Road Safety promotion through NZTA funding based
on the actions summarised in Table 5.
Table 5: Summary of Road Safety Actions for the Eastern Bay cluster
alcohol & drug
young drivers
older drivers
impairment
rural roads
distraction
restraints
speed
other
Design and deliver sub-regional road safety messages through √ √ √ √ √ √ √
mixed media that build on and are timed with key national,
regional and local safety awareness and enforcement
campaigns.
Build public understanding so that people will increasingly √ √ √ √ √ √ √
understand what travelling safely means.
Increase public awareness of the consequences of ‘at risk’ √ √ √ √ √ √ √
driving behaviours through educational and promotional
campaigns.
Support the delivery of programmes throughout the Eastern Bay √ √ √ √ √ √ √
targeting ‘at risk’ groups with road safety messages.
Link with other Councils’ projects and programmes that promote √ √ √ √
key road safety messages.
Work together with other agencies to develop approaches to √ √ √ √ √ √
improve road safety.
Advocate for national policies and programmes aimed at √ √ √ √ √ √
increasing road safety.
Encourage licensed premises to promote road safety messages √
and include mechanisms to address road safety within host
responsibility policies.
Keep Police informed of councils’ policies and any special events √
that may have implications for enforcing drink and drug driving.
Investigate the lack of appropriate restraints in the Eastern Bay √
of Plenty and develop an appropriate response.
Promote and support opportunities to work closely with local iwi √ √ √ √ √ √ √ V
to promote road safety.
Support community projects that assist with maintenance and √
WoF compliance to improve the quality of the vehicle fleet.
Enforce compliance. √ √ √ √ √
25Eastern Bay of Plenty Road Safety Strategy 2015-18
Link with the Road Safety Operations Group to develop safe √ √ √ √ √ √ √ √
roads and roadsides.
In addition, if funding is available, specific programmes and projects may be developed to address specific
‘at risk’ groups or behaviours. For example:
• Young drivers are a group that would benefit greatly from an integrated road safety programme
that focuses on speed, alcohol/drug impairment, distraction and restraint use.
• Re-offending drivers, particular recidivist drivers, are another group that could be targeted for a
specific project aiming to change driving behaviours.
• Investigate, development and implement or support appropriate projects for encouraging restraint
use in the Eastern Bay.
• Uncontrolled stock on roads in rural areas.
Often those ‘at risk’ groups for road safety are often ‘at risk’ in terms of other social issues, such as alcohol
and drug use, crime, and unpreparedness to contribute to society productively. It is therefore important to
make linkages with other Councils’ work programmes, particularly in community development, and across
partner agencies to enable the delivery of integrated road safety messages to target communities regarding
road safety along with other ‘at risk’ behaviours. Work programmes relating to alcohol licensing and stock
on roads are areas where an educational road safety component could easily be incorporated.
7.1 Eastern Bay of Plenty Signature project
Signature projects have been introduced by NZTA to make demonstrable advances in reducing road trauma
for all road users by implementing the Safe System approach within regions and communities. NZTA plans
for signature projects to be well-resourced initiatives that demonstrate innovation and give effect to Safe
System principles. The purpose is “to showcase best or emerging practice, develop understanding and
demand for improved road safety from a wider audience, and reduce road trauma, project design will
include evaluation and communication work streams”.
The rural road safety signature project currently based in Eastern Bay of Plenty is now in investigation and
design phase. The working group agreed that the focus for this project will be on the following themes:
disengagement from the system (licensure, compliance etc.), restraints, impairment, speed, and road and
roadsides. The working group has formed different work streams to focus on the issues. A business case
will be developed for the 2014/15 financial year.
26Eastern Bay of Plenty Road Safety Strategy 2015-18
8 FUNDING SOURCES
Funding may be sourced through a number of different channels. These are summarised below.
8.1 New Zealand Transport Agency
Transportation Programme
New Zealand Transport Agency co-invests in council’s transportation programme for a three year period.
Development of programmes is guided by the GPS, and safety is one of the key purposes of the LTMA. The
transportation programme includes the maintenance, operation and renewal of the network.
Improvements to the network are also part of the programme. Transport planning activities and road safety
promotion are funded from separate activity classes within a transportation programme.
The road safety promotion programme, which forms part of council’s overall transportation activity, is a co-
investment between the local authorities and New Zealand Transport Agency. Funding is provided from the
National Land Transport Fund.
Road Safety Promotion
Territorial authorities are required to make road safety funding applications to the NZTA and are
responsible for prioritising road safety activities and developing a road safety promotion activity list.
Currently, NZTA funding is allocated based on identified priority areas at the time of application (this does
not include new and emerging issues). In the Eastern Bay this happens at a sub-regional level, with
collaboration between Ōpōtiki, Kawerau and Whakatāne District Councils.
A completed road safety promotion activity list is submitted to the NZTA for funding for Eastern Bay
activities over a three year period. This includes the two key streams of work – education/promotional
activities coordinated through the Road Safety Coordinator, and funding support to external programme
providers. The current funding programme covers 2012-15, and the Eastern Bay has been funded 64
percent of a $404,500 programme over three years.
8.2 Police activities
National road policing activity is directed by the Road Policing Strategy and delivered through the National
Road Policing Programme. Funding is negotiated nationally with the NZTA and allocated through the NLTF
in accordance with the Road Policing Performance Agreement. Regional funding is allocated to deliver
programmes in line with strategies set down in the National Road Policing programme and regional and
district level directives.
8.3 ACC
ACC has a new process for working with injury prevention efforts. ACC is currently reviewing its road safety
strategies, which will then have streams of work running from them.
27Eastern Bay of Plenty Road Safety Strategy 2015-18
9 LINKING WITH OTHERS
As discussed earlier, many positive road safety initiatives occur outside of the cluster councils. Funding
support and coordination of these activities allows for a wider and more effective road safety programme.
For example, strong links need to be made and maintained with schools, Plunket and iwi organisations.
Stronger links with stakeholders who are able to distribute road safety messages, such as licensed
premises, would also be beneficial. Making these links will help to build knowledge, capacity and ownership
of road safety in the Eastern Bay.
10 MONITORING
Monitoring will be used to measure the progress of this strategy and actions to consider emerging issues
and to assist in the development of further actions. Consideration will be also given to how we can
supplement the crash data used for analysis.
In addition to monitoring the results, the sector’s ability to deliver the strategy needs to be monitored.
A review of the Eastern Bay of Plenty Road Safety Strategy will be conducted in three years to take into
account NZTA funding rounds and any changes in national, regional and/or sub-regional priorities.
28You can also read