ED Real Time Dashboard - Training Manual - Health PEI | Staff Resource Centre
←
→
Page content transcription
If your browser does not render page correctly, please read the page content below
ED Real Time
 Dashboard

Training Manual
ED Real Time Dashboard
Overview of ED Dashboard
ED Dashboard displays real-time data for the emergency department (ED). The
dashboard pushes information to managers and other users to support bed or clinic
management, staffing, and other decisions that ultimately drive throughput and patient
satisfaction. Information is displayed in a component-based layout on a single display.
You can select each component to view to specific patient-level information.
User Preferences
The below user preferences can be set for ED Dashboard by clicking the User-Level
Preferences menu in the upper-right corner. The dashboard remembers the user-level
settings each time you open the dashboard.
Auto Refresh: The preference is automatically set to refresh every 60 seconds.
You can turn this off by deselecting the option in the User-Level Preferences
menu.
Save as Default Location: This preference allows you to set the selected
tracking group as a default location. To change the default location, deselect this
option, then select a new tracking group and select Save as Default Location.
Viewing the Acuity and Critical Care Component
The Acuity component displays the acuity and number of patients assigned to each
acuity level in a bar graph format. The acuity levels come from the tracking configuration
and are displayed in the component with corresponding colors and names for each
acuity level. If no patients are assigned a specific acuity, a patient count of 0 is
displayed above that acuity level. The Critical Care Component is future functionality
Viewing Details
To view additional details, click the arrow button in the upper-right corner of the Acuity
and Critical Care component to open the Acuity and Critical Care details dialog box.
Similar to the larger dashboard view, you can view data at the department level, or per
zone (if the system is configured to do so).
Version: Feb 2021 ED Real Time Dashboard Manual 2
For each patient, the following details can be displayed in the Acuity and Critical Care details dialog box: Room number Length of stay (LOS) Inpatient room assigned (Comment column) Patient information (such as name, age, and sex) Acuity level Reason for visit Assigned physician Assigned nurse Critical care category-future Viewing the Turnaround Times Component The Turnaround Times component displays up to five tracking event metrics and the corresponding median wait times for qualified patients in the department or zone. This component tracks milestone metrics throughout a patient's visit, such as door to triage, triage to bed assignment, door to Dr. exam, Dr. exam to disposition decision, and disposition decision to checkout (current time). If the second (ending) tracking event is not configured, the system calculates the metric based on the first (starting) tracking event to the current time. The number of patients below the high threshold is displayed in a blue box below each metric. The number of patients above the high threshold, but below the critical threshold is displayed in an orange box, and the number of patients above the critical threshold is displayed in a red box. The following information is displayed: Version: Feb 2021 ED Real Time Dashboard Manual 3
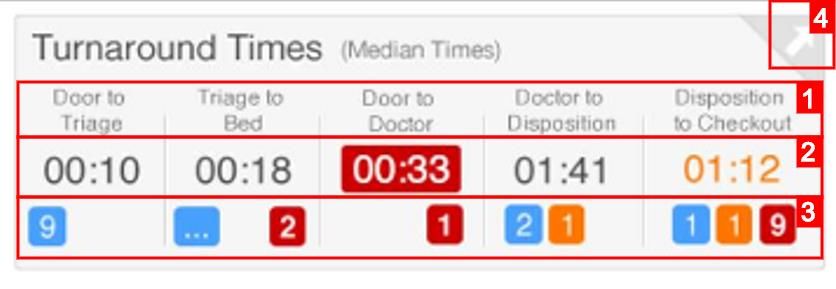
1. Turnaround Time Metrics: Up to five turnaround times are displayed, which are
defined by tracking event configuration.
2. Median Turnaround Time per Metric: The median turnaround time is displayed
in hours and minutes. This time is calculated by looking at patients who are
actively waiting for their second event to occur (for example, patients who are
waiting to be triaged, assigned a bed, or seen by a provider).
3. Patient Counts: The colored boxes display patient counts based on the high and
critical threshold configuration for each metric.
o Blue Box: This box displays the number of patients who are below the
high threshold for this metric.
o Orange Box: This box displays the number of patients who are above the
high threshold, but below the critical threshold for this metric.
o Red Box: This box displays the number of patients who are above the
critical threshold for this metric.
4. Details: Click the arrow button in the upper-right corner to open the Turnaround
Times details dialog box.
Viewing Details
To view additional details, click the arrow button in the upper-right corner of the
Turnaround Times component to open the Turnaround Times details dialog box. Similar
to the larger dashboard view, you can view data at the department level, or per zone (if
the system is configured to do so). Overdue and critically overdue time thresholds are
displayed at the bottom of the details dialog box for each turnaround time metric.
For each patient, the following details can be displayed in the Turnaround Times details
dialog box:
Room number
Waiting time
Patient information (such as name, age, and sex)
Acuity level
Reason for visit
Assigned physician
Assigned nurse
Length of Stay (LOS)
Version: Feb 2021 ED Real Time Dashboard Manual 4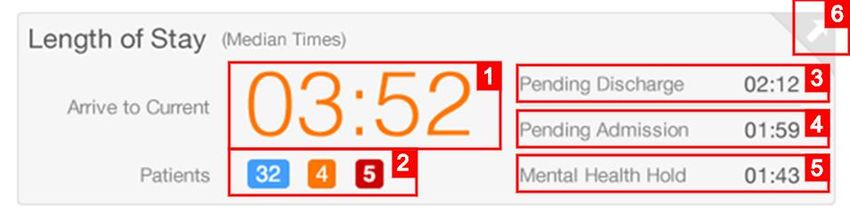
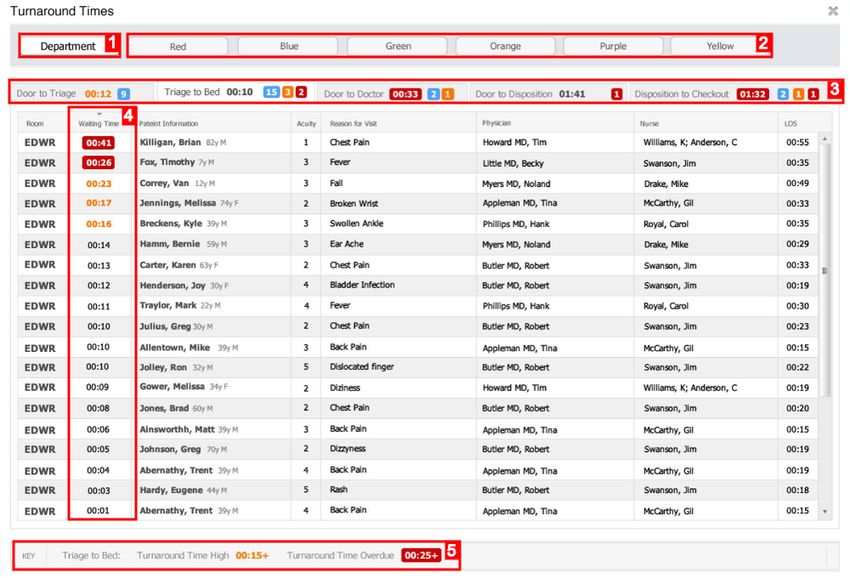
The Turnaround Times details dialog box is sorted by waiting time in descending order.

The following information is displayed:

   1. Department: Click Department to view details for the entire department.
   2. Zones: Click a zone to view details for that specific area.
   3. Turnaround Time Metrics: Click a tab to view details for those specific
      turnaround time metrics. The median turnaround time for each metric is
      displayed to the right of the metric name. The number of patients who qualify for
      that metric are displayed.

      Note

      The numbered boxes on each turnaround time tab indicate the number of
      patients who have been waiting less than the high threshold (blue box), above
      the high threshold but below the critical threshold (orange box), and above the
      critical threshold (red box).

   4. Waiting Time: This column displays the amount of time in hours and minutes
      that the patient has been waiting for the specific turnaround time metric. Once
      the second event is completed, the patient no longer qualifies for the turnaround
      time metric.

Version: Feb 2021            ED Real Time Dashboard Manual                                5
o When the critically overdue threshold is met for patients who are waiting
            for the turnaround time metric, the wait time is displayed in red.
          o When the overdue threshold is met for patients who are waiting for the
            turnaround time metric, the wait time is displayed in orange.
   5. Key: The key displays the settings for the overdue and critically overdue
      thresholds.

Viewing the Length of Stay Component

The data displayed in the Length of Stay (LOS) component flexes based on the time
and zone settings indicated in the ED Dashboard heading. Prearrivals are excluded
from this data. If configured, patients with an active pending admit, pending intake, or
pending discharge event can be excluded from the overall median LOS calculation.

In emergency department (ED) workflows, these patients are represented with a median
LOS from the start of the disposition in the Pending Admission and Pending Discharge
sections. An additional category is available for configuration to track another set of
patients, such as psychiatric holds or pending transfer. These patients are by default
included in the department median LOS time. If configured, they can be excluded from
the department median LOS calculation.

The following information is displayed:

   1. Median Length of Stay: The median LOS is displayed in hours and minutes
      (00:00). By default, this calculation looks at all patients in the selected location
      view (department or zone level) and calculates the LOS based on the time the
      patient arrived to the current time.
         o The calculation can be configured to exclude a mix of patients based on
             the following options: Patients who have discharge tracking events,
             patients who have admit or intake tracking events, or patients who have
             additional tracking events configured.
         o The calculation can be configured to use the start time of a tracking event
             such as Bed or Room Assign to begin the LOS calculation.
         o Overdue and critically overdue parameters can be set for LOS values.
             When the metric meets the overdue value, the number is displayed in
             orange. When the critically overdue parameter is met, the number is
             displayed in red. For example, if the overdue parameter is set at 03:01

Version: Feb 2021            ED Real Time Dashboard Manual                                   6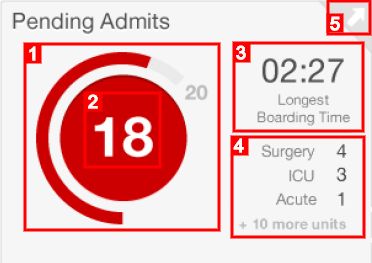
hours and the critically overdue parameter is at 04:00 hours, then a
median LOS of 03:52 hours is displayed in orange.
2. Patient Counts: The colored boxes display patient counts based on the high and
critical threshold configuration for each metric.
o Blue Box: This box displays the number of patients who are below the
high threshold for this metric.
o Orange Box: This box displays the number of patients who are above the
high threshold, but below the critical threshold for this metric.
o Red Box: This box displays the number of patients who are above the
critical threshold for this metric.
3. Pending Discharge: This metric displays the median time in status for all
patients with an active discharge event as defined in configuration.
4. Pending Admission: This metric displays the median time in status for all
patients with an active admission event as defined in configuration.
5. Additional Tracking Event: This metric displays the median time in status for
patients with an active tracking event as defined in configuration.
6. Details: Click the arrow button in the upper-right corner to open the Length of
Stay details dialog box.
Note
You can configure the target time and critical time at the location view (zone) level. This
means you can display and calculate the LOS data against different thresholds for each
zone of the ED.
Viewing Details
To open the Length of Stay details dialog box, click the arrow button in the upper-right
corner of the Length of Stay component. Similar to the larger dashboard view, you can
view data at the department level or per zone (if the system is configured to do so).
The Target, Overdue, and Critically Overdue time thresholds are displayed at the
bottom of the details dialog box. For each patient, the following details are displayed in
the Length of Stay details dialog box if they are available:
Room number
LOS
Patient information (such as name, age, and sex)
Acuity
Reason for visit
Medical record number (MRN)
Assigned physician
Assigned nurse
Disposition
Version: Feb 2021 ED Real Time Dashboard Manual 7The Length of Stay details dialog box displays the following elements:
1. Department: Click Department to view details for the entire department. The
Department box displays the median LOS for the department and is displayed as
high (orange) or critical (red) if those thresholds are met.
2. Zones: Click a zone to view details for that specific area. Zones are displayed
based on your tracking location views. The zone buttons display the median LOS
and use the high (orange) and critical (red) color if that median time reaches
those designated thresholds.
3. Length of Stay: The zone buttons also display the following icons for LOS:
o All patients below the high threshold are displayed in a blue box.
o All patients who meet the overdue threshold are displayed in an orange
box.
o All patients who meet the critically overdue threshold are displayed in a
red box.
4. Column Sorting: Patient details are displayed by default in order of LOS, with
the longest, most critical LOS at the top. Click the column headings to resort the
patients.
5. LOS Column: The LOS column displays the patient’s LOS and uses the color
conventions of red (critical), orange (high), and gray (at or under target).
6. Providers: The content for the Physician and Nurse columns is pulled from the
providers assigned to the patient in Emergency Medicine tracking.
o Multiple provider roles can be included for each provider column.
o Up to two provider names can be displayed for each selected provider
role.
Version: Feb 2021 ED Real Time Dashboard Manual 87. Key: The key displays the settings for the Target, Overdue, and Critically
Overdue thresholds.
Viewing the Notices Component
The Notices component displays departmental communications that are entered
through the Notices details dialog box. The Notices component displays the entered text
and recognizes basic font and style formatting. The details dialog box displays the name
of the user who last made an update and the time the last update was published.
Click Edit to modify the existing message or delete it and add a completely new
message. Previous messages are not saved.
The Notices component includes the following elements:
1. Departmental Communication Display Area: This area displays the formatted
text you entered in the details dialog box of the component.
2. Details: Click the arrow button in the upper-right corner to open the Notices
details dialog box.
Viewing Details
This component is the same across all zone and departmental views of ED Dashboard .
When the Notices details dialog box is open, you can edit the text that is displayed in
the Notices component.
Version: Feb 2021 ED Real Time Dashboard Manual 9The Notices details dialog box includes the following elements:
1. Last Updated Date and Time: The system displays the last updated date and
time for the current text that is displayed in the component.
2. Last Updated by User: The system displays the user who last made a change
to the text that is displayed in the component.
3. Edit Button: Click Edit to edit the text that is displayed in the component.
4. Current Message: The system displays a preview of the current text that is
displayed in the component.
Viewing the ED Volume Component
Note
The following sections are specific to emergency department (ED) workflows: Pending
Admits, Psychiatric Hold, EMS, and Referrals.
The data displayed in the ED Volume component flexes based on the time and zone
settings indicated in the ED Dashboard heading. The component displays information
for a designated period of time as defined by the facility. The data in the component
excludes patients in the waiting room. If the prearrival location is included in the location
view, then those patients are included in the total number.
Version: Feb 2021 ED Real Time Dashboard Manual 10The ED Volume component includes the following elements:
1. Total ED Volume Dial: This dial displays the total number of beds in the
department or zone. By default, this is based on the number of rooms in the
selected location view (department or zone). If configured at the location view
level, the system can display a specific value for the upper limit. This number is
used for the high and critical calculations that turn the dial orange and red.
2. Occupied ED Volume Circle: This circle displays the total number of patients in
the department or zone, excluding patients in a waiting room location.
o Overdue and critically overdue parameters can be set for ED Volume
values.
o When the metric meets the overdue value, the dial is displayed in orange
(for example, 65 percent ED bed use). The dial and circle are displayed in
red when a critically overdue parameter is met (for example, 80 percent
ED bed use). This is calculated by dividing the number of patients
(occupied ED volume) by the total number of beds (total ED volume).
3. Details Sections: The following sections are displayed:
o Pending Discharge: This section displays the number of patients with an
active discharge event.
Multiple events can be selected.
The component prioritizes the earliest requested discharge event.
o Pending Admit: This section displays the number of patients with an
active Inpatient event.
Multiple events can be selected.
The component prioritizes the earliest requested inpatient event.
o Available: This section displays the number of available beds in the
selected department or zone based on the Available bed status.
o Referrals: This section displays the number of pending referral arrivals.
You must be using prearrival functionality.
The component prioritizes prearrivals with a type of Referral.
Version: Feb 2021 ED Real Time Dashboard Manual 11Viewing the Waiting Room Component
The Waiting Room component displays all patients in the waiting room location as
defined by the department or zone configuration.
The Waiting Room component includes the following elements:
1. Total Waiting Room Dial: The dial displays the maximum number of patients
that can be held in the waiting room location.
2. Occupied Waiting Room Circle: The circle displays the total number of patients
in the waiting room location.
o Overdue and critically overdue parameters can be set for waiting room
values.
o When the metric meets the overdue value, the dial is displayed in orange
(for example, 30 percent of the waiting room is occupied). The dial and
circle are displayed in red when a critically overdue parameter is met (for
example, 60 percent of the waiting room is occupied). This is calculated by
dividing the number of patients in the waiting room by the total number of
patients who can be held in the waiting room.
3. Median Wait: The system displays the median wait time in hours and minutes
(00:00) for all waiting room patients.
o Overdue and critically overdue parameters can be set for the waiting room
values.
o When the metric meets the overdue value, the dial is displayed in orange.
The dial and circle are displayed in red when a critically overdue
parameter is met.
Version: Feb 2021 ED Real Time Dashboard Manual 124. Longest Wait Time: The system displays the longest wait time in hours and
minutes (00:00) of all patients in the waiting room location.
5. Details: Click the arrow button in the upper-right corner to open the Waiting
Room details dialog box.
Note
Depending on configuration, Max Count and Wait Time thresholds can be set at the
location view (zone) level. This means if you have different waiting rooms in different
zones you can track these independently with different thresholds.
Viewing Details
To open the Waiting Room details dialog box, click the arrow button in the upper-right
corner. Similar to the larger dashboard view, you can view data at the department level
or per zone (if the system is configured to do so). Target, Overdue, and Critically
Overdue time thresholds are displayed at the bottom of the Waiting Room details dialog
box.
For each patient, the following details are displayed in the Waiting Room details dialog
box if they are available:
Room number
Wait time
Patient information (such as name, age, and sex)
Acuity
Reason for visit
Medical record number (MRN)
Comments
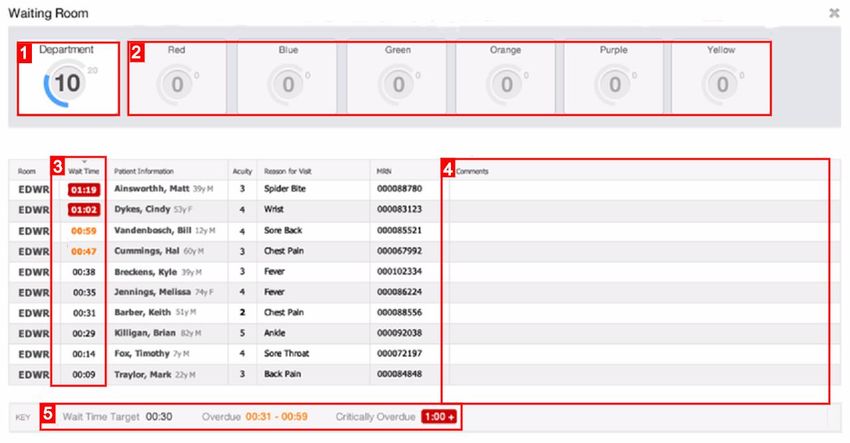
Version: Feb 2021 ED Real Time Dashboard Manual 13The Waiting Room details dialog box includes the following elements:
1. Department: Click Department to view details for the entire department. The
Department button displays the median length of stay for the department and can
be displayed as high (orange) or critical (red) if those thresholds are met.
2. Zones: Click a zone to view details for that specific area. Zones are displayed
based on your tracking location views. The zone buttons display the median
length of stay (LOS) and use the high (orange) and critical (red) color if that
median time reaches those designated thresholds.
3. Wait Time: This column displays the amount of time in hours and minutes
(00:00) since the patient arrived in the waiting room location.
o When the Critically Overdue threshold is met for patients in the waiting
room location for total wait time, the wait time is displayed in red.
o When the Overdue threshold is met for patients in the waiting room
location for total wait time, the wait time is displayed in orange.
4. Comments: If configured, the system displays the Comments column. If the
configuration is not set, the referring comment is displayed.
5. Key: The key displays the settings for the Target, Overdue, and Critically
Overdue thresholds for the waiting room wait time.
Version: Feb 2021 ED Real Time Dashboard Manual 14Viewing the Pending Admits Component
The data displayed in the Pending Admits component flexes based on the time and
zone settings indicated in the ED Dashboard heading. The component is displayed for a
designated period of time as defined by the facility. The component includes any
patients with a pending admit event as defined by the configuration.
The Pending Admits component includes the following elements:
1. Pending Admit Volume Dial: The dial displays the total number of beds in the
department or zone. By default, this is based on the number of rooms in the
selected location view (department or zone).
2. Pending Admit Circle: The circle displays the total number of patients with a
pending admit event.
o Overdue and critically overdue parameters can be set for pending admit
values.
o When the metric meets the overdue value, the dial is displayed in orange
(for example, 10 percent of ED beds contain a patient waiting to be
admitted). The dial and circle are displayed in red when a critically
overdue parameter is met (for example, 15 percent of ED beds contain a
patient waiting to be admitted). This is calculated by dividing the number
of patients who are pending admission by the total number of ED beds in
the department or zone.
3. Longest Boarding Time: The system displays the longest boarding time in
hours and minutes (00:00) of all patients with a pending admit event in a
Requested or Started status.
o Overdue and critically overdue parameters can be set for pending admit
values.
o When the metric meets the overdue value, the number is displayed in
orange. The number is displayed in red when a critically overdue
parameter is met.
Version: Feb 2021 ED Real Time Dashboard Manual 15Viewing the Pending Events Component-Future
Viewing the Patients with Pending Orders Component
The data displayed in the Patients with Pending Orders component flexes based on the
time settings and zone settings indicated in the ED Dashboard heading. The component
includes any patients with the following pending orders: ECG, X-ray, and CT scan,
ultrasound, medication, blood, or urine orders as defined by configuration. Patients with
a pending order are displayed in the column based on the status of the order.
Depending on workflow, the emergency department (ED) may exclude patients who
have an active pending admission event from this component.
Note
Pending admission events only apply to ED workflows.
The Patients With Pending Orders component includes the following elements:
1. Section Column: This column defines the specific section an order has been
placed in.
2. Patients Column: This column displays the total count of patients with a pending
order that qualifies for a specific section.
Version: Feb 2021 ED Real Time Dashboard Manual 163. Pending Complete Column: This column displays the patient counts for ECG,
X-ray, CT scan, or sonogram orders and the patients are waiting for the image or
exam to be completed.
o For X-rays, CT scans, and sonograms, this is the departmental order
status of Exam Completed.
o For an ECG using ECG Management , this is the departmental order
status of CVCompleted.
o If a tracking event is configured for ECG instead, this column indicates
that the system is waiting for the ECG tracking event to be completed.
4. Pending Preliminary Column: This column displays the patient counts for ECG
or X-ray orders with a completed exam, but the patients are awaiting a wet read.
This column only works if you are documenting wet reads in Radiology
Management or marking the ECG with the ED review feature in ECG
Management . This column can be displayed or hidden based on configuration.
5. Pending Report Column: This column displays the patient counts for ECG, X-
ray, CT scan, or sonogram orders with a completed exam or preliminary read
(based on configuration) and the final report needs to be signed. This column can
be displayed or hidden based on configuration.
6. Pending Administered Column: This column displays the patient counts for
active medication orders that have not yet been documented as administered on
the medication administration record (MAR).
7. Pending Collection Column: This column displays the patient counts for active
blood or urine laboratory orders that are waiting to be documented as collected
or sent to the laboratory.
8. Pending Result Column: This column displays the patient counts for active
blood or urine laboratory orders that have been collected or are in the In
Lab status and are currently waiting for results.
Note
The patient count is displayed in three different colors based on the time thresholds
defined in configuration. Patients in a blue box are below the high threshold. Patients in
an orange box are above the high threshold, but below the critical threshold. Patients in
a red box are above the critical threshold.
Viewing Details
To open the Patients With Pending Orders details dialog box, click the arrow button in
the upper-right corner of the Patients With Pending Orders component. Similar to the
larger dashboard view, you can view data at the department level, or per zone (if the
system is configured to do so). Target, Overdue, and Critically Overdue time thresholds
are displayed at the bottom of the details dialog box.
For each patient, the following details are displayed in the Patients With Pending Orders
details dialog box if they are available:
Version: Feb 2021 ED Real Time Dashboard Manual 17 Room number
Total number of orders for the orders section selected
Number of orders pending complete
Number of orders pending preliminary read
Number of orders pending report
Patient information (such as name, age, and sex)
Acuity
Reason for visit
Assigned physician
Assigned nurse
Length of stay (LOS)
The Patients With Pending Orders details dialog box includes the following elements:
1. Department: Click Department to view details for the entire department.
2. Zones: Click a zone to view details for that specific area.
3. Orders Sections: Click a tab to view details for those specific orders.
4. Orders Column: This column displays the total number of pending orders for a
specific patient in the list.
Note
The patient count is displayed in three different colors based on the time
thresholds defined in configuration. Patients in a blue box are below the high
threshold. Patients in an orange box are above the high threshold, but below the
critical threshold. Patients in a red box are above the critical threshold. A patient
Version: Feb 2021 ED Real Time Dashboard Manual 18is counted more than once in these boxes if they have orders that qualify for
more than one process column.
5. Pending Complete Column: This column displays the amount of time in hours
and minutes (hh:mm) that has passed since an order was placed in a Pending
Complete status for a specific patient in the list. The time is displayed based on
the time thresholds defined in configuration.
o Time is displayed in white text with a red background when the critical
threshold has been met.
o Time is displayed in orange text when the high threshold has been met.
6. Pending Preliminary Column: This column displays the amount of time
(hh:mm) that has passed since an order was placed in a Pending Wet
Read status for a specific patient in the list. The time is displayed based on the
time thresholds defined in configuration.
o Time is displayed in white text with a red background when the critical
threshold has been met.
o Time is displayed in orange text when the high threshold has been met.
7. Pending Report Column: This column displays the amount of time (hh:mm) that
has passed since an order was placed in a Pending Report Status for specific a
patient in the list. The time is displayed based on the time thresholds defined in
configuration.
o Time is displayed in white text with a red background when the critical
threshold has been met.
o Time is displayed in orange text when the high threshold has been met.
8. Key: The key displays the following settings for each section:
o ECG: This displays the settings for the Complete High, Complete Critical,
Preliminary High, Preliminary Critical, Report High, and Report Critical
values.
o X-ray: This displays the settings for the Complete High, Complete
Overdue, Preliminary High, Preliminary Overdue, Report High, and Report
Overdue values.
o CT Scan: This displays the settings for the Complete High, Complete
Critical, Report High, and Report Critical values.
o Sono: This displays the settings for the Complete High, Complete Critical,
Report High, and Report Critical values.
o Meds: This displays the settings for Administered High, and Administered
Critical values.
o Blood: This displays the settings for the Collection High, Collection
Critical, Result High, and Result Critical values.
o Urine: This displays the settings for Collection High, Collection Critical,
Result High, and Result Critical values.
Viewing the NEDOCS Component
The National Emergency Department Overcrowding Scale (NEDOCS) is a scoring
system designed to assess and quantify the level of emergency department (ED)
Version: Feb 2021 ED Real Time Dashboard Manual 19overcrowding at the current time. The NEDOCS calculation is based on the following
data:
Number of patients in the ED
o Including patients in the waiting room
o The same number of patients in the ED Volume component
Number of ED beds used for treatment in the ED (based on configuration)
Number of admits being held in the ED (the same number of patients in the
Pending Admits component)
Number of licensed inpatient beds (based on configuration)
Number of patients on ventilators in the ED (based on configuration)
The longest admit time (the same as the longest boarding time in the Pending
Admits component)
The last bed time based on the last patient assigned to an ED bed (calculated
automatically based on the Bed Assign tracking event configuration)
The NEDOCS component includes the following elements:
1. Component Name: The NEDOCS component name and the facility name are
displayed.
2. Elapsed Time: The length of time elapsed since the calculation of the value on
the right is displayed in minutes.
Version: Feb 2021 ED Real Time Dashboard Manual 20Note
The elapsed time value is displayed in red if the most recent calculation failed.
3. NEDOCs Score Gauge: One of the following NEDOCS levels is displayed for
the entire unit:
o Not busy (Score 1 through 20)
o Busy (Score 21 through 60)
o Extremely busy, but not overcrowded (Score 61 through 100)
o Overcrowded (Score 101 through 140)
o Severely overcrowded (Score 141 through 180)
o Dangerously overcrowded (Score 181 through 200)
4. Score Level Indication: The indicator displays the score on the gauge.
5. NEDOCS Score: This number is the calculated score from the NEDOCS
algorithm.
6. Score Range: The range of scores for the current NEDOCS level is displayed.
Note
The NEDOCS scoring system used in ED Dashboard is adapted from the published
findings of Dr. Steven J. Weiss, et al. See the following external resource for more
information: Estimating the Degree of Emergency Department Overcrowding in
Academic Medical Centers: Results of the National ED Overcrowding Study (NEDOCS).
Version: Feb 2021 ED Real Time Dashboard Manual 21Viewing Details
To view details, click the arrow button in the upper-right corner of the NEDOCS
component. The NEDOCS details dialog box is displayed.
The NEDOCS details dialog box includes the following elements:
1. Date Range: You can select a range from the current time and back 24
hours. Select a specific start date to display 24 hours of data.
2. Show NEDOCS Trend: Select this check box to display the NEDOCS trend line.
3. Previous 12 Hours: Click this link to quickly view the previous 12 hours of
NEDOCS score data from the currently selected time.
4. Next 12 Hours: Click this link to quickly view the next 12 hours of NEDOCS
score data from the currently selected time.
Note
You cannot view a date or time that is in the future.
5. NEDOCS Graph: The graph displays the NEDOCS scores on the y-axis and the
time in hours on the x-axis. The score categories are displayed on the right. The
NEDOCS score at a given time is displayed with a bar indicator and a category
color.
6. Key: The key displays the NEDOCS categories in the context of score ranges
and colors.
Version: Feb 2021 ED Real Time Dashboard Manual 22NEDOCS Variable Values
Position the pointer over a bar on the graph to view the NEDOCS variable values
component.
The NEDOCS variable values component includes the following elements:
1. NEDOCS Variable Values: The component displays information related to the
calculated NEDOCS score for a given time.
2. NEDOCS Score: The displayed NEDOCS score aligns with the bar selected in
the graph.
3. Conditions: This section displays the values that were present at the time the
NEDOCS score was calculated.
4. NEDOCS Trend: This section displays the NEDOCS trend.
Version: Feb 2021 ED Real Time Dashboard Manual 23NEDOCS Trend Line
Position the pointer over the trend line to view the NEDOCS trend for a given time.
This page includes links to external resources. These resources are provided for
reference purposes and should be used with caution. Contact your Cerner support team
for more information about third-party content.
Viewing Tracking Groups and Zones
In ED Dashboard , you can select different tracking groups and zones to filter the data
that is displayed in the components.
The dashboard includes the following elements:
1. Tracking Group: Select the tracking group you want to view data for. Once a
tracking group is selected, the zone list is available.
Note
ED Dashboard recognizes encounter-organization security. If you have access to
more than one emergency department (ED) tracking group, you can set your
default tracking group. From the preferences menu in the upper-right corner,
select Save as Default Location. The tracking group you select is saved as your
Version: Feb 2021 ED Real Time Dashboard Manual 24default tracking group for ED Dashboard until you set another tracking group as
your default view.
If the Provider Checkin Access preference is set, you can only access the
component details dialog boxes for tracking groups you are checked into as an
available provider. You can still access other tracking group dashboards based
on encounter-organization security, but you cannot view the details dialog boxes.
This is a default-level preference. If you need access to all details dialog boxes,
the Position Full Access List preference can be set to allow any position to
override the Provider Checkin Access limitations. Those positions have full
access to all details dialog boxes for all tracking group dashboards based on
encounter-organization security.
2. Zones: After selecting a tracking group, the zones are populated by default to
display metrics for the entire department. To change the view to a specific zone,
click the specific zone tab.
o Click the Department tab to display metrics for the entire department
included in the selected tracking group.
o Select from a list of zones to view zone-specific patient data. This list is
populated based on Tracking Location View configuration.
Version: Feb 2021 ED Real Time Dashboard Manual 25You can also read