ELECTRIC BICYCLE REPORT - Supercykelstier
←
→
Page content transcription
If your browser does not render page correctly, please read the page content below
ELECTRIC BICYCLE
REPORT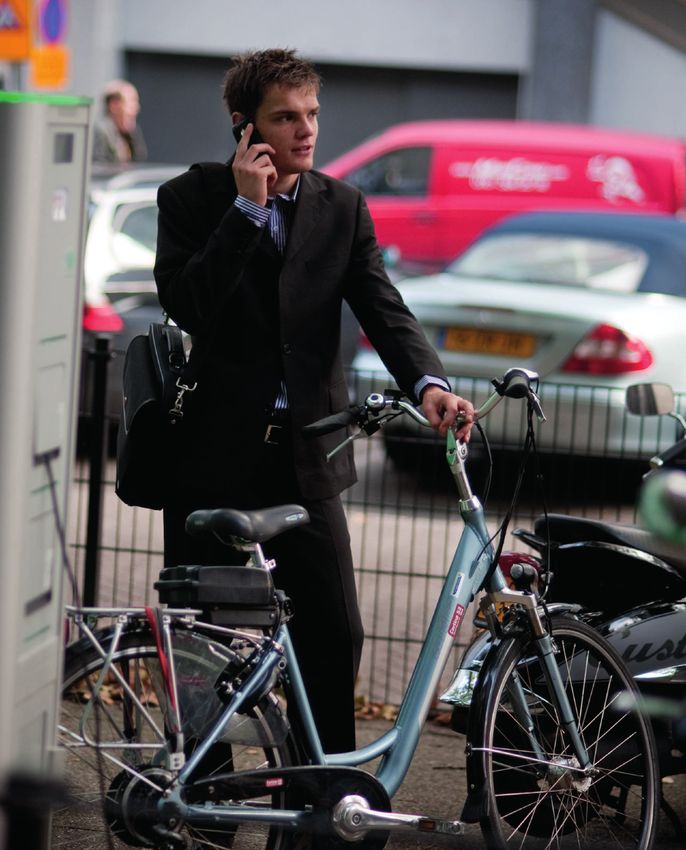
ELECTRIC BICYCLE
                        REPORT

MOBYCON | REGION OF COPENHAGEN

               COLOPHON
               Text and design: Mobycon.
               commissioned by: Cykel Super Stier
               Photography: Mobycon, Fietsberaad,
               bicicapace, bmw, scorpion, Bicycle
               Dutch, Sparta, Slim reizen & werken,
               Chargepoints.com.

               © Mobycon
               January 2014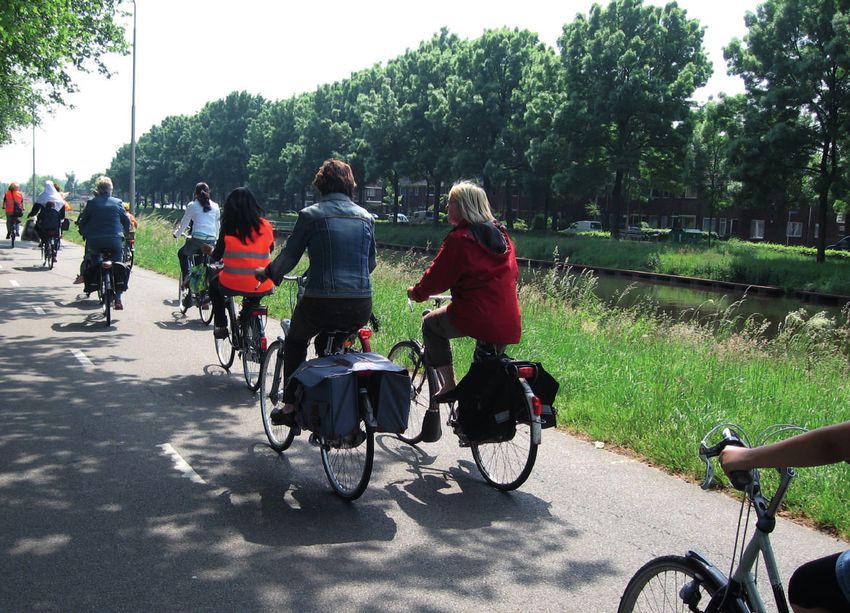
TABLE
Table OF
      of CONTENTS
         Contents
1   Introduction	                                                              5
    Definition of an electric bike	                                            7
    Sources                                                                    8
2   Market developments	                                                       9
    Characteristics of trips by e-bike	                                       11
    Sources                                                                   12
3   Health for e-bikers compared to regular bikers	                            9
    Recommended physical activity	                                            13
    Target Group 1: Commuters	                                                13
    Target Group 2: Elders	                                                   14
    Target Group 3: People suffering from obesity	                            14
    Sources                                                                   14
4 	Environmental issues	                                                      15
    Mobility effects	                                                         15
    Energy consumption	                                                       16
    Emissions	                                                                16
    Example	                                                                  17
    Batteries	                                                                17
    Liveability	                                                              18
    Sources                                                                   18
5 	Safety for e-bikes compared to regular bikes	                              19
    Speed and mental workload	                                                19
    Number of accidents with conventional bikes compared to e-bikes	          20
    Causes: single sided accidents and involvement of other road users	       20
    Place and time	                                                           21
    Consequences	                                                             21
    Sources                                                                   22
6   New challenges for infrastructure                                         23
    The bicycle network and cycle tracks	                                     23
    Bicycle parking and charging points	                                      26
    Sources                                                                   28
7   Promotion of e-bikes in the Netherlands	                                  29
    The bicycle industry	                                                     29
    Public authorities	                                                       30
    Sources                                                                   32
8   Thoughts on innovations in the mobility industry	                         33
    Sources                                                                   34
9 	Recommendations	                                                           35

                                                                               3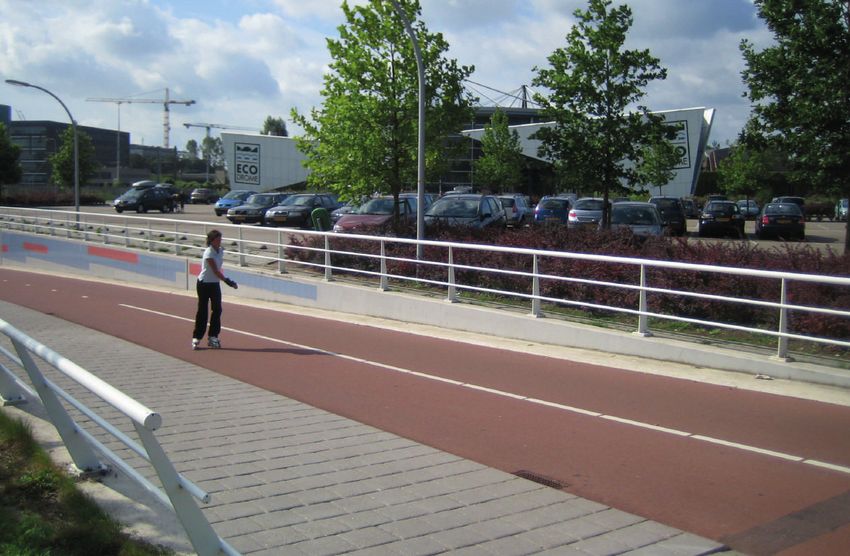
4

1 INTRODUCTION

The electric bike has       22 municipalities and the Capital Region of Copenhagen have been
a huge potential in         working together, since 2009, to create a network of Cycle Super
transferring commuters      Highways. The network is targeting commuters who travel more than
from cars to bikes, on      5km to and from job or studies. The electric bike gives you a helping
longer distances, and can   hand in the head wind, and up the hill, and it is a cheap and quick
thus, combined with the     means of transportation, as well as a good alternative to the car or
Cycle Super Highways,       taking the bus.
make it even more           In Denmark the electric bicycle is slowly gaining a growing interest in the
attractive for commuters    population, but has not yet established itself as a means of transportation,
to travel on a bicycle.     in the same way as the car, bus, train or conventional bikes. But
                            what are the implications if more people start to ride the electric
                            bicycle, and how does this compare to riding a conventional
                            bicycle?
                            There is very little knowledge in Denmark about the implications
                            of the use of the e-bike. Do electric bikes pose any new safety
                            challenges, which are not present with conventional bicycles? Riding
                            a bicycle improves individual health, and decreases societal health
                            costs. How does the electric bicycle contribute to health compared
                            with a conventional bike or when compared to driving a car? What
                            are the environmental implications of riding a bike that is powered
                            by electricity? Riding an electric bicycle allows a greater number of
                            cyclists to travel at higher speeds. Does this create new needs and
                            challenges for the way we design infrastructure? This report tries to
                            answer these questions based on European knowledge, and especially
                            from the Netherlands.
                                                                                                     5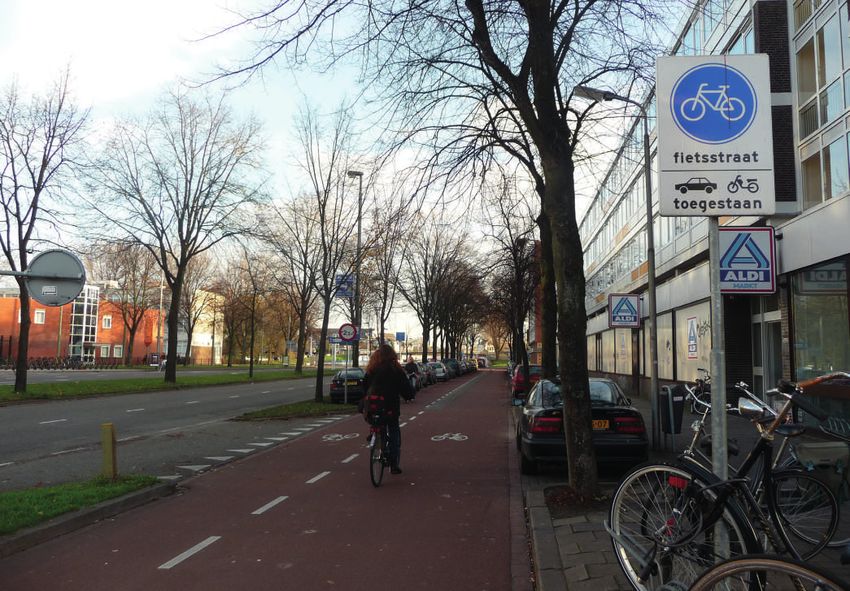
6
Definition of an electric bike
An electric bike (e-bike) is a bike with an electric motor that supports
pedalling. A battery powers the motor. With the same amount of
energy from the cyclist the e-bike has a higher speed compared to
a conventional bicycle. In other words, the cyclist on the e-bike
needs to give less energy to reach the same speed as the cyclist on a
conventional bicycle.
Riding an e-bike is often described as ‘cycling with continuous
wind in your back’.
However, due to the weight of the battery that powers the electric
motor, e-bikes are on average 9kg heavier than conventional bikes.
Since 2002, in the European Union (EU), it is forbidden that the output
of an electric motor is more then 250 W, and the maximum speed that
will be supported by the electric motor of the e-bike is 25 km/h. This
excludes e-bikes from meeting the type-approval of two or three-wheel
motor vehicles, hence categorizing them as conventional bicycles. It
also means that you do not need a driver’s license, a license plate,
insurance or a helmet. However, you do need to fulfil the requirements
of a conventional bike, e.g. lighting and reflection, should the member
state law specifies it. In 2009, a European standard was adopted to
provide design, assembly, engine power management systems and
electrical circuits requirements and specifications for the e-bikes. This
standard was the result of a high European demand from manufacturers
and e-bike advocates. In the Netherlands, e-bikes that do not require
pedalling are defined as mopeds.
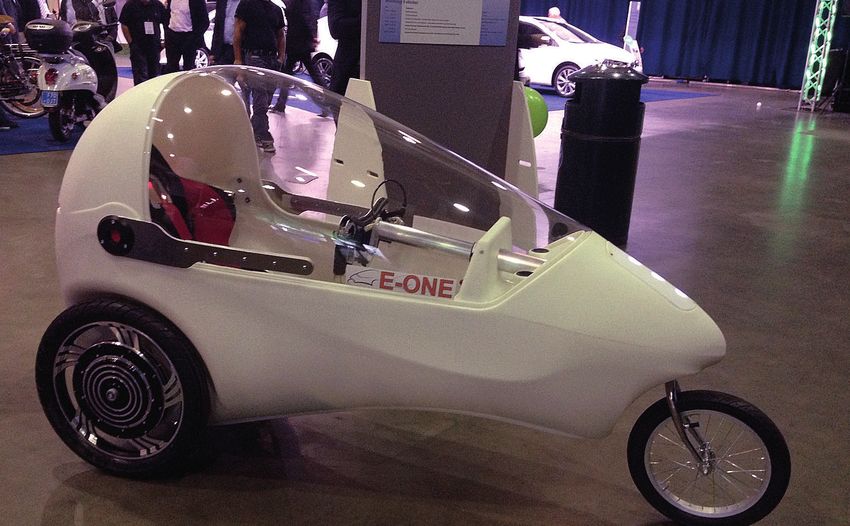
It is not only the conventional city bike that has been transformed into
different e-bike versions. Other types of e-bikes include e-cargo-bikes
and electric tricycles.
Despite the fact that clarifications have been brought on the status of e-bikes, future improvements
in the legislation are expected considering the rapid development and diversification of e-bikes.
Some ideas have emerged, notably suggesting a limit in maximum
power-assisted speed – that would be proportional to the pedal power
applied – rather than a drive system power limit. This would match the
situation of a regular bicycle, where speed is proportional to muscle
power, and allow people going uphill without difficulty anymore.
7
Advantages of an electric
                                                   bike
                                                   An electric bicycle has many of the same advantages
                                                   that conventional bicycles have, when compared to
                                                   cars. It is healthier, better for the environment and needs
                                                   less space than a car does.

                                                   Due to the ‘continuous wind in the back’ the
                                                   e-bike is seen as a vehicle seriously competing
                                                   with car trips on distances up to 15 or 20
                                                   kilometre.

                                                   Due to the electric motor, the advantages of the e-bike
                                                   can be smaller than what they would be for a conventional
                                                   bicycle. But when the e-bike substitutes to cars due to
                                                   its competitiveness, the overall effect is bigger.

                                                   Disadvantages
                                                   •    An e-bike is heavier than a conventional bike
                                                   •    Elderly are less skilled in traffic
                                                   •    Relative high numbers of accidents

Sources
Amendments by the European Parliament to the Commission proposal Regulation (EU) No .../2012 of the
European Parliament and the Council on the approval and market surveillance of two- or three-wheel vehicles
and quadricycles [2012] A7-0445/148/rev

Directive 2002/24/EC of the European Parliament and of the Council of 18 March 2002 relating to the type-
approval of two pr three-wheel motor vehicles and repealing Council Directive 92/61/EEC [2002] OJ L124/1

European Committee for Standardization (2011). Cycles - Electrically power assisted cycles - EPAC Bicycles.
EN 15194:2009+A1:2011

Go Pedelec Project Consortium (2012, July 17). Go Pedelec handbook.

8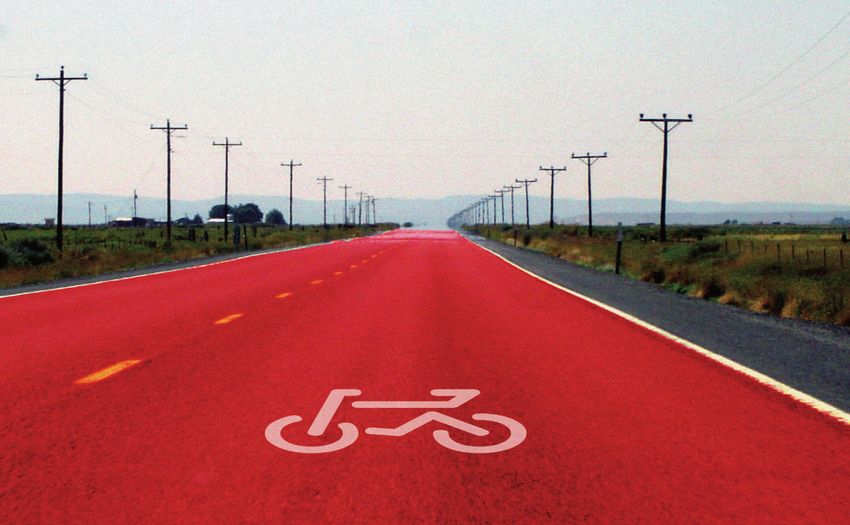
2 maRkET DEvElOPmEnTs
EUROPE
The e-bike is becoming increasingly popular in Europe. Although it is difficult to track
the
  Theexact  number of e-bikes sold every year due to a variety of classifications (hence the244
      Netherlands
need forDenmark
         legislating on e-bikes as different vehicles than
                                                        125
                                                           conventional bikes), one can say
the sales are growing at a constant rate: about 200,000 extra e-bikes are sold every year.
         Austria                                         125
Figure 2.1 below shows the distribution of e-bikes sold in 2012 across the EU (Croatia not
       Germany                                     111
included back then). One can see that
        Belgium                     53
in absoluteItaly
              numbers18most e-bikes are sold in Germany (45% of sold units) and in the netherlands
(21% of sold units). nevertheless, these numbers need to be adjusted to population size; when
         France     16
taking the countries’ population into account, it is clear that the netherlands – followed by
          Spain     15
Denmark and austria – are the countries with the most e-bikes sold per inhabitant,
    Great Britain   11

 The Netherlands                                         21%
       Denmark            4%
         Austria               5%
       Germany                                                                                     45%
        Belgium          3%
            Italy              5%
         France                5%
           Spain          4%
    Great Britain         4%                               Figure 2.1: Share of e-bike sales in the EU
           Other               5%                          (Croatia excluded) (Source: GoPedelec, 2012)

 The Netherlands                                                                            244

       Denmark                                           125

         Austria                                         125

       Germany                                     111

        Belgium                     53

            Italy        18

         France       16

           Spain     15
                                                           Figure 2.2: Number of e-bikes per 100,000
    Great Britain   11
                                                           inhabitants

                                                                                                          9
 The Netherlands                                         21%
       Denmark            4%
         Austria               5%
with 244 e-bikes per 100,000 people (Figure 2.2). As a matter of fact the Netherlands
                      and Denmark have very high-quality cycling networks and hence can easily attract new
                      types of bicycles. Note however that up to now e-bikes remain a marginal mode of
                      transportation, with very few units per inhabitants.

                      Sales of e-bikes in the Netherlands
  There are about     Before 2004 hardly any e-bikes were sold in the Netherlands. In 2004 the share of e-bikes
19 million bikes on   in all bicycles sold was 2%. In 2007 this share was 6% and it kept on rising steadily up
 Dutch roads and      to 20% in 2011.
   about 1 million
 (6%) are e-bikes.    It is expected this figure will grow fast in the upcoming years, due to the high percentage
                      of e-bikes being sold compared to that of conventional bikes and the prediction of an
                      even further increase of e-bike sales in the coming years.

                      The e-bike is most popular amongst the elderly, and within this group, it is
                      especially appreciated amongst women.

                                                        A strong increase in the use of the bicycle amongst this
                                                        group has a strong relation with the rise of the popularity
                                                        of the e-bike, research shows. Compared to the year
                                                        2000, women aged 60+ in 2009 cycled 19% more
                                                        kilometres. We also know that 24% of bicycle kilometres
                                                        of elderly women are done by e-bike, while this level was
                                                        around 0% in 2000. The level of bicycle ownership in this
                                                        group has increased as well, up to 10% of women over
                                                        60 (Table 2.3).

                                                        Currently e-bikes are also getting more popular
                                                        amongst younger groups. More affordable prices
                                                        and better batteries play their part, as well as a growing
                                                        acceptance of e-bikes and smart marketing by the
                                                        bicycle industry that now offers more models and puts
                                                        its focus on commuters.
     10
SALE < 46 y/o
46-60 y/o
Men
1%
7%
Women
1%
13%
Weighted average
1%
10%
> 60 y/o 10% 10% 10%
Weighted average 4% 6% 5%
Table 2.3: Percentage of people owning an e-bike in the Netherlands in 2012 with respect to age and
gender (Source: Fietsberaad, 2013)
Why buying an e-bike?
Elderly buy an e-bike mainly because it is easier to ride and gives more comfort
(longer distances are possible, a “push at the back with the wind”). People under the
age of 65 use their bike for commuting and they do appreciate the higher speeds
for longer distances when compared to conventional bikes. In the Netherlands, the
reasons why people decide to purchase an e-bike are: (1) the pedal assistance that
an e-bike provides to make biking an accessible alternative to move around (44% of
e-bike owners surveyed in 2013); (2) the support of the pedal assistance when strong
adverse wind conditions (42%); and (3) the possibility of reaching further destinations,
hence the increase in accessibility to jobs, leisure, and services (35%). A point worth
noting is that people under the age of 55, on top of agreeing with the above-mentioned
reasons, appreciate the higher speeds that can be reached more easily with an e-bike.
They represent 11% of the people aged 12-54, when only 2% of the people over 55 care
about this aspect of the e-bike.
Characteristics of trips by e-bike
Length of trips
The average distance cycled on a conventional bicycle in the Netherlands is 18 km per
week. On the e-bike the average distance cycled increases to 31,3 km per week. This is
partly due to an increase in kilometres per user, but is probably also caused by the fact
that e-bikes are bought by people who want to cycle further in the first place. Almost half
of the users of the e-bike are ‘heavy users’; they use the e-bike more than four times a
week. Women are overrepresented in this category of heavy users. Light users form 20%
of the users of e-bikes; they use their e-bike only once a week or less. They tend to be a
bit older than the average user of the e-bike, have a high-income level and live in a city.
Finally, note that irrespective of age, more kilometers are cycled with an e-bike than
with a conventional bike. For men the trip distance on e-bikes even increases with the
age (Table 2.4).
11Table 2.4: Weekly distance traveled with respect to age, gender and bicycle type in the Netherlands
(Source: Fietsberaad 2013)
Men Women Weighted average
e-bike Conventional bike e-bike Conventional bike e-bike Conventional bike
< 46 y/o 33.3 22.2 29.6 19.3 31.2 20.7
46-60 y/o 34.2 18.8 29.1 15.6 30.9 17.3
> 60 y/o 35.4 15.3 28.3 14.5 31.6 15
Weighted
34.9 19.6 28.7 16.9 31.3 18.2
average
Speed
In contradiction to what one may expect, the speed difference between cyclists has not
increased due to the rise in the numbers of e-bikes. Indeed, Dutch research shows that
the speed difference has been reduced due to the use of the e-bike. Elderly keep up with
the speed of other adult cyclists! That could be confusing for other road users since
they may not expect an elderly person on a bike to cycle with the same speed as them.
It is however expected that when e-bikes get more popular amongst younger
groups, the speed difference between conventional bikes and e-bikes will increase.
Trip purposes
The main purpose of trips on e-bikes in the Netherlands is
recreational.
Other motives are shopping and visiting people. This focus on private trips, and not trips
to school or work, reflects the high proportion of elderly using the e-bike.
In the Netherlands, people have stated that they use their e-bike for leisure (77%), shopping
and running errands (68%) and visiting family and friends (47%). Some disparities exist
across age groups. For instance, people over 65 show a strong tendency to use the
e-bike for recreation purposes (89%) and for shopping (68%), where commuters are less
inclined to use it for these same purposes (64% and 60% of the people in this category
stated these preferences). Without surprise, the number one reason why commuters
who own an e-bike ride theirs is to get to work more easily, and faster
(64% of the respondents agreed).
Sources
COLIBI – COLIPED. (2013). European Bicycle Market – 2013 edition: Industry & market profile (2012 statistics).
Fietsberaad. (2013, May). Feiten over de elektrische fiets. Publication 24, version 1.
Go Pedelec Project Consortium (2012, July 17). Go Pedelec handbook.
Hendriksen I., Engbers L., Schrijver J., van Gijlwijk R., Weltevreden J., and Wilting J. (2008). Elektrisch Fietsen
Marktonderzoek en verkenning toekomstmogelijkheden. TNO KvL/B&G/2008.067
Kruijer H., den Hertog P., Klein Wolt K., Pannerman M., and Sprik E. (2013, March). Fietsongevallen in
Nederland. VeiligheidNL.
123 Health for e-bikers compared
to regular bikers
Recommended physical activity
The World Health Organization (WHO) recommends that adults aged 18 to 64 engage in at least
20min of moderate-intensity physical activity per day, or 10min of vigorous-intensity physical
activity per day. Each activity period should last at least 10min. Finally, extending the duration of
daily activity can provide additional health benefits, and muscle strengthening will take place if
major muscle groups are in use at least twice a week.
Target Group 1: Commuters
Interestingly enough, the WHO notes “inactive people should start with
small amounts of physical activity and gradually increase duration,
frequency and intensity over time.” This makes the case of the electric
bicycle an excellent option for this roup of people.
The electric bicycle can indeed be an opportunity as a soft transition
vehicle to get car-driving commuters to ride a conventional bicycle.
This is especially the case for employees who find that they live too
far from work to get on a bicycle, or that cycling is too slow to get to
work, despite the fact that they would like to exercise daily. According
to the study by TNO it can be expected that the electric bicycle
could be responsible for an increase of about 10% in the number
of bike commuters.
This could be of great interest for the employers since healthier
employees would lead to less health care expenses, more productivity,
and an overall better mood and environment at work.
13Target Group 2: Elders
Since the population is ageing in Europe, it is of prime importance to
treat the case of 65+ people with care, in order to improve their health.
It has indeed been shown that people over 65 do not comply with the
WHO recommended level of activity. The electric bicycle can thus be a
great means of keeping elders healthy.
Research has indeed shown that people over 65 are interested in the assistance that the electric
bicycle offers. This allows them getting back on a bike to reach the places they used to go to
– and even new ones! – or gives them a chance to experience cycling in a comfortable way for
those who have never biked in their life.
Target Group 3: People
suffering from obesity
It has been shown that riding a bicycle regularly lowers chance of
premature death, reduces the risk of chronic diseases, enhances
physical fitness, and prevents excess weight. Little by little, this can
ensure a new habit for people suffering from excess weight, and
therefore help them getting fitter. The idea is that the use of an electric
bicycle can be very encouraging since it brings greater accessibility
and mobility for people having difficulties to actively go from place to
place. Data on whether or how this works in practise is not available.
In the Netherlands, it has been shown that the electric bicycle helps
burning 4.7kcal/min – where the conventional bicycle helps burning
The electric bicycle can help between 5.9 and 7kcal/min1. If one cycles 30min a day and 150 days a
exercising and burning a year, this means that they can expect to burn 21,150kcal a year. Note
great amount of calories in however that people with excess weight tend to burn more calories per
a soft manner through its minute since it requires extra effort to move a greater mass for a given
assistance. speed.
1
By knowing the weight of a bike and a human body, as well as the watts required to power an e-bike to reach a certain
speed and maintain it, one can calculate the number of calories required for a trip.
Sources
Go Pedelec Project Consortium (2012, July 17). Go Pedelec handbook.
Hendriksen I., Engbers L., Schrijver J., van Gijlwijk R., Weltevreden J., and Wilting J. (2008). Elektrisch Fietsen
Marktonderzoek en verkenning toekomstmogelijkheden. TNO KvL/B&G/2008.067
World Health Organization. (2011). Global Recommendations on Physical Activity for Health – 18-64 years
old. Last retrieved January 2014, from World Health Organization: http://www.who.int/dietphysicalactivity/
physical-activity-recommendations-18-64years.pdf
144 Environmental issues
Mobility effects
When there is a growth in the use of e-bikes some positive effects on the environment can
arise. Because of the electric support, cyclists can ride faster and further with the same
amount of personal effort. Also, it is easier to overcome barriers, such as bridges and
tunnels. Especially for commuters these factors are very relevant.
Research in the Netherlands found that people who have an e-bike ride 22% more kilometres
per week. This is because the cyclists go further and they ride their e-bike more often
compared to their pattern with a conventional bicycle.
In the same research the average commuting distance rose from 6.3 to 9.8 kilometres for
people who use the e-bike. And there is a substantial substitution from other modes to the
e-bike. 34% of the trips on the e-bike were formerly done on a conventional bicycle
and this is mainly the case for recreational routes of elderly. This can be due to the fact
that elders have replaced their conventional bicycles by e-bikes for other trip purposes
than recreational cycling (i.e. groceries, visiting friends, etc.), and therefore abandoned
the habit or the will to use a conventional bicycle for recreational cycling. Another reason
could be that e-biking requires less effort and elders can thus bike for longer distances
for recreational purposes. Also, it is reported that elders may keep up with cycling up to a
higher age, thus creating cycling trips. 18% of the trips were previously done by car,
and primarily done by elders. Another 2.5% of trips are a substitution from a moped
to the e-bike (Table 4.1). Several studies indicate that trips by e-bike do not, up to now,
have a high impact on public transport. It is not yet known why this is the case.
15Total (%) Commuters (%) 65+ y/o (%)
Conventional bike 34.3 33.3 43.3
Table 4.1:
Car 18.3 15.9 19.1
Substitution of
the e-bike to Bus 2.4 5.8 1.2
other modes of Walking 2.1 0 1.2
transportation Moped (max. 25km/h) 1.5 0.8 0
(Source: Hendriksen Moped (max. 45km/h) 1 3 0
et al., 2008)
Tram, metro 0.6 1.8 0
Taxi 0.5 0 0.2
Motorcycle 0.2 0.8 0
Train 0.1 0.5 0
Other 1.2 0.8 0
No substitution 37.8 37.4 35.1
Total 100 100 100
Energy consumption
The electric pedal assistance of an e-bike
requires an energy input for the charging
of the battery. Over the course of a year, it is
expected that an average battery needs 270
kWh of electric input in order to power the pedal
assistance. If the battery is to be charged via
solar energy, this translates to a photovoltaic
surface of 2.7m2.
Emissions
Despite its need for energy consumption, there is a high potential to reduce emissions
through the use of the e-bike as a substitution of car trips. As the e-bike is an
attractive mode of transport on relatively short distances these are often times trips within
the build-up area. Here emissions are most harmful and if the trips were done by car they
would be done with a cold engine, when emissions are higher.
There is an effect on CO2 emissions when the number of car trips reduces. The Dutch
study in 2008 calculated that with a wide spread use of the e-bike in the Netherlands as
a whole about 110 to 280 kilotons of CO2 emissions could be avoided, which is 0.3 to
0.7% of the yearly emissions in traffic. The assumption for this estimation of the maximum
possible effect in the future, is that the ownership of e-bikes in the Netherlands in the
future is as high as regular bicycle ownership in the Netherlands in 2008. The emissions
that play a role on the local level are e.g. emissions that are harmful when inhaled, such
as particulate matter PM10 (less than 10 micrometre in diameter) and PM2.5 (less than 2.5
micrometre).
16Example
If a city or region were to implement a pilot project with 1,000 electric bicycles with the aim to attract
commuters (hence one round-trip a day), and assuming:
• The average trip distance from home to work is 7.5km;
• 18% of e-bike trips substitute car trips (hence 180 cars);
• 1% of e-bike trips replace moped trips (hence 10 mopeds);
• The car and moped fleet is equally divided from 1997 through 2005; and
• The share of gasoline and diesel car engines is 50/50,
we can estimate that the carbon monoxide (CO), volatile organic compounds (VOCs), nitrogen oxides
(NO), and PM10 emissions over 2850km will be reduced by 7.4kg, 1.6kg, 1.5kg and 0.11kg respectively.
Note that these figures do not take the battery charging emissions, nor their disposal impact on the
environment. Ideally the energy source for charging would come from renewable sources such as solar
panels.
Batteries
There exist four main types of batteries: lead-acid (Pb-acid), nickel-cadmium
(NiCd), nickel-metal hydride (NiMH), sodium nickel-chloride (NaNiCl) and lithium-
ion (Li-ion). Research has shown that the first three types are less energy efficient
– both in terms of production/assembly and usage –, heavier, and presents high
difficulties when it comes to disposal (lead and cadmium are extremely toxic
materials). Although sodium nickel-chloride batteries are the most energy-
efficient, they are slightly heavier than lithium-ion batteries, and require more
processing for a safe disposal at the product’s end of life. This is why the
European Union is encouraging the use of lithium-ion batteries while
strongly restricting the use of lead-acid and nickel-cadmium batteries.
17Liveability
Other positive effects of the use of the e-bike, as a substitution for shorter trips with
the car or the conventional moped and scooter can be seen in the field of liveability. To
mention a few: noise reduction, liveliness on the streets (people on bikes instead of
in cars) and social safety.
Sources
European Commission. (2013). Batteries. Last retrieved January 2014, from European Commission:
http://ec.europa.eu/environment/waste/batteries/
Matheys J., Timmermans J.-M., van Autenboer W., van Mierlo J., Maggetto G., Meyer S., De Groof A.,
Hecq W., and van den Bossche P. (2006). Comparison of the Environmental impact of 5 Electric Vehicle
Battery technologies using LCA. In proceeding of: 13th CIRP International Conference on Life Cycle
Engineering 2006, Leuven, Belgium.
Mobycon. (2008). Rotterdam gaat elektrisch fietsen. Fietsberaad.
Hendriksen I., Engbers L., Schrijver J., van Gijlwijk R., Weltevreden J., and Wilting J. (2008). Elektrisch
Fietsen Marktonderzoek en verkenning toekomstmogelijkheden. TNO KvL/B&G/2008.067
Loijen J. (2011, October). Elektrische fiest in Haaglanden – Onderzoek naar het gebruik van de elektrische
fiets in Haaglanden. Stadsgewest Haaglanden.
185 SAFETY FOR E-BIKES
COMPARED TO REGULAR BIKES
With the spectacular rise of the use of e-bikes in the Netherlands over the last years
and the rise of the number of seriously injured cyclists, the question rose whether
the e-bike is a less safe way to cycle, compared to a bicycle without the support
of a battery. Research is currently being carried out to get a better insight in cycling
behaviour when riding on the e-bike and on the nature, range, underlying causes and
consequences of accidents with electric bicycles. With these new insights a program to
prevent accidents with e-bikes can be developed, in the case of e-bikes being less safe.
Research methods include focus groups, questionnaires and an experimental field study
with cameras, instrumented bicycles and sensors on the cyclist to study the reaction on
several situations that have to be dealt with in traffic.
Speed and mental workload
The field experiment with middle aged (mean age 38) and older (mean age 70) cyclists
revealed that both age groups rode significantly faster on an e-bike than on a
conventional bike. On straight sections the difference was greatest whereas in curves
the difference was small. But in all situations and on both types of bicycles the older
cyclists, when compared to the middle-aged cyclists, rode slower. The speed of
the elderly cyclists on e-bikes turned out to be the same as middle-aged cyclists on
conventional bicycles. As for the mental workload, it was found that it was higher in
complex situations compared to simple ones, but it did not make a difference whether
the test person rode a conventional bike or an e-bike. The researchers stated that
it looks like cyclists of all ages, on both types of bicycles, slow down their speeds
in complex traffic situations. Further research will have to prove this. The difference in
speed on cycle tracks seems to be less nowadays, compared to some years ago. Thanks
to the e-bike more people can keep up with the average cycling speed. This is good for
cycling safety, as there is less overtaking and conflicts amongst cyclists.
19One thing may be more unsafe, which is the expectancy of other road users
seeing elderly people with a certain sitting position on a bicycle that looks like a
conventional city bike, not expecting them to keep up with the average speed.
In the future the difference may increase, when more younger and fitter people also start
to use the e-bike, for their commute of 10 to 20km for example.
Number of accidents with conventional
bikes compared to e-bikes
The estimated number of cycling accidents with conventional bicycles in the Netherlands
is 61,400 people per year. They end up at the emergency and first aid units of hospitals.
61,400 p/year The majority of these victims are male (57%) and the average age is 38 years.
The estimated number of people in the Netherlands who had an accident with an e-bike
and ended up at the emergency and first aid unit of a hospital is 9,100 per year (15% of
all cycling accidents). The majority of the group of e-bike victims is female (70%) and
9,100 p/year for this group the average age is 66 years.
Causes: single sided accidents and
involvement of other road users
Most of the accidents with conventional bicycles are single sided accidents,
caused by the cyclist falling off the bike. Younger victims (12–24 years) are more
often involved in accidents with other road users, compared to older age groups, or in
accidents where they hit an object. Younger victims also state that the accident happened
while cycling or stunting on the bike. Victims aged 65+ often fall from the bicycle when
getting on or off their bicycle. Furthermore, half of the victims state that their behaviour
on the conventional bicycle played a role in the cause of the accident. Amongst younger
victims (12-24 years) in about half the cases the behaviour of other road users played a
role, whereas amongst the elderly cyclists (65 and older) this was only the case in about
a quarter of the cases. A problem with the technical state of the bicycle mainly played a
role in the younger age group.
20Just like accidents with conventional bicycles,
most accidents with e-bikes occur because
the rider falls off the bicycle. When corrected
for age differences, the causes and types of
accidents of people on e-bikes and people on
conventional bikes are comparable.
Still, in 17% of the cases the rider of the e-bike states that the fact that he/she rode
an e-bike played a role in the accident. This is especially true for the 12-54 years age
group. They mention that the weight of the e-bike and the speed played a role.
The age group of 12 to 54 years seems to ride the e-bike for health reasons more often and fall
from the bike in a stationary position more often.
Place and time
Most accidents with conventional bicycles occur on separated cycle tracks or in streets,
especially at straight tracks. Accidents take place in the curves too, and in half of the
cases these accidents are related to the state of the road. Most accidents occur during
the week between 9am and 4pm, although younger victims have most accidents at night.
Overall alcohol played a role in 7% of the cases, mainly amongst victims up to 49 years.
These accidents mainly occur in the weekend and at night.
Consequences
Most of the victims who rode a conventional bicycle were wounded after falling; younger
people relatively often by hitting an object, elderly people relatively often by getting on and
off the bicycle. The age of the victim and the type of injury are related: the older the victim
is, the more fractures and the younger the victim, the more superficial injuries and distortion.
Elderly victims are hospitalized more often after a bicycle accident and they expect the injury
to have lasting effects more often compared to younger victims. Lastly, more elderly victims
expect that they will not be able to ride their bicycle any more after having had the accident.
Up to now, it looks like the consequences of the accidents with the e-bike overall are comparable
with the consequences of accidents with conventional bicycles.
Especially since it is still unclear whether self selection plays a role in the purchase of an
e-bike: the group buying an e-bike may differ from the rest of the cyclists which makes
it hard to say whether the accident happened because the rider was on an e-bike or
because the group is at higher risk anyway.
21Sources Fietsberaad. (2013, May). Feiten over de elektrische fiets. Publication 24, version 1. Kruijer H., den Hertog P., Klein Wolt K., Pannerman M., and Sprik E. (2013, March). Fietsongevallen in Nederland. VeiligheidNL. Twisk D.A.M., Boele M.J., Vlakveld W.P., Christoph M., Sikkema R., Remij R., and Schwab A.L. (2013). Preliminary results from a field experiment on e-bike safety: speed choice and mental workload for middle- aged and elderly cyclists. In proceeding of: International Cycling Safety Conference 2013, 20-21 November 2013, Helmond, The Netherlands. 22
6 New challenges for
       	infrastructure

Policy makers in a number of European countries have high expectations from the
e-bike as it can be a serious alternative to cars for short trips. At the same time the
outstanding rise of the use of e-bikes creates new challenges for existing and new bicycle
infrastructure. Recently several research projects have been set up in the Netherlands,
aiming at understanding whether the existing guidelines for cycling infrastructure
need to be adapted and if a different approach towards bicycle parking facilities
is needed.

The bicycle network and cycle tracks
Sustainable safety
A short overview of the Dutch vision on safe infrastructure is at its place. Denmark and
the Netherlands are both countries that rank high in traffic safety figures, while
ranking high in bicycle usage. In the Netherlands the road safety policy is identified
as good practice. ‘Sustainable Safety’ is the leading vision behind this policy. The five
principles of Sustainable Safety are:
• The functionality of roads
• The homogeneity of mass and/or speed and direction
• Physical and social forgivingness
• Recognition and predictability of roads and behaviour, and
• Self awareness (the ability of road users to predict their own competences correctly).

Figure 6.1 shows the steps that translate this vision into actual design for cycling facilities
on the road. In the design phase, the five main requirements (coherence, directness,
safety, attractiveness and comfort) of the national bicycle design manual (also known as
CROW manual) play a crucial role.

                                                                                                     23
THE CYCLIST AS A STARTING POINT FOR DESIGN
Five main requirements: Network
coherence
Route
directness
safety
Road Section
attractiveness
comfort Intersection
Figure 6.1:
From the Sustainable FUNCTIONAL FESIGN: FOLLOW THE FUNCTION
Safety vision to design of
cycling facilities.
The current research questions aim to understand the five requirements from the perspective
of the e-bike in comparison to the conventional bicycle. an important aspect is that a large
proportion of e-bike users are elderly, who are seen as vulnerable road users.
bICyClE nETWORk anD ROUTEs
There is a relation between the usage of an e-bike and urbanization:
e-bike users cycle a longer distance when the degree of urbanization
decreases. Two factors explain this trend. First, people use an e-bike
more often for recreational cycle trips compared to the usage of
conventional bicycles. Even in the case of conventional bikes, people in
less urban areas make more recreational cycling kilometres. Second, the
commuting distance between home and work and between home and
shops in less urban areas is larger. The e-bike is an attractive alternative
for the car, while the conventional bike is not an option anymore.
With this in mind there might be new challenges in the regional
bicycle network: certain areas or routes that were previously
not interesting enough for a large group of users, could now
become more popular. one of the consequences is that
municipalities need to collaborate more in order to make sure
that the network in the outskirts of the municipality match that
of the neighbouring municipalities.
24Cycling highways
The first ‘cycling highway’ in the Netherlands opened in 2005. It is a 7.5 km high quality
cycle route between the cities of Breda and Etten-Leur in the province of Noord-Brabant.
The aim to start building cycling highways is to help avoiding traffic congestion
by stimulating car drivers who live up to 15km from their workplace to switch to
the use of the bicycle. Hence this development
started before the high rise of e-bike usage.
Since the e-bike is an interesting alternative to
conventional cycling, especially since commuters
have to travel 5 – 15 kilometres, these developments
create a positive synergy in the promotion of
cycling. In 2013, there were 25 cycling highways in
the Netherlands and there were plans for 675 extra
kilometres.
The ambition to tempt a cyclist to cycle a greater
distance creates needs for different infrastructure
designs. The average speed of cyclists using the
e-bike is expected to get higher: less stops at intersections and a minimum of the
inconvenience when passing cars. The user experience and how network, route choices
and design may influence this experience is becoming more important. The expectancy
is that there is a growing overlap between recreational routes and regional routes for
commuters. An attractive, smooth and quieter route
is also appreciated. In general one can say that the
bicycle infrastructure on cycling highways should
be wider.
In the ideal situation the width of a cycle highway
is about 7 meter (3 meter per direction, including
a median strip in between). In practice, 4 meter
with a median strip is the minimum.
A forgiving cycle path
As we already saw in the chapter on safety, a lot of the
accidents with e-bikes and with conventional bikes
in the Netherlands are single sided accidents and a
substantial part of the victims are elderly. Cyclists fall
off the bicycle e.g. when getting on or off the bicycle,
when they bump into bollards, when the road is
slippery or when there is a height difference between
the road and the shoulder that was not well visible.
The development of the concept of a ‘forgiving cycle
25path’ derives from the third principle of Sustainable
Safety: ‘physical and social forgivingness’.
The design of this cycle path is self-explaining,
corrects when mistakes are being made and
reduces the seriousness of accidents.
Research on the concept is currently being carried
out, but a few examples of measures in the
infrastructure have already been presented. Like
white lines or profiled road markings clearly marking
the edges of the separated cycle path, led lights in
the median of the separated cycle track and profiled
road markings when approaching a bollard. Finally,
evacuation times at traffic signals may be adapted to serve the elderly cyclists who
increasingly use e-bikes and by that continue to cycle up to a higher age.
Wayfinding
As said before, there might be a growing overlap between recreational and commuting
routes in the Netherlands. As it is easier to cycle longer distances with an e-bike,
wayfinding becomes more important for both recreational cyclists and new (e-)cycling
commuters. On-street way finding, combined with information available on the
Internet are good services that support the new users of e-bikes. There are different
web-based tools and smart-phone apps available. Some interesting tools to mention are
the cycling route planner from the Danish Cycling Federation (http://cyclistic.dk/en/) and
the international route planner NAVIKI (www.naviki.org).
Bicycle parking and
charging points
Number of stolen e-bikes
in the Netherlands in 2013
With the rise of the number of e-bikes being sold,
the number of stolen e-bikes in the Netherlands is
also rising. One insurance company – the market
leader in the Netherlands for selling (e-)bicycle
insurances – recently published an article in which
they estimate that 25,000 e-bike were stolen in 2013,
with an estimated value of 45 million euros. With
this in mind, it is clear that safe, accessible and
convenient bicycle parking facilities at strategic
locations, such as city centres, neighbourhood
shopping areas and workplaces, are important.
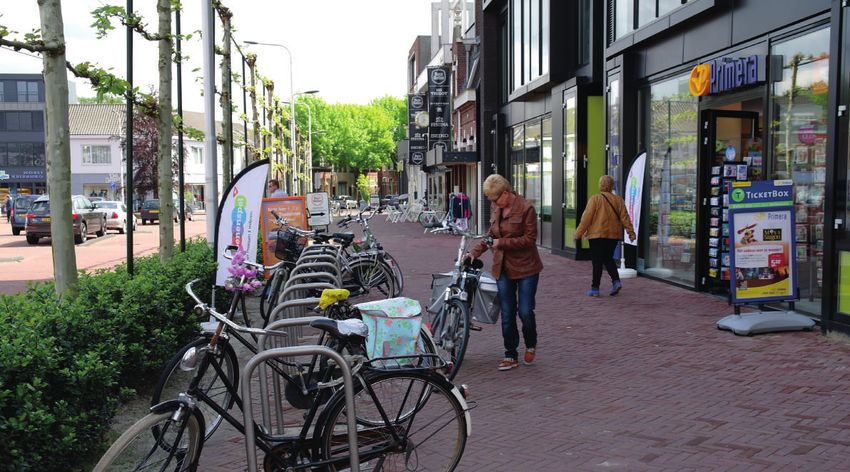
26Bicycle parking
Just like users of cargo-bikes and bikes with child seats, the e-bike users have their
own wishes. E-bike users are afraid that the e-bike will be damaged when parked in the
open space so they do not want to park the bike at every location. The characteristics of
the e-bike that cause this are:
• the e-bike has a higher steer with more and vulnerable cables and computer;
• the e-bike is heavier and the division of the weight is different compared to the
conventional bicycle, which causes fear for a bending of the wheel;
• the e-bike has a broader frame and;
• the e-bike is more expensive.
Also, elderly state that it is problematic to lift
the e-bike into bicycle parking facilities.
In many cases the best solution for users is
to have a bounded, but open area to park the
e-bike on the kickstand. The only Dutch parking
system that meets the wishes of the majority of
the Dutch e-bike users is the typical ‘nietje’.
Charging points
Several Dutch municipalities are nowadays
installing charging points in their public
municipal bicycle parking facilities. Users
of e-bikes appreciate this, but in fact an
accessible power socket and a shelf on
which to put the adapter fulfil the actual
needs. Especially since the action radius of
the battery has increased to over 60km. At the
27same time, a simple charging point can overcome the psychological barrier as it reduces
e-cyclists risk of an empty battery. For destinations that are further away and at places
where people spend more time, like working locations and recreational destinations,
charging points are valued positively.
Entrepreneurs in recreation and tourism and the bicycle industry have already
placed thousands of charging points at cafés, restaurants and shops. If we take
this into account, together with the fact that more bicycles have batteries that can be
removed from the bike, charged anywhere and the achievements of batteries are growing,
the question is how necessary it is to place charging points as a municipality.
Sources
Algemeen Dagblad. (2013, December 3). Dieven azen op elektrische fietsen. Last retrieved January 2014,
from Algemeen Dagblad: http://www.ad.nl/ad/nl/1100/Consument/article/detail/3555517/2013/12/03/
Dieven-azen-op-elektrische-fietsen.dhtml
Centrum Fietsdiefstal. (2013, December 3). Diefstal e-bikes flink toegenomen. Last retrieved January 2014,
from Centrum Fietsdiefstal: http://www.centrumfietsdiefstal.nl/nieuws/2013/031213_diefstal-e-bikes-flink-
toegenomen#.Us_qZeB92xG
Fietsberaad. (2013, May). Feiten over de elektrische fiets. Publication 24, version 1.
De Graaf P. (1999). Nieuwe ‘fietssnelweg’ krijgt automaten met plaksetjes. Last retrieved January 2014,
from Volkskrant: http://www.volkskrant.nl/vk/nl/2664/Nieuws/archief/article/detail/533133/1999/11/02/
Nieuwe-fietssnelweg-krijgt-automaten-met-plaksetjes.dhtml
Hendrik R. (2013). Zo realiseer je een snelle fietsroute. In Fietsverkeer 33, pp.14-19, Fiestberaad.
Morsink P., de Waard D., and Bakker K. (2013). Het Vergevingsgezinde Fietspad – Op weg naar Duurzaam
Veilige fietsinfrastructuur. Nationaal Verkeerskunde Congres.
287 PROmOTIOn Of E-bIkEs
In ThE nEThERlanD
The bicycle industry and several public authorities have reasons to
promote the e-bike for certain target groups in the Netherlands. The
industry needs the promotion to sell their products.
Public authorities see that the e-bike can potentially replace
car trips up to 15 or 20km, which could mean less need for
investments in car infrastructure.
THe bICyCLe INdusTry
The first groups that were targeted by the bicycle industry for the sales
of e-bikes were the elderly and physically handicapped people. For
the physically handicapped the extra support from the battery of the
e-bike is a welcome support, and it seems that it was widely accepted
from the beginning of the development of the e-bike that this vehicle
was suitable for this target group. This was not immediately the case
for many of the elderly that ride e-bikes nowadays. A lot of effort has
been put into making the image of the e-bike more attractive. An
important step in this process was the fact that from 2007 onwards
the e-bike was seen as equal to a regular bicycle, not needing a
special insurance. Until then an e-bike was treated as a moped and
its insurance was hence set to a similar cost to that of a moped. In
the meantime, the battery of the e-bike became more and more
‘hidden’ in the frame of the bicycle, and it therefore became less
clear whether a person was riding a conventional bicycle or an
e-bike. from that moment onwards the sales of e-bikes started
to grow at an ever-increasing rate.
29The next target group is commuters. Over the last years the idea that commuters can
substitute e-bike trips to car trips has become more accepted. The industry co-operated
with non-profit organizations and the public sector. In many cases they provided test
bicycles for pilot projects and promotion campaigns. In their advertisements, websites
and catalogues, the commuter group is well represented.
The newest target group for the bicycle industry is youngsters. In some (rural and
suburban) areas the scooter and moped are popular amongst 16-18 year old youngsters.
The idea is that the e-bike and e-scooter can replace the scooters and mopeds
these youngsters ride. Moreover, for the youngsters that are younger, some assistance
from a battery in windy situations would be much appreciated. For their trips to secondary
school (age 12+) some youngsters make trips up to 15, and even 20km one way, daily.
It is not clear yet what specific activities the industry will undertake to reach out to this
target group.
PubLIC auTHOrITIes
Since 2008 /2009 there is a growing number of public
authorities that facilitate employers to promote the
e-bike amongst employees. In general the reasoning
behind these mobility management measures is
that it is more cost efficient, environmentally
friendly and healthy to stimulate car users to
start using the e-bike for their commute of 5
to 15km, compared to the investments that
would be needed if roads had to be widened to
overcome and avoid traffic congestion. This fits
within the current Dutch approach to first fully use
the infrastructure that is already available, before
building new roads.
30One of the first of these mobility management e-bike projects started up in the city of rotterdam and
was called “e-fiets: proberen is overtuigen” - “e-bike: trying is convincing” (later turned into the name
“electric fantastic”). The aim of the project was to disseminate the use of the e-bike amongst employees
of large companies in rotterdam. employees of the nine participating companies could hire an e-bike
for free for an entire week (from Monday to Monday) so that they can test it for their commute. The
employees had to fill in a questionnaire before and after the trial period, which made it possible to get
more insight about the potential of the e-bike for commuting trips.
In august 2009, 279 people had tried the e-bike, of whom 125 filled in the evaluation form. a few of the
results of this pilot project are presented here below:
• The usual modal split of the “e-bikers” was: 37% by car; 29% by bike; 22% by public transport; and
12% use a mix of modes.
• On average the e-bike has been evaluated very well with an average grade of over 4 out of 5.
• 49% of the users thought that the e-bike is worth its price and 39% would be willing to pay for it.
• 74% of the participants considered the e-bike a suitable transport mode for their commuting trip.
• People’s main reason to not consider the e-bike a suitable means of transportation for their commute
were: the commuting distance being too high (38%); the preference for the conventional bicycle
(22%); the technical limitations of the bicycle (15%) such as a low battery range and insufficient pedal
assistance.
• The average commuting radius increased from 9.2km to 13km.
• 60% of the car users thought that the e-bike could fulfill their commuting trip. Their typical commute
distance is 9 to 19km.
• 36% of the participants stated that they were planning to buy an e-bike in the near future. If they were
not going to buy one it was mainly because of the high price.
In 2011 the City of Heerlen (in the ‘hilly’ south of the Netherlands), together with local
bicycle shops, financially supported its 60+ year-old inhabitants who wanted to buy
an e-bike. A group of selected bicycle shopkeepers gave a € 200 reduction on the price
of an e-bike and the municipality doubled this reduction with another € 200. They had a
budget of € 100,000. Reasons for this measure were Co2 reduction and, as a health
prevention measure, supporting elderly who want to keep on cycling or want to
pick up cycling again.
31Finally, a recent study looked at the cost effectiveness of two similar e-bike commuting
campaigns by weighing the costs of the campaign against different types of effects. The
conclusion was that these measures are very cost effective:
The costs of the campaigns are 5 to 8 eurocents per kilometer, compared to structural
subsidy on public transport being 22 eurocents per kilometer.
The costs of the campaigns per car kilometer are 6 to 10 eurocents. But it is not sure
to what extend the reduction of car trips takes place during peak hours and at peak
locations.
The costs of the campaigns per kilogram of CO2 emission saved are 38 to 62 eurocents.
This is high compared to the price in the international trade in emissions.
The cost of the campaign per car parking spot is € 540 to € 760. The cost effectiveness
for this type of effect depends on how much pressure there is on car parking spots in the
area where car trips are replaced by e-bike trips. In case of a shortage of parking space,
this type of effect alone is enough to make the whole campaign cost-effective. The yearly
cost of a car parking spot is around € 950 per car commuter, with a range between € 108
up to € 2,503.
Sources
Fietsberaad. (2013, May). Feiten over de elektrische fiets. Publication 24, version 1.
Gemeente Heerlen. (2011, February). Subsidie elektrische fiets. Last retrieved
January 2014, from Gemeente Heerlen: http://www.heerlen.nl/Pub/Home/Home-
Nieuwsberichten/Home-Nieuwsberichten-Stadsplanning/nieuwsberichten-SP-2011/
Subsidie-elektrische-fiets.html
Mingardo G. (2009, December 10). Electric-Bike as alternative to car use: evidence
from a pilot project in Rotterdam. In proceeding of: POLIS Conference, December
2009, Brussels, Belgium. Last retrieved January 2014, from Polis Network: http://www.
polisnetwork.eu/uploads/Modules/PublicDocuments/electric_bike_in_rotterdam.pdf
Rabobank. (2013). Rabobank in cijfers en trends – Branche-informatie –
Tweewielerspeciaalzaken (Automotive). Last retrieved January 2014, from Rabobank
Cijfers en Trends: https://www.rabobankcijfersentrends.nl/index.cfm?action=print.
printPdf&id=6dd8fb72-c91e-4aa4-a524-06cc2bf41e20
328 Thoughts on innovations
in the mobility industry
Safer e-bikes
The bicycle industry and a group of ten interest groups in
the Netherlands are paying close attention to the safety of
the e-bike and it’s use. They work on several improvements
such as a lower entry level of the bicycle, a better image
for mirrors on the e-bike (lessen the taboo), the reduction
of the weight of the e-bike and having the weight as low
as possible in order to improve balance and a more subtle
support (like up to 18km/hr). Also attention is being paid to
the possibilities of tricycle e-bikes, which should be more
interesting for people with balancing problems.
A bicycle, a moped or a car?
There is a growing number of vehicles on the market that fit
somewhere between a conventional bicycle and a moped or
a car. The Beerbike in Amsterdam caused problems in traffic
because of its big format and slow speed in the streets; this
vehicle is now banned from the streets in Amsterdam. For other
vehicles the worries tend to be focussed around the high speed,
causing more speed differences, hence more overtaking for
which enough width is needed. Again leading to the question
what the right guidelines for separated bicycle infrastructure are.
Over time, it seems that the bicycle, originally meant to go from point A to point B in a cheap way, has
developed to meet various needs, such as delivery of goods (capacity), speed (efficiency) and comfort
(power), as seen in the figures above. One can see that the latest ideas and developments, such as the
e-taxi and the e-velomobile, are aiming at meeting those three human needs: moving people and
goods in an comfortable and efficient manner.
33ITs anD ICT In TRansPORTaTIOn
In the years to come a growing number of intelligent transport
systems (ITS) and information and communication technologies
(ICT) developments will take place in the field of traffic, transport and
mobility. Nowadays we already see a variety of systems like traffic
management systems, route planners, speed adaptation, counters etc.
Generally speaking, these applications are developed for motorised
traffic. These vehicles increasingly communicate with each other and
with the infrastructure, or they use online information, with the aim to
make traffic safer and more convenient. The EU project SAFECYCLE
researched the possible contribution of ITS to improving safety for
cyclists, which included e-cyclists. One of the findings of the project
was, that (e-)cyclists (as well as pedestrians) are not a self-evident part
of the conversations that increasingly take place between participating
vehicles in traffic. our cars, trucks and buses become smarter, as
well as our infrastructure. but up to now (e-)cyclists, bicycles and
pedestrians are not a part of the conversation.
With the growing use of e-bikes and other smart techniques that can
be attached to conventional bicycles, there are more possibilities to
start to include the (e-)bicycle in this ITS conversation.
POllUTIOn EaTIng bIkE
Another new concept with e-bikes is the idea to develop an e-bike
that is not only cleaner for the environment than a car, but is even
used as a machine to clean polluted air. This example from Lightfrog
creative studio in Bangkok has a handlebar-mounted air filter and a
photosynthesis system that can generating oxygen with its lithium-
ion battery, which powers the e-bike, as seen in the picture below.
This type of technology could potentially zero the negative effects of
charging the battery.
sOURCEs
Brownstone S. (2013, December 10). Purify the air as you ride, with this photosynthesis bike. Last retrieved
January 2014, from Fastcoexist: http://www.fastcoexist.com/3023176/purify-the-air-as-you-ride-with-this-
photosynthesis-bike
Diepens J. (2013). Let’s talk about IT – Cycling cities facilitate cyclists and bicycles to join the conversation.
In proceeding of: Velo-city 2013 Conference, 11-14 June 2013, Vienna, Austria.
Markham D. (2013, December 10). Air-purifying bicycle concept eats pollution, generates oxygen. Last
retrieved January 2014, from Treehugger: http://www.treehugger.com/clean-technology/air-purifylng-
bicycle-concept-eats-pollution-generates-oxygen.html
Cox P. (2013). A diversity of Machines. In proceeding of: Velo-city 2013 Conference, 11-14 June 2013,
Vienna, Austria.
349 Recommendations
In this report we answered a variety of questions around the use of the e-bike compared to
the use of a conventional bicycle. Answers in the domain of health prevention, environmental
impacts and infrastructural challenges are mainly based on studies from the Netherlands.
Over there it is now obvious that the e-bike is meant to stay and not only for a small
group of elderly and disabled people. It is there and will be increasingly popular for
a growing number of people who like to ride bicycles. Batteries get smaller in size, but
longer lasting, making the e-bike more attractive. E-bike models can be found in different
styles and shapes, suiting a variety of people. All of this means that we have to rethink our
image of what the bicycle is, what the health and environmental benefits are and what
types of infrastructure are needed to facilitate this trend. The good news is that the e-bike
also offers new opportunities, as seen in the examples from the Netherlands. It is a serious
alternative for the car, making it an instrument in mobility management. And it generates extra
bike trips, especially amongst elderly for whom it is healthy to stay active.
What would happen if the region of Copenhagen embraced the e-bike? What number
of trips up to 20 km by car could potentially be substituted by e-bike trips? And what could be
a fast route to reach that result? What partners would be needed; how can the bicycle industry
get more involved; what is needed to make an e-bike a serious alternative for longer commute
trips in the region? How can the public opinion be influenced positively? We recommend the
Region to conduct a market and feasibility study, specifically aimed at the region, to answer
these questions. And the development of a strategy based upon that, so that the e-bike
optimally contributes to the cycling policy goals and ambitions of the Region.
35You can also read