Electron beam studies of light collection in a scintillating counter with embedded wavelength-shifting fibers
←
→
Page content transcription
If your browser does not render page correctly, please read the page content below
Electron beam studies of light collection
                                                                         in a scintillating counter
                                                                 with embedded wavelength-shifting fibers

                                                    M. Laußa,1 , P. Achenbacha,b,c,∗, S. Aulenbachera , M. Balld , I. Beltschikowa ,
arXiv:2101.06122v2 [physics.ins-det] 25 Jan 2021

                                                        M. Birotha , P. Brande , S. Caiazzaa , M. Christmanna,b , O. Corella ,
                                                     A. Deniga,b,c , L. Doriaa,c , P. Drexlera , J. Geimera , P. Gülkera , M. Kohlf ,
                                                      T. Kolarg , W. Lautha , M. Litticha , M. Lupbergeri , S. Lunkenheimera ,
                                                       D. Markusa , M. Mauchb , H. Merkela,c , M. Mihovilovičg,h , J. Müllera ,
                                                        B. S. Schlimmea , C. Sfientia,c , S. Šircag,h , S. Stengela , C. Szyszkaa ,
                                                                     S. Vestricke , for the MAGIX Collaboration
                                                       a Institut    für Kernphysik, Johannes Gutenberg-Universität, 55099 Mainz, Germany
                                                   b Helmholtz    Institute Mainz, GSI Helmholtzzentrum für Schwerionenforschung, Darmstadt,
                                                                          Johannes Gutenberg-Universität, 55099 Mainz, Germany
                                                   c PRISMA+ Cluster of Excellence, Johannes Gutenberg-Universität, 55099 Mainz, Germany
                                                                       d Helmholtz-Institut für Strahlen- und Kernphysik, Rheinische

                                                                       Friedrich-Wilhelms-Universität Bonn, 53115 Bonn, Germany
                                                       e Institut für Kernphysik, Westfälische Wilhelms-Universität Münster, 48149 Münster,

                                                                                                    Germany
                                                            f Department of Physics, Hampton University, Hampton, Virginia 23668, USA
                                                                              g Jožef Stefan Institute, 1000 Ljubljana, Slovenia
                                                      h Faculty of Mathematics and Physics, University of Ljubljana, 1000 Ljubljana, Slovenia
                                                   i Physikalisches Institut, Rheinische Friedrich-Wilhelms-Universität, 53115 Bonn, Germany

                                                   Abstract

                                                   The light collection of several wavelength-shifting fiber configurations embed-
                                                   ded in a box-shaped plastic scintillating counter was studied by scanning with
                                                   minimum ionizing electrons. The light was read out by silicon photomultipliers
                                                   at both ends. The light yield produced by the 855-MeV beam of the Mainz Mi-
                                                   crotron showed a strong dependence on the transverse distance from its position
                                                   to the fibers. The observations were modeled by attributing the total light yield
                                                   to the collection of diffuse light inside the counter and of direct light reaching
                                                   a fiber. The light collection with fibers was compared to that of a scintillating

                                                      ∗ Corresponding author at: Institut für Kernphysik, Johannes Gutenberg-Universität,

                                                   55099 Mainz, Germany.
                                                        Email address: achenbach@uni-mainz.de (P. Achenbach)
                                                      1 Part of master thesis.

                                                   Preprint submitted to Nucl. Instrum. Methods Phys. Res. A                  January 27, 2021
counter without fibers. These studies were carried out within the development
of plastic scintillating detectors as an active veto system for the DarkMESA
electron beam-dump experiment that will search for light dark matter particles
in the MeV mass range.
Keywords: Plastic scintillating counter, Wavelength-shifting fiber, Light
yield, Silicon photomultiplier (SiPM), Electron beam tests
1. Introduction
The Johannes Gutenberg University Mainz is currently constructing the new
continuous-wave multi-turn electron linac MESA (Mainz Energy Recovering Su-
perconducting Accelerator) on the Gutenberg Campus [1]. For the DarkMESA
experiment, the high-power beam dump of the accelerator will be used as a
target for the possible production of dark sector particles in the MeV mass
range [2, 3]. Once discovered, these could provide information on the structure
of dark matter, which makes up a large proportion of our universe [4].
The detector concept of the DarkMESA experiment will implement electro-
magnetic calorimeters surrounded by active veto counters. These calorimeters
will detect the transferred energy in elastic scattering of the dark sector par-
ticles off atomic-shell electrons [5], where the energy range is defined by the
150 MeV energy of the electron beam. The detector site will be heavily shielded
from the beam so that practically all beam-related Standard Model particles
will be blocked. It will be crucial for this experiment that cosmogenic parti-
cles leading to background events are vetoed with a high detection efficiency
and homogeneity. The planned veto detector system will consist on the order
of 80 plastic box-shaped scintillating counters each of 2 cm thickness and ap-
proximately 5000 cm2 in area, arranged in two layers, and read out by silicon
photomultipliers (SiPMs), the latter possibly connected to wavelength-shifting
(WLS) fibers for an enhanced light collection. Sheets of lead, between an in-
ner and an outer veto layer, will prevent low-energy γ-rays from reaching the
calorimeter. This design for a veto system in the search for dark matter at ac-
2celerators follows the approach of the BDX Experiment at the Thomas Jefferson
National Accelerator Facility (JLab) in the USA [6, 7].
This paper describes studies of prototype counters for the DarkMESA veto
system in the 855-MeV electron beam of the Mainz Microtron (MAMI). A scin-
tillation counter, in which different configurations of fibers were embedded, is
described in Section 2, the electron beam tests are presented in Section 3, the
light collection is discussed and modeled as a function of the transverse distance
from the beam position to the fibers in Section 4, and the conclusions are given
in Section 5.
2. Description of the scintillation counters
50 mm 100 mm 150 mm 200 mm
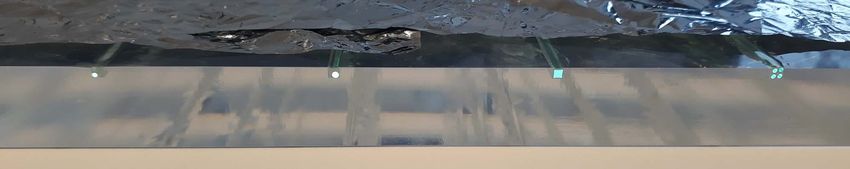
Figure 1: Photograph of one of the two polished read-out ends of the studied scintillation
counter with WLS fibers. Configurations from left to right: round fiber of 1-mm diameter,
round fiber of 1.5-mm diameter, square fiber of 2-mm edge length, 2 × 2 matrix of four round
fibers of 1-mm diameter each.
Two identical scintillation counters of type EJ-200 from Eljen Technology [8]
with dimensions of 50 × 25 × 2 cm3 were studied. The opposite ends of the
counters were each read out by four independent 6 × 6 mm2 SiPMs of type J-
Series 60035 from SensL [9]. Parallel grooves of 2.5 × 2.5 mm2 cross section
were milled into the surface of one counter, so that fibers could be placed into
these grooves, which were then filled with optical cement of type EJ-500 from
Eljen Technology. The protruding ends of the fibers were cut off and the two
readout sides of the counter were polished. Four different fiber configurations
were realized:
Ch0 Round fiber of 1-mm diameter of type BCF-92 from Saint Gobain Crys-
3e- SiPMs
Wavelength-shifting fiber
Photons trapped by
total reflection
γ
γ
γ
Photons reflected
at boundary
Readout board with SiPMs
Photons leaving scintillator
Figure 2: Schematic view of how a WLS fiber is influencing the collection of scintillation light
that is produced by a minimum ionizing electron beam penetrating the active volume of a
counter. The scintillation counters in this study had dimensions of 50 × 25 × 2 cm3 . The light
was read out using four SiPMs mounted on a readout board on each of the two opposing ends.
tals [10]
Ch1 Round fiber of 1.5-mm diameter of type Y-11 (200) MJ from Kuraray [11]
Ch2 Square fiber of 2-mm edge length of type BCF-20 from Saint Gobain
Crystals [10]
Ch3 2 × 2 matrix of four round fibers, bundled together, of 1-mm diameter of
type BCF-92 from Saint Gobain Crystals [10]
A photograph of one of the finished read-out ends with the fibers can be seen
in Fig. 1. A schematic view of the readout concept for the scintillation light
is presented in Fig. 2. The readout board with the SiPMs and the front-end
electronics are shown in Fig. 3. These boards were pushed onto the ends of
the scintillation counters by a mechanical support. Optical grease was used to
ensure optimal coupling of the SiPMs with these end. To increase the collection
of light, the scintillation counter was wrapped with aluminum-coated Mylar foil.
4SiPM SiPM SiPM SiPM
(a) Top layer
PreAmp OpAmp DAC
(b) Bottom layer
SiPM
DAC
PreAmp
OpAmp
(c) Electronic circuit diagram
Figure 3: Photographs of the top and bottom layer of the readout board and the electronic
circuit diagram. The board has a cross section of 1 × 25 cm2 . (a) Top layer. Four SiPMs with
6 × 6 mm2 active area, connected with the fast output. (b) Bottom layer. PreAmp (one per
SiPM): Signal preamplifier based on the gain block AD8354 with a transimpedance gain of
Z = 500 Ω and high analog bandwidth; OpAmp (one per SiPM): Non-inverting high-voltage
operational amplifier circuit with current-limiting resistor for generating the bias voltage from
an adjustable reference voltage; DAC (one per board): Digital-to-analog converter for setting
the individual values for the reference voltages and thus the bias voltages. (c) Electronic
circuit diagram.
5Left side SiPMs
250
225 mm 1 mm
200 Ch3
L3 Ø 1 mm × 4
150 Ch2
L2 □ 2 mm
100 Ch1
L1 Ø 1.5 mm
50 Ch0
L0 Ø 1 mm
0
[mm]
Figure 4: Schematic view of the electron beam positions (black crosses) on the 250-mm wide
scintillation counter with fibers separated by 50 mm. Near each fiber nine positions with a
pitch interval of 1 mm were scanned at a distance of 225 mm from the read-out side. The two
dashed, perpendicular lines indicate the symmetry axes of the counter. The SiPMs of the four
channels Ch0 to Ch3 at the left side are labeled L0 to L3 . On the right, the relative scanning
positions with respect to the fiber are shown in the enlarged view.
Left side SiPMs Right side SiPMs
250
225
Ch3 L3 R3
Ch2 L2 R2
125
Ch1 L1 R1
Ch0 L0 R0
25
0
[mm]
0 mm 500 mm
Figure 5: Schematic view of the electron beam positions (black crosses) on the 250-mm wide
scintillation counter without fibers for the reference measurements. Three positions with a
pitch interval of 100 mm were scanned at a distance of 225 mm from the read-out side. Seven
additional measurements were taken along the central longitudinal axis. The two dashed,
perpendicular lines indicate the symmetry axes of the counter. The SiPMs of the four channels
Ch0 to Ch3 at the left and the right side are labeled L0 to L3 , respectively R0 to R3 .
63. Electron beam tests of the scintillation counters
In separate beam tests, electrons of 855 MeV energy from the Mainz Mi-
crotron MAMI were precisely pointed to a set of positions on the top of one of
the scintillation counters. The detector was placed in a dark box to shield it
from external light sources and the whole setup was supported by a remotely
steerable x-y table. The beam position relative to the counter was determined by
a small, separate scintillation detector located in the center position. To study
the light collection of the different configurations as a function of the transverse
distance from the electron beam to a fiber, a scan parallel to the read-out side
of the counter was performed as depicted in Fig. 4. For reference, corresponding
measurements were performed with the scintillation counter without embedded
fibers. Three positions of the electron beam at the same distance from the
read-out side were scanned as seen in Fig. 5.
All SiPMs were operated at a bias voltage of Vbias = 27.5 V. For this type
of SiPM, this value corresponds to an overvoltage of VOV ∼ 3 V. The signals of
the SiPMs were analyzed by a charge-sensitive ADC of type 2249A from LeCroy
with a sensitivity of 0.25 pC per ADC channel. The trigger signal for the data
acquisition was realized by forming the analog sum of the non-amplified signals
from all the SiPM channels. The ADC pedestals in the charge spectra were
determined in separate measurements.
4. Analysis and modeling of the light yield
4.1. Calibration of the charge spectra
To convert the ADC values into the light yield expressed as an absolute
number of photoelectrons (pe), each SiPM was exposed to short LED light
pulses, which statistically guaranteed a Poisson distributed number of photons
per pulse which was sufficiently large to be in the Gaussian limit. Consequently,
the resulting charge spectra showed symmetric peaks. If one assumes that the
width of such a peak is caused by statistical fluctuations only, it follows that
7√ √
σ/n̂ = λ/λ = 1/ λ , where n̂ is representing the position of the peak max-
imum, σ the peak width, and λ being the mean and variance of the Poisson
distribution for the number of pe, i.e. the light yield. Including the subtraction
of the measured pedestals in the charge spectra leads to the relation:
q
2
σ 2 − σped 1
=√ , (1)
n̂ − n̂ped λ
where n̂ped and σped are the position and width of a fit to the pedestal peak
with a Gaussian distribution.
The conversion factors ci of calibrated ADC channels (#Ch) per pe were
determined for each SiPM at Vbias = 27.5 V from the calibrated peak positions
n̂calib = (n̂ − n̂ped ) · κi . The damping factors κi needed to be included for each
one of the eight SiPMs to account for signal losses through the cable pathways.
They were determined by sending a well-defined amount of charge in pulses of a
high precision frequency generator of type 81160A from Keysights Technologies
through the signal pathways to the ADC. Finally, the mean number of pe from
the charge spectra of interest is given by λ = (n̂peak − n̂ped ) · κi /ci .
Figure 6 shows a typical ADC spectrum of a single SiPM, recorded when the
scintillation light was produced by the electron beam penetrating the counter.
The observed asymmetric peak shape was similar in both the fiber and the
reference measurements. It could be explained by an asymmetric energy-loss
distribution, or by signal pile-up with dark counts and afterpulses, especially as
the probability for afterpulses in SiPMs increases with intensity. The peak could
be well described by a modified Gaussian distribution whose width parameter
σ increased linearly above the maximum position n̂.
4.2. Reference light yield from a counter without fibers
For a counter without fibers, the measured light yield was approximately
constant for beam positions along the transverse axis: the four inner SiPMs
(Ch1 and Ch2, left and right) showed a variation of less than 1 %, while the
four outer SiPMs (Ch0 and Ch3, left and right) showed a decrease or increase of
not more than 3 %. The mean value of λref = (24.7 ± 0.3) pe was then used as a
8χ2 / ndf 1263 / 308
Number of Events
2500 2500
Area Σ 9.476e+04 ± 3.032e+02
Position n 72 ± 0.1
2000
2000 Width σ0 14.57 ± 0.05
Number of Events
1500
s-Param 0.2004 ± 0.0007
1500 dn
1000
1000 500
500 0
0 50 100 150 200 250
Charge [#Ch]
0
0 50 100 150 200 250
Charge [#Ch]
Figure 6: Typical asymmetric ADC spectrum (#Ch =
b 0.25 pC) for a single SiPM recorded
when the minimum ionizing electron beam penetrated the counter in a distance of 225 mm
from the read-out side. A scintillation counter without embedded fibers was used and the light
yield was λ ' 25 p e . The peak could be well described by a modified Gaussian distribution
whose width parameter σ increased linearly above the maximum position n̂.
reference value for the light yield from such a counter. These observations could
be explained by light being produced in a thin counter that will get distributed
almost homogeneously over the volume due to the many internal reflections.
The observations also motivate the following expectation for the counter with
fibers: A fiber collects some of this diffuse light, so that one contribution to the
light yield from a fiber should be a constant or varying only slowly with respect
to the transverse direction.
The attenuation of the light along the central longitudinal axis was deter-
mined by the eight measurements indicated in Fig. 5. For beam positions at
distances of more than 20 cm from the read-out side, no significant difference
between the four channels of either side was found. The observed attenua-
tion was less than 5 %/cm, being consistent with the light attenuation length
Λatt = 260 cm provided by the manufacturer of the scintillating material [8].
950 L0
L1
(
(
1mm)
1.5mm)
L2 ( 2mm)
45 L3 ( 1mm × 4)
Mean intensity [pe] 40
Wide-range distrib.
35
30
25
20
15
0 50 100 150 200 250
Beam position on vertical axis [mm]
(a) Left end SiPMs
50 R0
R1
(
(
1mm)
1.5mm)
R2 ( 2mm)
45 R3 ( 1mm × 4)
Mean intensity [pe]
Wide-range distrib.
40
35
30
25
20
15
0 50 100 150 200 250
Beam position on vertical axis [mm]
(b) Right end SiPMs
Figure 7: Mean intensity in units of pe for each SiPM connected to a fiber as a function
of the transverse position of the beam. The light yield was reduced by approximately 10 %
when the beam was located at the grooves in the scintillation counter and was increased by
approximately 20 to 40 % when the beam was located close to a fiber. The curves show the
model description for the light yield (full line), that includes a wide distribution (dashed line).
(a) Left end SiPMs. (b) Right end SiPMs.
104.3. Light yield from a counter with fibers
Figure 7 shows the light yield from a counter with fibers as a function of the
transverse position of the beam. The uncertainties include the statistical errors
and a 2 % systematic uncertainty from the fitting and calibration procedures.
For all channels, the mean intensity across the whole transverse width of the
counter showed a broad peak on top of a wide distribution, with the maximum
position of the peak at the respective fiber position. As each fiber was placed
in a groove of 2.5 mm depth, the reduced thickness of the scintillating material
implied a local decrease in scintillation light at these positions. In case of the
square fiber, a scintillation of the fiber was observed for direct electron beam
exposure.
To model these observations, different descriptions of the wide distribution,
the broad peak, and the local structure at the fiber positions were tested. It
was found, that the wide distribution for the central SiPM positions was best
described by a small increase when approaching the sides of the counter to
accommodate for reflected light, while a constant was sufficient for the outer
SiPMs. For the broad peaks, a Gaussian and a Lorentz distribution were tested.
To describe the local structures at the fiber positions, a sinc function, the second
derivative of a Gaussian function, and a Gaussian function were tested.
The best simultaneous fit to all data points from one SiPM was found with
a linear combination of the wide distribution, four Gaussian distributions at the
four grooves, and one Gaussian distribution for the broad peak. This model
resulted in a statistically acceptable χ2 for a reasonably low number of fitted
parameters, except for the 1-mm fiber. The best parameter values and the
χ2 /n.d .f . as a goodness of the fit are listed in Table 1, where the number of
degrees of freedom (n.d.f. = 21) equals the number of scanned beam positions
minus the number of fitted parameters. The nominal position of each fiber was
determined by taking the mean value of all eight extremal positions from both
ends, left and right, of the counter.
Within the context of the model, the light yield of the counter with fibers
can be interpreted as composed of two contributions:
11Table 1: Mean intensities from the model description for each pair of SiPMs from the left and
the right side connected to a fiber in comparison with the reference value from the counter
without fibers. Within the context of the model, the far intensity quantifies the collection
of diffuse light and the peak intensity quantifies the direct light reaching a fiber. The near
intensity is the sum of these two contributions and thereby is a measure of the light yield
when light is being produced in closest proximity of a fiber position.
Channel Far (pe) Peak (pe) Near (pe) χ2 /n.d.f.
Left Right
Ch0 (∅ 1 mm) 18.2 ± 0.5 4.3 ± 0.8 22.5 ± 0.9 2.3 2.0
Ch1 (∅ 1.5 mm) 31.4 ± 1.1 10.9 ± 0.2 42.3 ± 1.1 1.0 1.1
Ch2 ( 2 mm) 22.3 ± 1.0 7.1 ± 0.1 29.4 ± 1.0 1.3 1.4
Ch3 (∅ 1 mm × 4) 21.8 ± 1.0 9.9 ± 0.8 31.7 ± 1.3 1.3 1.6
Reference (no fibers) 24.7 ± 0.3 corrected: 21.6 ± 0.3
1. One contribution to the collected light has a very weak dependence on its
point of origin.
2. Another contribution to the collected light has a strong and peaking de-
pendence on its point of origin.
The first contribution could be explained in analogy to the case of the counter
without fibers. A fiber collects a certain fraction of the diffuse light, so that
this contribution to the light yield would stay approximately constant along the
transverse length of the counter for each SiPM. The second contribution could
be explained by light directly emitted into the solid angle covered by a fiber.
This contribution increases as the position of the light production gets closer to
the fiber.
As can be seen from the comparison in Table 2, the fiber with a diameter
of 1.5 mm was improving the collection of diffuse light, whereas the other fibers
had a negative impact on the light collection when the light was produced at a
distance of 10 cm or more from the respective fiber. Although the square fiber
had an edge length of 2 mm, it did not perform as well as the 1.5-mm fiber. The
12Table 2: Contrast and relative intensity differences between the scintillation counter with
fibers and the reference counter without fibers, when the correction for missing scintillating
material was taken into account. The far and peak intensities are explained in the text. The
contrast is defined as peak intensity divided by far intensity.
Channel Contrast (%) ∆ Far (%) ∆ Peak (%)
Ch0 (∅ 1 mm) 24 ± 4 −26 ± 2 4±6
Ch1 (∅ 1.5 mm) 35 ± 2 27 ± 5 96 ± 7
Ch2 ( 2 mm) 32 ± 2 −10 ± 4 36 ± 5
Ch3 (∅ 1 mm × 4) 45 ± 4 −12 ± 4 47 ± 8
light yield increased when the light was produced successively closer to each
respective fiber and at the closest proximity it surpassed the light yield of the
reference counter without fibers. To compare the maximum possible light yield
of a fiber configuration with the reference measurement, the missing scintillating
material in the groove needed to be taken into account. Therefore, the reference
light yield was corrected by the factor (20 − 2.5)/20 mm/mm ≈ 88 %, yielding
λref = (21.6 ± 0.3) pe, see last line in Table 1. The relative difference was largest
for the 1.5-mm fiber reaching almost 100 %, whereas for the 1-mm fiber, the light
yield did not increase significantly.
An increase in light yield by using WLS fibers always comes at the expense
of the homogeneity of light collection in varying the transverse distance from
the point of origin to the fibers when the light production is located in sufficient
distance from the read-out side. This contrast was quantified by the additional
light collected from an origin near the fiber with respect to an origin far from
the fiber. It was found to be in the range 24 to 45 %.
5. Conclusions
In nuclear and particle physics it is well known that the combination of WLS
fibers with a SiPM readout is a viable option for the operation of a scintillation
13counter [12, 13]. This work has shown that, e.g., a WLS fiber with a round
geometry and a diameter of 1.5 mm significantly increases the light yield from a
box-shaped counter of 2 cm thickness. Conversely, fibers with smaller diameters
can be detrimental to the light yield. Such configurations cannot compensate
for the missing scintillation material in the groove. Furthermore, a bundle of
thin fibers was shown to be inferior to a single fiber with a larger diameter.
These observations were modeled by attributing the total light yield to the sum
of two contributions: the collection of diffuse light inside the counter and of
direct light reaching a fiber.
The high contrast in WLS fiber configurations, i.e., a strong dependence of
the light yield on the point of origin of the scintillation light, leads to complica-
tions in the interpretation of the SiPM output signals. For the BDX Experiment
at JLab, a detailed description of the counter geometry and the photoelectron
response needed to be implemented in a simulation framework to account for
these complications [7]. On the other hand, the position sensitivity could have a
positive effect, for instance to determine the position within the scintillator with
an increased resolution when considering signal intensities of multiple SiPMs.
To avoid the high contrast and other issues that surround WLS fiber con-
figurations, the planned veto counters for the DarkMESA experiment will be
constructed without embedded fibers. The design of the readout board was
optimized for this application and incorporates now nine instead of four SiPMs,
thereby increasing the total light yield, improving the uniformity at the read-out
ends, and retaining the relative ease of construction of the veto system.
14CRediT authorship contribution statement
M. Lauß: Conceptualization, Formal analysis, Investigation, Methodology,
Review & Editing, Software, Visualization, Writing – Original Draft. P. Achen-
bach: Conceptualization, Formal analysis, Funding acquisition, Investigation,
Methodology, Project administration, Review & Editing, Supervision, Writ-
ing – Original Draft. S. Aulenbacher: Review & Editing. M. Ball: Re-
view & Editing. I. Beltschikow: Investigation, Review & Editing, Software.
M. Biroth: Conceptualization, Formal analysis, Investigation, Methodology,
Review & Editing & Editing, Visualization. P. Brand: Review & Editing.
S. Caiazza: Review & Editing. M. Christmann: Conceptualization, Inves-
tigation, Methodology, Review & Editing. O. Corell: Resources, Review &
Editing. A. Denig: Funding acquisition, Project administration, Review &
Editing. L. Doria: Funding acquisition, Project administration, Review &
Editing. P. Drexler: Investigation, Review & Editing, Software. J. Geimer:
Review & Editing. P. Gülker: Investigation, Review & Editing. M. Kohl:
Review & Editing. T. Kolar: Review & Editing. W. Lauth: Conceptual-
ization, Investigation, Resources, Review & Editing. M. Littich: Review &
Editing. M. Lupberger: Review & Editing. S. Lunkenheimer: Review &
Editing. D. Markus: Review & Editing. M. Mauch: Review & Editing.
H. Merkel: Funding acquisition, Project administration, Resources, Review
& Editing. M. Mihovilovič: Review & Editing. J. Müller: Review & Edit-
ing. B. S. Schlimme: Funding acquisition, Project administration, Review &
Editing. C. Sfienti: Funding acquisition, Review & Editing. S. Širca: Review
& Editing. S. Stengel: Review & Editing. C. Szyszka: Review & Editing.
S. Vestrick: Review & Editing.
Acknowledgments
The authors would like to thank the MAMI operators, technical staff, and
the accelerator group for their excellent work. We also thank P. L. Cole for
language editing the manuscript.
15This work was supported by the PRISMA+ Cluster of Excellence “Pre-
cision Physics, Fundamental Interactions and Structure of Matter”, and by
the Helmholtz-Gemeinschaft Deutscher Forschungszentren (HGF) with a HGF-
Exzellenznetzwerk.
References
[1] F. Hug, K. Aulenbacher, R. Heine, B. Ledroit, D. Simon, MESA — an
ERL project for particle physics experiments, in: Proc. Linear Accelera-
tor Conference (LINAC2016), East Lansing, MI, USA, 25 – 30 September
2016, 2017, pp. 313–315, http://dx.doi.org/10.18429/JACoW-LINAC2016-
MOP106012.
[2] L. Doria, P. Achenbach, M. Christmann, A. Denig, P. Gülker, H. Merkel,
Search for light dark matter with the MESA accelerator, in: Proc. 13th In-
ternational Conference on the Intersection of Particle and Nuclear Physics
(CIPANP18), Palm Springs, CA, USA, 29 May – 3 June 2018, 2018,
http://arxiv.org/abs/1809.07168.
[3] L. Doria, P. Achenbach, M. Christmann, A. Denig, H. Merkel, Dark matter
at the intensity frontier: The new MESA electron accelerator facility, in:
Proc. Alpine LHC Physics Summit 2019 (ALPS 2019), Obergurgl, Austria,
22 – 27 April 2019, 2019, http://arxiv.org/abs/1908.07921.
[4] J. D. Bjorken, R. Essig, P. Schuster, N. Toro, New fixed-target experi-
ments to search for dark gauge forces, Phys. Rev. D 80 (2009) 075018,
http://dx.doi.org/10.1103/PhysRevD.80.075018.
[5] M. Christmann, P. Achenbach, S. Baunack, P. Burger, A. Denig,
L. Doria, F. Maas, H. Merkel, Instrumentation and optimiza-
tion studies for a beam dump experiment (BDX) at MESA —
DarkMESA, Nucl. Instrum. Methods Phys. Res. A (2019) 162398,
http://dx.doi.org/10.1016/j.nima.2019.162398.
16[6] M. Battaglieri et al., Dark matter search in a Beam-Dump eXper-
iment (BDX) at Jefferson Lab, Proposal to the Program Advisory
Committee 45, Thomas Jefferson National Accelerator Facility, 2018,
http://dx.doi.org/10.2172/1431583.
[7] M. Battaglieri, P. Bisio, M. Bondı́, A. Celentano, P. L. Cole, M. De
Napoli, R. De Vita, L. Marsicano, G. Ottonello, F. Parodi, N. Randazzo,
E. Smith, D. Snowden-Ifft, M. Spreafico, T. Whitlatch, M. H. Wood,
The BDX-MINI detector for Light Dark Matter search at JLab, 2020,
http://arxiv.org/abs/2011.10532.
[8] Eljen Technology, Scintillator Properties, 2020, available at
https://eljentechnology.com/products/plastic-scintillators/
ej-200-ej-204-ej-208-ej-212.
[9] SensL, J-Series Datasheet, 2020, available at http://sensl.com/
downloads/ds/DS-MicroJseries.pdf.
[10] Saint Gobain Crystals, Scintillation Products, 2020, available
at http://fixels.physics.ucsb.edu/Lgbk/pub/E41.dir/SGC_
Scintillating_Optical_Fibers_Brochure_605.pdf.
[11] Kuraray, Plastic Scintillating Fibres, 2020, available at http://
kuraraypsf.jp/pdf/all.pdf.
[12] D. Denisov, V. Evdokimov, S. Lukić, P. Ujić, Test beam studies of the
light yield, time and coordinate resolutions of scintillator strips with WLS
fibers and SiPM readout, Nucl. Instrum. Methods Phys. Res. A 848 (2017)
54–59, http://dx.doi.org/10.1016/j.nima.2016.12.043.
[13] A. Artikov, V. Baranov, G. C. Blazey, N. Chen, D. Chokheli, Y. Davydov,
E.C. Dukes, A. Dychkant, R. Ehrlich, K. Francis, M. Frank, V. Glagolev,
C. Group, S. Hansen, S. Magill, Y. Oksuzian, A. Pla-Dalmau, P. Rubinov,
A. Simonenko, E. Song, S. Stetzler, Y. Wu, S. Uzunyan, V. Zutshi, Photo-
electron yields of scintillation counters with embedded wavelength-shifting
17fibers read out with silicon photomultipliers, Nucl. Instrum. Methods Phys.
Res. A 890 (2018) 84–95, http://dx.doi.org/10.1016/j.nima.2018.02.023.
18You can also read