Eliminating avoidable plastic waste by 2042: a use-based approach to decision and policy making June 2018 Written by: Resource Futures and Nextek ...
←
→
Page content transcription
If your browser does not render page correctly, please read the page content below
Eliminating avoidable plastic waste by 2042: a use-based approach to decision and policy making June 2018 Written by: Resource Futures and Nextek
Document prepared for
Contact          Pat Jennings
Client           Resourcing the Future Partnership
Telephone        01604 823325
Email            pat.jennings@ciwm.co.uk

Document prepared by:
Consultants      Ed Cook, Emma Burlow, Edward Kosior, Bernie Thomas, Brian Riise and John Gysbers
Email            ed.cook@recourcefutures.co.uk

Document checked by:
Name             Sam Reeve & Dave Lerpiniere

Version Control
File name        3236-PlasticsHierarchy-Final SENT
Status           Confidential
Date             13 June 2018
RF project no.   3236

Acknowledgments
Resourcing the Future Partnership Steering Group
External stakeholders – see Appendix A
Plastic | Final

Executive summary
Ever increasing growth in the amount of plastics produced has outpaced society’s ability to
manage them effectively at their end-of-life. In the UK, plastic packaging, which accounts for
more than half of packaging waste, is recycled at 45% and non-packaging is thought to be
recycled at a much lower rate.

Blue Planet II coverage of plastic ocean                                      ~0.2 MT recycled
pollution started a reaction. The issue
                                                              ~1.5 MT
of discarded plastics and marine                           non-packaging
pollution is top of the political agenda
and there is increasing pressure for                                           2.45 MT missed
                                               ~3.7 MT                           opportunity
business and Government to work                 waste
together to ‘solve’ the problem.              generated

The UK Government’s recently                                  ~2.2 MT
                                                             packaging
published 25-year Environment Plan                                                      ~0.65 MT
                                                                            ~1.05 MT     Export
states its ambition to eliminate                                            recycled
avoidable plastic waste by the end of                                                   ~0.4 MT UK

2042 and the supply chain has
responded rapidly to the challenges         Figure ES 1: Estimated UK plastic waste generation
posed by waste plastic with over 80%        (see Section 2.4.1 for sources)
of supermarkets signing up to the UK
Plastics Pact. This first of a kind, voluntary agreement seeks to eliminate unnecessary single-
use packaging by 2025; make all plastic packaging recyclable, reusable or compostable;
ensure that 70% of plastic packaging is reused, recycled or composted; and 30% recycled
contestant across all packaging.
In addition, an increasing number of measures are being promoted by campaign groups,
businesses and through regulation to begin to approach the plastics issue from a range of
interventions. However, these actions are not always evidence based, the topic is highly
complex, and decisions are heavily dependent on other stages in the lifecycle as well as
regulation, global supply chains and consumer understanding.
The Resourcing the Future (RTF) partnership commissioned Resource Futures and Nextek to
research and develop a framework to assist stakeholders across the plastics value chain and
recycling sectors to move forward in a common direction for improving plastics resource
efficiency.

Resourcing the Future Partnership
Plastic | Final
The research is a rapid evolution of several An innovative method of categorisation by the
weeks of research and collaborative thinking, use phase provides a new approach to framing
involving feedback from more than 20 the discussion around resource efficiency for
external stakeholders. plastics by focussing attention on the dominant
lifecycle impacts of different materials.
This research recognises the tremendous
benefits that plastics provide and addresses some of the potential drawbacks of using
alternative materials. However, some plastics are undoubtedly causing widespread marine
pollution, and this has been the focus of the most attention from civil society in recent years.
Ultimately, there will be a trade-off between the impacts on marine and terrestrial
ecosystems; global warming; and economic and social pressures; and it is therefore important
to take a proportionate and evidence-based approach to create a more resource efficient
economy.
The UK secondary plastics sector has a critical role to play. Currently it is heavily dependent
on global export markets, but recent market shocks, such as the ban on imports of post-
consumer plastic waste by China has highlighted an opportunity to de-risk through increasing
UK capacity.
300,000
plastic exported form UK
250,000
2016
(tonnes/annum)
200,000 2017
2018 predicted
150,000
100,000
50,000
0
Figure ES 2: Plastic scrap exports from the exports from the UK1
If the aspirations of the UK Plastics Pact to achieve 70% recycling of plastic packaging by 2025
are to be achieved, then around 500,000 tonnes of additional reprocessing capacity will need
to be identified either in the UK or abroad. Given the timescales involved, capital funding will
be urgently required to invest in plastics reprocessing infrastructure. However, this
investment will be an empty gesture unless the market, and fundamentally the value of
secondary plastics, can be both increased and decoupled from the price of virgin material.
1
Based on analysis of HMRC export data (2018), https://bit.ly/1eP80tm. Note that at the time of writing, 2018 data have only been
reported for the first quarter; these were multiplied by four to predict the amount of material that will be exported to each
country in 2018. Note that ‘dispatches’ to the EU are reported here as ‘exports’ for simplicity and may be further re-exported
outside the EU.
Resourcing the Future PartnershipPlastic | Final
A new approach - use phase categorisation
Recognising that plastics are not alike is the first step, and this research has done this by
developing a new system of categorisation based on the length of time plastics are used. The
five ‘use phase categories’ used in this research (see Table ES 1) provide a new approach to
framing the discussion into resource efficiency by focussing attention on the dominant
lifecycle impacts of different materials.
Table ES 1: Summary of use-phase categories used in this research (Further detail provided in
Section 3.3 and detailed analysis is provided in Section 4.
Cat. Description Examples Dominant lifecycle impact / Action required
Cotton buds, coffee End-of-life. Terrestrial litter and marine debris is increasingly recognised
stirrers, straws, as being harmful but difficult to quantify and compare to other
Very short use confectionery environmental factors such as global warming
1 phase (Plastic | Final
The time for action is now
The use phase categories (Section 4. ) analysis was used to identify priority interventions with
the potential for maximum impact. Two common, overarching and interlinked themes were
revealed:
1. Sustainable design & production choices; and
2. Supporting and generating demand for secondary plastics.
The research shows that with the right interventions, there are significant opportunities to
address the issues arising from the widespread use and disposal of plastics. The current level
of sophistication of the existing collection infrastructure and the available sorting and
recycling technologies could create quick wins but there is a big question mark over its ability
to meet higher ambitions without further intervention and support. Importantly, demand for
recycled plastics needs to be strengthened with ‘pull’ factors that work alongside market
forces to reduce the plastic recycling sector’s vulnerability to market shocks related to oil
prices or other global market price fluctuations.
With a focus on the two overarching themes this research proposes a selection of priority
interventions which it is hoped will provide an improved sense of direction for stakeholders
across the value chain. These are summarised here and detailed in Section 6.
Priority interventions
If all packaging in UK
Generating demand for secondary plastic content (approx. 2.2 million
Increasing demand for recycled content guarantees a market for tonnes/year) used 30%
secondary production and effectively decouples the industry recycled content, then this
would be equivalent to the
from the virgin production sector.
~660,000 tonnes exported
For example, the UK Plastics Pact has already begun this process annually
by securing commitments form stakeholders that control 80% of
the packaging in the supermarket sector. If successful in achieving 30% recycled content, then
the Pact’s signatories will require in the order of 600,000 tonnes per annum of feedstock.
Extended producer responsibility
A well designed EPR scheme corrects the market failure of not considering the end-of-life
treatment option and potentially have a role across the range of use phase categories.
Recently adopted changes to the EU Waste Framework Directive provide an opportunity for
the UK government to shape an ambitious and forward-thinking agenda supporting the
development and growth of a resilient secondary plastics sector.
For some category 1, 2 and 3 items there are increasing calls for producers to pay for
terrestrial and marine litter clean-up costs. Our research suggests that interventions linked to
number of products rather than weight could be effective in recognising and correcting the
impact costs.
Resourcing the Future PartnershipPlastic | Final Sorting and separation infrastructure Increasing resource efficiency requires an increase of plastic being recycled and this will require infrastructure capacity to process. The interventions need to address the differing needs across the use phase categories incorporating packaging and non-packaging products. This requires technological innovation as well as an increase in capacity. The Government will need to work with industry to devise a range of financial instruments and mechanisms that support these dual technical requirements. Clarification and agreement on the role of bioplastics The UK Government’s 25-year plan and the UK Plastics Pact have both included compostability as an aspirational characteristic for plastics alongside recyclability. However, the implications for the resources sector of expanding their use needs urgent strategic clarification and guidance. It is important that any future role is agreed taking into account the existing collection and treatment system and other parts of the plastics recycling sector. This research has provided clarification on some of the important issues and highlights the consequences of an unplanned influx of these novel materials into the UK’s waste stream. Therefore, it is recommended that urgent research is carried out to assess the operational, economic and environmental impact of these materials and how they best support a drive for improved resource efficiency. Section 7. closes the report by highlighting areas that were not possible to cover in this research but will play an important part in developing a truly circular and resource efficient plastics sector. Resourcing the Future Partnership
Plastic | Final

Contents
Executive summary ............................................................................................................................. 1
Contents ............................................................................................................................................. 6
Glossary .............................................................................................................................................. 7
1.    Introduction .............................................................................................................................. 9
2.       Context ..................................................................................................................................... 10
2.1      Policy and other instruments ................................................................................................................10
2.2      Plastic types ...........................................................................................................................................12
2.3      Technical barriers to plastics recyclability.............................................................................................17
2.4      The secondary plastics market ..............................................................................................................19
2.5      Impacts ..................................................................................................................................................27
3.       Reframing how we think about plastics ...................................................................................... 31
3.1      Industrial sectors ...................................................................................................................................31
3.2      Lifecycle phases .....................................................................................................................................32
3.3      A new framework: Use phase categories..............................................................................................32
4.       Analysis of products by use phase .............................................................................................. 35
4.1      Cat. 1: Very short use phase (
Plastic | Final

Glossary
 Acrylonitrile-butadiene-    A thermoplastic polymer. Commonly used for printer housings, small domestic
 styrene (ABS)               appliances, automobile interiors and toys.
 Bio-derived                 Bio-based products are wholly or partly derived from materials of biological
                             origin. Commonly, the material has been highly processed.
 Biogenic                    Produced or brought about by living organisms.
 Brominated flame            A family of chemicals containing bromine that are added to products to reduce
 retardants (BFR)            their flammability.
 Cellulose Acetate (CA)      A tough thermoplastic. Attractive and with a ‘natural feel’, CA is used for
                             spectacle frames, tool and brush handles and “display packaging”.
 Ecolabel                    An ecolabel identifies products or services proven to be environmentally
                             preferable overall, within a specific product or service.
 Electrical and              Electrical items with a voltage rating not exceeding 1,000 volts for alternating
 Electronic Equipment        current and 1,500 volts for direct current.
 (EEE)
 Electronic Product          A method for purchasers, manufacturers, resellers and others wanting to find
 Environmental               or promote electronic products with positive environmental attributes.
 Assessment Tool
 (EPEAT)
 Expanded Polystyrene        A rigid cellular plastic. Applications include fish boxes, packaging for electrical
 (EPS)                       consumer goods and for insulation panels for building.
 End-of-life Vehicle (ELV)   A vehicle which is waste within the meaning of Article 1(a) of Directive
                             75/442/EEC.
 Ethylene-vinyl alcohol      A plastic resin commonly used as an oxygen barrier in food packaging and in
 copolymer (EVOH)            automobile fuel tanks.
 High density                A type of thermoplastic used for most thin gauge carrier bags, milk bottles,
 polyethylene (HDPE)         fresh produce bags and some bottles and caps.
 High Impact                 A tough, rigid plastic. Widely used for computer keyboards, television housings,
 Polystyrene (HIPS)          refrigerator liners, toys, packaging and signs.
 Low-density                 A semi-rigid, tough, low-cost plastic. Applications include squeeze bottles, toys,
 polyethylene (HDPE)         carrier bags, general packaging, gas and water pipes.
 Polyamide (PA)              A plastic made from renewable resources such as corn starch. Common
                             substitute for PET. Commonly used in plastic films and food containers.
 Polybutylene adipate        A class of biodegradable and compostable plastic. Applications include cling
 co-terephthalate            film, compost bags and nets.
 (PBAT)
 Polybutylene                A strong, stiff engineering plastic. Used for food processing machinery
 terephthalate (PBT)         applications due to its resistance to chlorine and caustic cleaning solutions.
 Polycarbonate (PC)          A group of thermoplastic polymers. Commonly used for electronic components;
                             construction materials; CDs and DVDs.
 Polylactic acid (PLA)       A plastic made of renewable resources such as corn starch or sugar cane. Used
                             as substitute for PET in packaging e.g. films and food containers.
 Polyvinyl chloride (PVC)    A thermoplastic and one of the most widely used polymers in the world.
                             Applications include pipes, cables, construction, signs and clothing.
 Post-Consumer               Plastic products made from plastic recovered after its first use as a consumer
 Recycled Plastic (PCR)      item.

Resourcing the Future Partnership
Plastic | Final
Persistent Organic Persistent organic pollutants (POPs) are hazardous organic chemical substances
Pollutants (POPs) that break down slowly and get into food chains as a result.
Poly (methyl Known as acrylic glass and by various trade names, including Plexiglas® and
methacrylate) PMMA Perspex®. A clear plastic used as a shatterproof replacement for glass.
Polyester (PET) The most common thermoplastic polymer resin of the polyester family. Used in
synthetic fibres, plastic bottles, food containers, and in engineering resins.
Polyhydroxy A class of polyesters derived from bacterial fermentation. When purified they
alkanoates (PHA) have similar properties to thermoplastics and offer biodegradability.
Polypropylene (PP) A versatile polymer used as a plastic and as a fibre. Major uses are for
packaging, automotive components and electrical equipment.
Polyurethane (PU and Polyurethanes may be thermosetting or thermoplastic, rigid and hard or
PUR) flexible and soft, solid or cellular. Over 75% of consumption is for foams.
Polyvinylidene fluoride A plastic with high purity and ability to withstand harsh chemicals. Common
(PVDF) applications include pipe, valves, batteries, and high-purity semiconductors.
Regulations: restriction RoHS, also known as Directive 2002/95/EC, restricts the use of ten hazardous
of hazardous
materials (specific heavy metals, flame retardants and plasticisers) found in
substances (RoHS)
electrical and electronic products.
Thermoplastic Blends of polypropylene, un-crosslinked rubber, and typically a filler. Used
polyolefins (TPO) where toughness is needed, such as in car bumpers and on flat rooves.
Thermoplastics Polymer substances (especially synthetic resins) that can be reheated and
reshaped many times.
Ultra-high-molecular- Offers a low friction surface, great impact strength, and wear and corrosion
weight polyethylene resistance. Common applications include screws, bushings and gears.
(UHMWPE)
Waste Electrical & EEE which the holder disposes of or is required to dispose of pursuant to the
Electronic Equipment provisions of national law in force.
(WEEE)
Single-use plastic product definitions
HM Treasury: ‘includes all products that are made wholly or partly of plastic and are typically intended
to be used just once and/or for a short period of time before being disposed of.’ 2
European Union: 'a product made wholly or partly from plastic that is not conceived, designed and
placed on the market to accomplish within its lifecycle multiple trips or rotations by being refilled or re-
used for the same purpose for which it was conceived 3
2
HM Treasury (2018), Tackling the plastic problem: Using the tax system or charges to address single-use plastic waste,
https://bit.ly/2s39Sx1
3
EC (2018), Proposal for a Directive of the European Parliament and of The Council on the reduction of the impact of certain
plastic products on the environment https://bit.ly/2s1K45d
Resourcing the Future PartnershipPlastic | Final
1. Introduction
Resourcing the Future is a collaborative partnership between the CIWM, ESA, Resource
Association and WRAP. The partnership commissioned Resource Futures and Nextek to
research and develop a ‘framework’ for improving plastics resource efficiency.
The aim is to assist stakeholders across the plastics value chain to move forward in a common
direction and improve the role of the UK secondary plastics market. This report has been
prepared independently and does not represent the views or position of the partnership
members.
Plastics are widely used in all areas of society. The range of applications demonstrate the
versatility of plastics, from transparent flexible food wrap to high strength construction
materials. Plastics can allow the manufacture of goods that would not be technically possible
or affordable using other materials.
The simplest categorisation of plastics is into packaging and non-packaging. In the UK,
collected plastic packaging is reported to be recovered at approximately 45%. However non-
packaging is thought to be recovered at a much lower rate.
Recent media coverage has lifted the issue of waste plastics higher up public consciousness
and, as a result, there is increasing pressure across society for a response from both
commerce and government. Marine pollution and excessive use of packaging have prompted
a range of initiatives in the UK, such as ‘plastic free aisles’ in supermarkets, carrier bag bans,
and proposed deposit return schemes. The Government’s 25-year Environment Plan4 also has
a key focus on plastics, committing the UK to eliminating avoidable plastic waste by the end of
2042.
However, the negative publicity around plastics and, in particular, single use plastics, has the
potential to influence decision-making without considering sound evidence. This could result
in unintended consequences in terms of environmental, social and economic impacts, and
work against efforts to transition towards a circular economy.
The research presented here proposes that the debate around plastics and plastics waste is
reframed. It provides guidance on the decision-making processes and tools that will help
identify the interventions that will be the most effective at mitigating environmental impacts
and developing a strong and stable circular economy.
In overview, the framework and intervention guidance are intended to help stakeholders
develop strategies to:
Design and manufacture plastic products for longer use and better end-of-life
treatment or disposal;
Maximise environmental benefits during the use of plastic products; and
4
HM Government (2018), A Green Future: Our 25 Year Plan to Improve the Environment, https://bit.ly/2r0iV1Z
Resourcing the Future Partnership| Page 9Plastic | Final
Increase the amount of plastics that are re-used, recycled and recovered.
This report distils information from literature and engagement with stakeholders.
2. Context
2.1 Policy and other instruments
A wide range of legislation affecting how plastics are produced, used and disposed of is in
place in both EU and UK law5. Several strategies and voluntary agreements are also in place.
The following section outlines the key UK and EU instruments that are influencing the current
debate around plastics. Further details of EU legislation can be found in Appendix A.
2.1.1 UK
The UK Government’s recently published 25-year Environment Plan6 states an ambition to
eliminate avoidable plastic waste by the end of 2042. The rationale is that some plastic wastes
are ‘difficult to dispose of in a way which does not harm the natural world’. The key
aspirations are outline below in Table 2.
Table 2: Summary of relevant commitments from 25-year Environment Plan
Reforming and extending the producer responsibility system to include products not currently
covered and stimulate the secondary plastics sector
Encouraging industry to rationalise packaging and materials formats to facilitate end-of-life
processing
Production
Building on the existing microbeads ban
Accelerating funding from the Industrial Strategy Challenge Fund
Encouraging development of bio-based, biodegradable and ‘environmentally friendly’ plastic
Encouraging water refill points in business and public places
Use Extending plastic bag charging to small retailers
Explore the introduction of plastic free supermarket aisles
Continuing support for on-pack-labelling
Waste
Continuing with litter strategy
collection
Implementing interventions to reduce commonly littered items
Improve consistent collection
Waste
Increase plastic collected for recycling
treatment
Develop standards for biodegradable bags
& disposal
Investigating reduction of CO2 emissions from incinerators by reducing plastics in residual waste*
* This action appears under the sub-heading for ‘improving management of residual waste’
5
It should be noted that there is potential for uncertainty arising from the proposed exit of the UK from the EU (hereafter Brexit).
6
HM Government (2018), A Green Future: Our 25 Year Plan to Improve the Environment, https://bit.ly/2r0iV1Z
Resourcing the Future Partnership| Page 10Plastic | Final
The UK Plastics Pact7 is a collaboration between WRAP, retailers, plastics recyclers, brands,
manufacturers, NGOs, Governments and local authorities. The Pact’s participants are
responsible for more than 80% of the UK’s supermarket plastic packaging and this voluntary
agreement is the first of its kind the world.8 It sets out the following targets to be achieved by
2025:
Eliminate problematic or unnecessary single-use plastic packaging through redesign,
innovation or alternative delivery models (such as reuse)
All plastic packaging reusable, recyclable, compostable
70% of plastic packaging recycled, reused or composted
30% recycled content across all plastic packaging
Furthermore, Defra is due to publish a national Resources and Waste and Strategy in 2018
which is expected to expand on many of the topics discussed in this research.
In addition to the above, two further specific interventions are noteworthy including the
introduction of a deposit return scheme and also the potential for a single-use plastic tax
which, at the time of writing, is the subject of a public consultation.9 These, along with other
interventions are discussed in more detail in Section 5.
2.1.2 European Union
The majority of UK environmental law affecting how plastics are made, used and managed
originates from EU directives which are summarised in more detail in Appendix A.2. Three
recent policy frameworks are particularly relevant to the present study:
Circular economy package – a set of proposed actions aimed at "closing the loop" of product
lifecycles by retaining the maximum value and use from raw materials, products, and waste.10
The new package requires producers to bear 80% of ‘necessary costs’ to achieve weight-based
targets for packaging recycling.
European Strategy for Plastics in a Circular Economy - new rules on packaging will be
developed to: improve the recyclability of plastics; increase demand for recycled plastic
content; reduce the use of single-use plastics and microplastics in products; prevent littering
at sea; provide guidance for national authorities and businesses on how to minimise plastic
waste at source; and, collaborate to devise global solutions and develop international
standards.11
7
WRAP (2018), The UK Plastics Pact, https://bit.ly/2FiCqHp
8
Ellen Macarthur Foundation (2018), Plastics Pact, https://bit.ly/2sTiFCf
9
HM Treasury (2018), Tackling the plastic problem: Using the tax system or charges to address single-use plastic waste,
https://bit.ly/2s39Sx1
10
EC (2018), Circular Economy Package, https://bit.ly/2krgtxX
11
EC (2018) European strategy for plastics, https://bit.ly/1pjhS7g
Resourcing the Future Partnership| Page 11Plastic | Final
Proposal for a directive on single use plastic packaging12 - this proposal targets 70% of
items thought to contribute to marine debris through a combination of bans; producer
obligations; awareness raising measures; labelling; and consumption and collection targets. At
the time of writing this proposal has been agreed at the EU level and will be passed to the
European Parliament and Council for adoption.
Clearly these policies represent considerable progress towards reducing pollution and
improving resource efficiency for waste plastics and it is likely that further legislative changes
will be proposed in line with the EU Plastic Strategy. This rapidly changing policy landscape is
likely to impact on the UK’s waste industry significantly in the coming years and it is therefore
increasingly important for the UK to consider its own policies in line with its neighbours.
2.2 Plastic types
The production of plastics is complex, with many stages between the creation of monomers
from refined crude oil or shale gas, to polymerisation and manufacture into products. They
are all polymers (meaning literally “many units”) and can be classified into two broad subsets,
thermoplastics and thermosets, which are described briefly in the following sections. A third
section discusses the topic of bio-plastics.
2.2.1 Thermoplastics
Thermoplastics account for over 90% of the mass of plastics produced.13 14 They remain
chemically stable over a large range of temperatures and can be melted and shaped into new
objects and solidified simply by cooling. This feature allows plastics to be readily recycled by
grinding items to smaller sizes and then re-melting and reshaping once again. The main
processes used in manufacturing are injection moulding, blow moulding, thermoforming, and
extrusion.
The most commonly encountered plastics are Polyethylene, Polypropylene, Polystyrene,
Polyvinyl chloride (PVC), Acrylic, Nylon, and Polyethylene terephthalate (PET). Whilst there are
twenty or so commonly encountered plastics, there are many hundreds of plastics is use.
Importantly, very few of these can be mixed together during recycling and require separation
into mono-polymer streams. A list of the main thermoplastics used is shown in Table 18,
Appendix C.
12
EC (2018), Directive of The European Parliament and of The Council on the reduction of the impact of certain plastic products
on the environment, https://bit.ly/2scgqKM
13
CISION (2015), Global Thermosetting Plastics Market - Segmented by Type, Industry and Geography - Trends and Forecasts
(2015-2020) - Reportlinker Review, http://prn.to/2GSIpnx
14
CISION estimates production at ~34 Mt in 2014 and Geyer (2017)Error! Bookmark not defined. estimates total polymer resin a
nd fibre production at 367 Mt for the same year. Therefore thermosets = 9.3% global production of all plastics
Resourcing the Future Partnership| Page 12Plastic | Final
2.2.2 Thermosets
Thermosets are plastics that have been chemically reacted or “set” in a way that prevents
melting and are characterised by their high resistance to heat, solvents, chemicals and
mechanical force. Thermosets are typically more challenging to recycle due to their inability to
be melted down and reformed in the same way as thermoplastics. The manufacturing
methods are typically compression and injection moulding without cooling while the chemical
(crosslinking) reaction is taking place hence the name “thermo set”. A list of the main
thermosets in use is provided in Table 19, Appendix C.
2.2.3 Bioplastics
The term bioplastics covers a range of fossil and biological based materials which have been
developed with different environmental outcomes in mind including the substitution of fossil
fuels and post-use environmental impact. There are potentially interesting benefits from this
group of materials which may be applicable in specific circumstances; these are discussed
throughout this document.
Though they currently make up only a small proportion of plastics overall (~1%), bioplastics
are worthy of more explanation in this report as they are topical and a source of ongoing
confusion amongst the public and across industry.
More detail is provided in Appendix D and a short summary is provided here. There are two
broad concepts for this group of materials:15
Bio-based plastics have been produced from biological sources such as sugar cane,
beet sugar, corn, potatoes, grains or vegetable oils. They are not necessarily
biodegradable.
Biodegradable plastics can be broken down by micro-organisms to make carbon
dioxide and water under aerobic conditions or methane under anaerobic conditions.
These plastics can be made from biogenic16 or fossil-based material.
Within these broad groups lie several sub-categories which are described in the following
sections and illustrated in Figure 3.
15
Plastics Europe (2016), Plastics – the Facts 2016: An analysis of European plastics production, demand and waste data,
http://bit.ly/2C39H7H
16
Biogenic refers to material which is derived from plants or animals within recent history. In this context it excludes fossil
material including derivatives of crude oil.
Resourcing the Future Partnership| Page 13Plastic | Final
Figure 3: Interrelationship between conventional, bio-based and biodegradable plastics17
Biobased
Biodegradable and biobased
Biobased Biodegradable
‘Drop-in’ bioplastics ‘Novel’ bioplastics
Biobased PE PLA
Biobased PET PHA
Biobased PA PBS
Biobased PTT Starch Blends
Non- Biodegradable
biodegradable
Conventional / ‘Novel’ bioplastics
mainstream plastics PBAT
PE PCL
PP
HDPE
PET etc.
Fossil-based
2.2.3.1 Bio-based plastics
There are two further sub-groups within the bio-based plastics group:
Novel bio-based plastics which have relatively new chemical structures such as
polylactic acid (PLA) or Polytrimethylene terephthalate (PTT);18 and Polybutylene
sebacate (PBS).
Drop-in plastics such as PET (Bio-PET) and bio-based polyethylene (Bio-PE) which have
the same chemical structure as their fossil-based counterparts, are miscible19 with
them and share the same characteristics.
‘Drop-in bioplastics’ have the advantage that they are also recyclable alongside fossil-based
polymers of the same type, with special precautions. Novel, biodegradable bio-based plastics
are generally designed to be biodegradable at ambient or elevated temperature conditions.20
17
Based on Perstorp, https://bit.ly/2KKo1ag
18
Institute for Bioplastics and Biocomposites (2016), Biopolymers facts and statistics, https://bit.ly/2rZBRxy
19
Capable of forming a homogeneous mixture that neither separates nor is altered by chemical interaction aka mixable
20
Moss et al (2017), Sea of Opportunity: Supply Chain Investment Opportunities to Address Marine Plastic Pollution,
http://bit.ly/2pxLHVf
Resourcing the Future Partnership| Page 14Plastic | Final
2.2.3.2 Biodegradability of plastics
The term ‘biodegradability’ is commonly misunderstood and misreported. There are several
standards for compostability in commercial and home composting contexts (see Appendix D)
but though test methods exist, there is no agreed standard for degradability in the natural
environment. This partly because the behaviour of these materials in different settings is not
well understood. A UNEP report21 concluded that compostable plastics in the marine
environment would be unlikely to reduce the impacts of marine litter, in part because they
may still take many years to fully break down. This issue has significant implications for the
way that we classify and manage biodegradable plastics.
2.2.3.3 Recycling and incineration of biodegradable bio-based plastics
Biodegradable, bio-based plastics are often difficult to recycle because they can break down
readily and because many of them are hygroscopic (absorb moisture). Water attacks the
polymer during melting stages, weakening the material.22 However, some biodegradable bio-
based plastics are recyclable and at least one commercial recycler of PLA is known to operate
in Belgium23. However, there are no currently known commercial avenues for recycling novel
biodegradable bioplastics in the UK.
The main waste management route available for biodegradable bio-based plastics in the UK is
incineration or landfill. If energy is recovered from incineration, this could potentially result in
a net green-house gas mitigation benefit as the carbon source is biogenic (short-cycle).24 In
the case of landfill, however, any methane generated by degradation will contribute to global
warming if uncaptured.25
As discussed in Section 2.2.3, there is significant risk of confusion amongst consumers
because novel bio-based, biodegradable plastics often exhibit the same aesthetic
characteristics as mainstream alternatives. The potential for novel biodegradable bio-based
plastic products to contaminate and lower the quality of conventional plastics is considerable
and potentially damaging to the secondary plastics market.
2.2.3.4 Compostability
Many biodegradable bio-plastics and some fossil-based plastics are also considered
compostable under certain conditions. Several standards exist; the main European one being
EN13432, which broadly share the same common definitions:26
21
UNEP (2015) Biodegradable plastics and marine litter, misconceptions, concerns and impacts on marine environments.
http://bit.ly/2uEJLM8
22
Defra (2015), Review of standards for biodegradable plastic carrier bags, https://bit.ly/2IC6fcm
23
Looplife Polymers, https://bit.ly/2Hzf80Z
24
WRAP (2010), Environmental benefits of recycling, http://bit.ly/2uricL6
25
Estimates suggest fugitive emissions are approximately 50% from UK landfill sites: Defra (2014), Review of landfill emissions
methane modelling, https://bit.ly/2LxTa1z
26
WRAP (2010), Environmental benefits of recycling, http://bit.ly/2uricL6
Resourcing the Future Partnership| Page 15Plastic | Final
Chemical characteristics: it contains at least 50% organic matter (based on dry
weight) and does not exceed a given concentration for some heavy metals.
Biodegradation: it biodegrades by at least 90% (by weight) within six months under
controlled composting conditions (temperature of 58 +/- 2°C).
Disintegration: it fragments into pieces smaller than 2mm under controlled
composting conditions within 12 weeks.
Ecotoxicity: the compost obtained at the end of the process does not cause any
negative effects.
A key limitation of compostable plastics which meet these standards is that six months is
allowed to break down the material. There are more than 50 composting facilities that could
potentially accept these materials; however many of them typically process material over an
eight to twelve-week period. This may be adequate for highly absorbent films such as caddy
liners but is unlikely to be sufficient to process other compostable plastics such as those used
for beverage containers, which are designed to resist water and are therefore less easily
broken down.
Additionally, compostable plastics tend to exhibit similar aesthetic and physical properties to
non-compostable plastics, meaning that they are almost impossible to distinguish at a
composting plant. Determining whether they should be accepted in the process or screened
out as contamination is therefore challenging. Conversely, this same confusion arises at
plastics recycling facilities which cannot differentiate between compostable and mainstream
target plastics types.
2.2.3.5 Market share for bio-based plastics
As highlighted above, bio-based plastics currently make up approximately 1% of global
plastics production. The largest growth area is expected to be for drop-in bio-based plastics
which are anticipated to have a 75% share of the total bio-based plastics market by 2021.27
27
European Bioplastics (2016), Bioplastic market data 2016, http://bit.ly/2ySHyz7
Resourcing the Future Partnership| Page 16Plastic | Final
Figure 4: Bio-based plastics placed on market (IBB 2016)27
Biodegradable
PLA Biodegradable
polyesters
10.9% starch blends
Others 10.8%
9.4%
1.2%
Bio-PA PHA
4.8% 3.6%
Regenerated
Bio PE
cellulose
9.9%
1.4%
PTT Cellulose
5.9% derivatives
0.2%
Bio-PET
41.9% Chart Title
63.7% 36.3%
non-biodegradable biodegradable
2.3 Technical barriers to plastics recyclability
The low recycling rates achieved for waste plastics are partly a consequence of the way that
plastic products are designed and produced. Identifying and removing these barriers could
have a considerable impact on creating a more circular material chain.
Several guides and tools are available to assist packaging manufacturers with designing their
products to assist secondary reprocessors, and address the barriers experienced by recyclers.
These include the European Plastics Bottle Platform (EBPB)28, the Association Plastics
Recyclers (APR Design® Guide) in the USA29, the European Association of Plastics Recycling
(EPRO)30, RECOUP31, and the RecyClass software tool32 of Plastics Recyclers Europe33 and
WRAP.34
The overall message from the range of guidance documents above is that complexity in the
range of polymers, colours, labels, and components impedes recycling and that simplifying
and standardising these materials would be an effective intervention for recyclability. These
issues are discussed further in Section 6.1.2.3.
28
EPBP (unknown), Design Guidelines, https://bit.ly/2gKFXnS
29
Association of Plastics Recyclers (unknown), The APR Design Guide for Plastic Recyclability, https://bit.ly/2JANB0X
30
EPRO (unknown), Do your own Recycling Evaluation!, https://bit.ly/2Hzkl93
31
Recoup (2017), Recyclability by Design, https://bit.ly/1Bw1XGR
32
Recyclass (unknown), The Recyclability Tool for plastic package, https://bit.ly/2zkhrGd
33
Plastics Recyclers Europe (unknown), Design Guidelines for Recycling, https://bit.ly/2JBrdIn
34
PRAG (2009), An introduction to Packaging and Recyclability. https://bit.ly/2JjhfM9
Resourcing the Future Partnership| Page 17Plastic | Final For secondary plastics to compete with virgin materials, they must not only compete on price but also on quality. Plastics are often highly mixed, contaminated and dispersed; requiring technical solutions to effectively separate, clean and then separate again before the desired quality is achieved. The specialist equipment, power, and time required all impact on the operational costs of plastics recycling and sorting. The range of additives used in products also present a potential challenge to secondary materials markets. For example, meeting stringent food grade requirements or automotive safety standards is not easily compatible with current collection, sorting and cleaning processes. One of the limitations of current recycling systems is the inability to distinguish between food grade and non-food grade packaging. This is necessary to satisfy EU requirement (EC No 282/2008) which mandates that only food grade materials may be reused back into the food contact applications35. Extensive research has been conducted on this issue, including assessment of the potential to use markers to allow the two types of plastics to be efficiently separated for recycling.36 This would stimulate the recycling of food grade PP37 which is currently only recycled into non- food applications. It would also improve the yield and quality of sorting of other food grade plastics such as HDPE and PET. The use of colourants in plastics is another factor that limits the secondary use of recycled plastics. Retail brands usually want all products to look identical and consequently, recovered coloured plastics have limited markets in new packaging38. The use of small labels or removable sleeves over unpigmented plastics would boost the value and applicability of recycled plastics. As discussed above, novel bio-based plastics, which are visually and aesthetically similar to mainstream plastics (e.g. PLA and PAH), will negatively affect the quality of recycled plastics if they are not separated effectively. The use of oxo-degradable additives, which has grown steadily over recent years, will have a similar effect. The has significant cost implications for recyclers who will need to use additional technology to identify and separate these materials (for example, installing NIR spectroscopy separators to target a single novel material which may only arise in very small quantities. 35 EC (2008), Commission Regulation (EC) No 282/2008 of 27 March 2008 on recycled plastic materials and articles intended to come into contact with foods and amending Regulation, https://bit.ly/2y2AYuA 36 WRAP (20144), Optimising the use of machine readable inks for food packaging sorting, https://bit.ly/2MlErqY 37 WRAP (2016), Food grade recycled polypropylene (rPP) in packaging https://bit.ly/29JCYuE 38 Plastics Technology (2015), Colored PET: Pretty to Look at; Headache For Recyclers, https://bit.ly/2MmWeOv Resourcing the Future Partnership| Page 18
Plastic | Final

     2.4               The secondary plastics market
          2.4.1 Plastic waste generation
An estimated 4.9 million tonnes of plastics are placed on the UK market each year, of which
around 3.7 million tonnes become waste (Table 3). The remaining estimated 1.2 million
tonnes is thought to accumulate as stock.39 Three plastics HDPE, LDPE and PP account for
nearly 60%; with PET, PVC and PS accounting for another 26%. The remaining seven plastic
categories are relatively minor by comparison accounting for 16% in total.
Table 3: UK plastic waste generation from all sources in 2016 (source: BPF)

 Plastic polymer type                                               Waste generation (ktpa) Proportion
 HDPE                                                                                   937         25%
 LDPE LLDPE                                                                             682         18%
 PP                                                                                     558         15%
 PET                                                                                    424         11%
 PVC                                                                                    308          8%
 PS                                                                                     269          7%
 Others                                                                                 170          5%
 PUR                                                                                     92          2%
 EPS                                                                                     87          2%
 Other thermoplastics                                                                    80          2%
 ABS, SAN                                                                                65          2%
 PA                                                                                      58          2%
 PMMA                                                                                    38          1%
                                                              Total                   3,768        100%

Data describing the waste estimates in Table 3 by industrial sector exist but do not necessarily
align and it is not within the remit of this report to scrutinise sources in detail. However two
sources are provided as an indication, which is essential to help target interventions
proportionately. The first estimates are provided by WRAP-Valpak (2016)40 and illustrated in
Figure 5.

39
   Note that this 1.2 million tonnes accumulation is a speculative figure, based in part on Geyer’s global analysis and through
discussions with industry stakeholders. Obtaining more reliable data could form a new body of research.
40
   WRAP-Valpak (2016), Plastics Spatial Flow, https://bit.ly/2l6PcRR

Resourcing the Future Partnership| Page 19
Plastic | Final
Figure 5: Estimated plastic waste arisings by industrial sector
Agriculture Others
1% 4%
Household,
leisure and
sports
10%
Electrical and
electronic
6%
Automotive
3%
Construction Packaging
7% 69%
Chart Title
The estimates in Figure 5 provide a useful indication but are hard to verify, and the report
acknowledges uncertainty. In particular, the proportion of packaging in comparison to non-
packaging appears high when compared with other data.
In a recent study of global plastics production and fate41, packaging worldwide is estimated to
be just under 42% of the total plastic waste generated. These data are illustrated in Figure 6
showing waste generation and indicating the amount of material from each industrial sector
which is retained as stock.
41
Geyer et al (2017), Production, use, and fate of all plastics ever made, Science Advances, http://bit.ly/2uBs8AT
Resourcing the Future Partnership| Page 20Plastic | Final
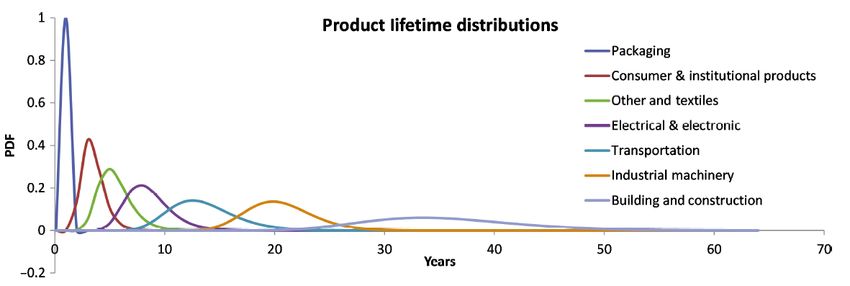
Figure 6: Global weight of plastic polymers produced by industrial sector. ‘Accumulation’ is
approximated as an indication only (Geyer et al., 2017)41
160.0
140.0
120.0
Amount Mt/annum
100.0
80.0
60.0
40.0
20.0
0.0
Packaging Building and Textiles Other Consumer & Transportation Electrical/ Industrial
Construction Institutional Electronic Machinery
Products
PP LDPE, LLDPE PP&A fibres HDPE PVC PET PUR PS Additives Other Accumulation
2.4.2 Domestic market for secondary plastics
Data on the amount of plastic waste
collected, recycled and exported is not ~0.3 MT recycled
consistently reported. Packaging data ~1.5 MT
non-packaging
and municipal data in general are
robust, but as described in Section
2.35 MT missed
2.4.1, there is some uncertainty over ~3.7 MT opportunity
waste
the amount of non-packaging plastics generated
which are produced and recycled as
~2.2 MT
many of these data are not
packaging
comprehensively reported This report ~0.65 MT
~1.05 MT Export
recommends improved data collection recycled
~0.4 MT UK
for non-packaging waste in Section 6.
Furthermore, the amount of plastic
Figure 7: Estimated UK plastic waste generation42
42
Estimation is a combination of the following: Resource Futures (2016) Resource Data, https://bit.ly/1IMEBPH uses SIC code data
combined with survey data to estimate 200,000 tonnes per annum of waste plastics recycled in the UK from the non-packaging
sector. We then estimate the combined output from MBA Polymers and Axion (both processing WEEE and ELV shredder residue)
is 50,000 tonnes per annum. We also know that Recovinyl collects 117,000 tonnes per annum of PVC from construction.42 WRAP-
Valpak estimates nearly 380,000 tonnes per annum, but these data seem high in the context of other estimates. Therefore a
middle ground of 300,000 tonnes has been suggested.
Resourcing the Future Partnership| Page 21Plastic | Final
waste being collected for recycling is steadily increasing.
It is beyond the scope of this report to provide detailed waste data. However, several sources
from 2016 and 2017 have been compared to arrive at the estimates illustrated in Figure 7.
Data have been rounded to the nearest 50,000 tonnes which also indicates the accuracy of
the figures.
Of the estimated 3.7 million tonnes of plastic waste produced in the UK,15 around 400,000
tonnes of plastic packaging is collected and processed in the UK each year43 (including
unaccredited tonnage of approximately 50,000 tpa)44 and a further ~650,000 tonnes is
exported.45 It is also estimated that 300,000 tonnes of non-packaging is recycled42 but the
data are hard to verify. Plastic material that is currently not being captured for recycling is
estimated to be 1.15 million tonnes for packaging and 1.2 million tonnes for non-packaging
plastics.46
2.4.3 Secondary plastics operational capacity
In the UK, post-consumer plastics are processed by material recovery facilities (MRFs). These
separate polymers by type and bale them into a saleable product which may then be further
sorted in specialised plastics recovery facilities (PRFs). These businesses are sometimes
vertically integrated and process the material further by high purity sorting, size reduction
and washing to produce high purity plastics flakes.
Some plastics (notably PET but HDPE, PP and PVC as well) are sold in flake form directly to
product manufacturers to minimise energy costs and reduce the number of times the
material is heated up (plastics properties are reduced each time they are heated). Further
processing by extrusion, inclusion of additives and melt filtration is used to produce pellets
with very low levels of contamination and properties suited to specific end applications
including food grade PET and HDPE. Many facilities provide a complete service from sorting
through to pelletising. At present there is an estimated capacity of over 1.3 million tonnes of
plastic sorting, washing and flaking in the UK and pelletising capacity of at least 0.5 million
tonnes making pellets from LDPE, HDPE, PET and PP. A further discussion on UK capacity can
be found in Section 6.1.1.
2.4.4 Exports
The UK does not currently have sufficient capacity for recycling all the mixed plastics collected,
so much of this material is exported to other countries. The costs of shipping recycled
materials overseas are low because the UK is a net importer of consumer goods and there is
lots of capacity on ships leaving the UK.
43
Environment Agency (2018) National Packaging Waste Database, https://bit.ly/2y5jXOO
44
WRAP (2014), Plastic Packaging Market Study (Plastic Flow), https://bit.ly/2JxuFAk
45
HMRC (2018), UK Trade Info, https://bit.ly/1eP80tm
46
Calculated by deduction from the other estimates
Resourcing the Future Partnership| Page 22Plastic | Final
Demand for waste plastics has been dominated by China since the early part of the 21st
century,47 driven by China’s manufacturing sector’s demand for resources.
However, China’s 2018 import restrictions have created a global shift in the secondary plastics
market. As a result, the UKs waste plastics are now exported to other destinations including
Malaysia, Turkey, Indonesia and, to a lesser extent, countries such as Belgium, Thailand and
Turkmenistan (see Figure 8).
Figure 8: Plastic scrap exports from the exports from the UK48
300,000
250,000
plastic exported form UK (tonnes/annum)
2016
200,000
2017
150,000 2018 predicted
100,000
50,000
0
Total waste plastic exports (including to the EU) were around 750,000 tonnes in 2014, 2015,
and 2016 but dipped to 650,000 tonnes in 2017 and (based on Q1 data) are expected to
maintain the same level in 2018. So, despite the Chinese restrictions, UK exporters have been
successful in finding new avenues for plastic waste thus far.
However, officials in some export destinations such as Indonesia, Thailand, Malaysia and
Vietnam, have begun to raise concerns over quality and there have been several suggestions
47
Based on analysis of UN Comtrade data (2018) http://bit.ly/2jL1FIk
48
Based on analysis of HMRC export data (2018), https://bit.ly/1eP80tm. Note that at the time of writing, 2018 data have only
been reported for the first quarter; these were multiplied by four to predict the amount of material that will be exported to each
country in 2018. Note that ‘dispatches’ to the EU are reported here as ‘exports’ for simplicity and may be further re-exported
outside the EU.
Resourcing the Future Partnership| Page 23Plastic | Final
of tightening import restrictions and in some cases banning imports completely as China has
done.49
It is conceivable that a ripple effect may occur, where new end destinations are identified by
exporters from western nations and utilised for a short period before the authorities decide
that ongoing plastic waste imports are at odds with their environmental legislation or
industrial strategies. Of course, for every country which considers these wastes a burden,
there may be another one which sees an opportunity. However, it is highly likely that the
international trade in these materials will remain uncertain in the coming months and years.
Finally, it is important to note that the mid-price of plastics has not changed much as a result
of the Chinese import restrictions, although the range of prices paid for plastics has widened
(see Figure 9). In fact, compared to some of the fluctuations experienced in the early part of
the century, the price of waste plastics has experienced only temporary volatility in the last
five years.
Figure 9: Price of waste plastic bottles as reported by the WRAP Materials Pricing Report (MPR)
160
140
Collected price (£/ onne)
120
100
80
60
40
20
0
07 Jun 13
07 Jun 14
07 Jun 15
07 Jun 16
07 Jun 17
07 Mar 18
07 Mar 14
07 Mar 15
07 Mar 16
07 Dec 16
07 Mar 17
07 Sep 13
07 Sep 14
07 Sep 15
07 Sep 16
07 Sep 17
07 Dec 13
07 Dec 14
07 Dec 15
07 Dec 17
Low High Mid
49
https://resource-recycling.com/plastics/2018/06/06/import-restrictions-ripple-across-southeast-asia/
Resourcing the Future Partnership| Page 24Plastic | Final
2.4.5 Demand
The secondary plastics industry relies on there being demand for the materials it produces.
However, its products are largely undifferentiated from the primary materials that they
compete with on price52 partly because, although cheaper, in some applications they are
considered to be technically less reliable Table 4: UK plastics market material flow48 50
because of their thermal history (the number
Million tonnes
of times plastics are heated reduces the Material flow
per annum
strength of the material). This means that when
Primary plastics production UK 1.3
the price of virgin feedstock – oil or, in the case
Plastics ‘processed’ 3.2
of PET, cotton – falls, manufacturers may
Plastic products exported* 3.3
choose to use more virgin than secondary
Plastic products imported* 7.9
material.
* includes from EU and excludes plastics which are part of
For plastics recyclers, the impact of this lack of assemblies
differentiation is profound. They are much
smaller businesses than their primary producer counterparts and have much tighter margins
as most of their costs are directly fixed to the collection, sorting and cleaning of the material
regardless of the fluctuations in price across the wider market and the demand for their
output material. These factors have, in part, resulted in the closure of several UK plastic
recycling businesses in the last decade.52
The UK capacity for recycling is approximately 0.5 million tonnes per year, the overall UK
plastics sector is much larger, processing51 approximately 3.3 million tonnes per annum.
Some crude data for the UK plastics industry are provided in Table 4, but robust information
is difficult to obtain, partly because of terminology over what constitutes a ‘plastics producer’
and because plastic products which are produced, exported and imported are often part of
assemblies, or simply recorded under a more relevant commodity code.
The issues of capacity for processing waste plastics domestically, internationally and demand
for recycled plastics are discussed in more detail in Section 6.1.1.
2.4.6 Barriers in the UK secondary plastics market
Presently, mechanical recycling is often the most resource efficient end-of-life pathway for
waste plastics, however recycling rates are low compared to many other materials such as
steel, aluminium, paper and glass. In addition to the challenge of identifying and separating
the different types of plastics, one of the other major underlying causes of these low recycling
rates is the fragility and volatility in the secondary plastics sector.
50
British Plastics Federation (2017) The UK plastics industry: A strategic vision for growth, https://bit.ly/2yfutkx
51
The term ‘processing’ was provided by British Plastics Federation; its meaning is unclear
Resourcing the Future Partnership| Page 25You can also read