ENTRA LAYING DOWN THE PATHWAYS TO NEARLY ZERO-ENERGY BUILDINGS - A toolkit for policy makers - Öko-Institut
←
→
Page content transcription
If your browser does not render page correctly, please read the page content below

LAYING DOWN THE PATHWAYS
TO NEARLY ZERO-ENERGY BUILDINGS
      A toolkit for policy makers

             ENTRA
             NZE
Written by the ENTRANZE consortium

Name                                 Organisation
Lukas Kranzl (project coordinator)
Agne Toleikyte                       Vienna University of Technology, Institute of Energy Systems and
Andreas Müller                       Electrical Drives, Energy Economics Group
Marcus Hummel
Eva Heiskanen
                                     National Consumer Research Centre
Kaisa Matschoss
Clemens Rohde
Judit Kockat                         Fraunhofer Institute for Systems and Innovation Research ISI
Jan Steinbach
Inés Díaz Regodón
                                     National Renewable Energy Centre
María Fernández Boneta
Lorenzo Pagliano
Marco Pietrobon                      end-use Efficiency Research Group, Politecnico di Milano
Roberto Armani
Veit Bürger
                                     Öko-Institut
Tanja Kenkmann
Zdravko Georgiev
                                     Sofia Energy Agency
Diana Paunova
Ingeborg Nolte
Bogdan Atanasiu                      Buildings Performance Institute Europe
Cosmina Marian
Bruno Lapillonne
                                     Enerdata
Carine Sebi
Petr Zahradník
                                     SEVEn, The Energy Efficiency Centre
Jiri Karasek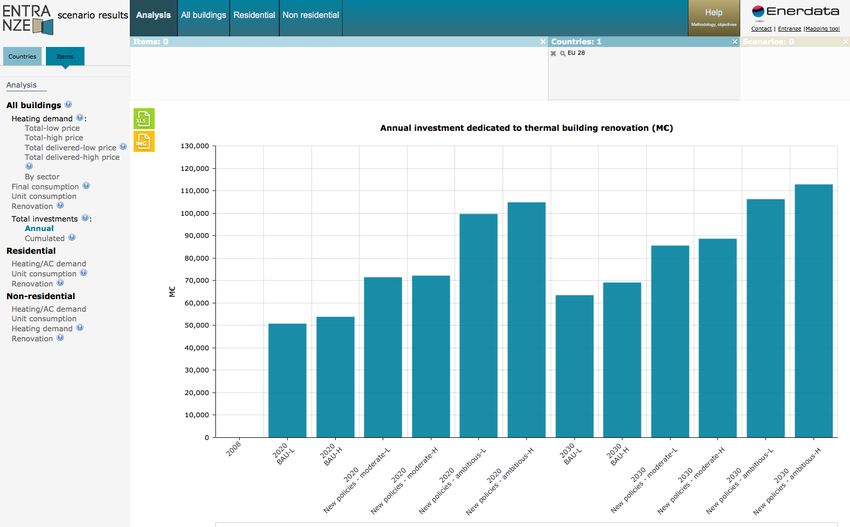
THE ENTRANZE PROJECT
The objective of the ENTRANZE (Policies to Enforce the Transition to nearly Zero-Energy
Buildings in the EU-28) project was to actively support policy making by providing the
required data, analysis and guidelines to achieve the fast and effective penetration
of nearly Zero-Energy Buildings (nZEB) and renewable heating and cooling (RES-H/C)
within the existing national building stocks. The project intended to connect building
experts from European research and academia to national decision makers and key
stakeholders with a view to building ambitious and reality-proof policies and roadmaps.

Acknowledgement:
The authors and the whole project consortium gratefully acknowledge the financial and intellectual
support for this work provided by the Intelligent Energy for Europe programme.

                Co-funded by the Intelligent Energy Europe
                Programme of the European Union

Legal Notice:
The sole responsibility for the content of this publication lies with the authors. It does not necessarily
reflect the opinion of the European Union. Neither EASME nor the European Commission is responsible
for any use that may be made of the information contained therein.
All rights reserved. No part of this publication may be translated, reproduced, stored in a retrieval system,
or transmitted in any form or by any means, electronic, mechanical, photocopying, recording or otherwise,
without the written permission of the publisher. Many of the designations used by manufacturers and
sellers to distinguish their products are claimed as trademarks. The quotation of those designations in
whatever way does not imply the conclusion that the use of those designations is legal without the
consent of the owner of the trademark.

Published in November 2014 by the ENTRANZE consortium.

Copyright 2014, ENTRANZE. Any reproduction in full or in part of this publication must mention the full
title and author and credit BPIE as the copyright owner. All rights reserved.
CONTENTS
THE ENTRANZE PROJECT								3
EXECUTIVE SUMMARY									5
INTRODUCTION										7

PART I: DRAWING THE MAP OF THE EU BUILDING STOCK
FROM STAKEHOLDERS TO COST-OPTIMAL RENOVATION SOLUTIONS                     8
 Status-quo and dynamics of building stock and related energy systems			   8
 Profile of stakeholders: behaviour, preferences and interests					        10
 Cost-optimal analysis of renovation solutions towards nZEB standards			   12

PART II: TOOLS AND MODELS 							15
 Data Tool – Mapping the EU building stock							          16
 Cost Tool – Defining a cost/energy balance							17
 Online Scenario Tool – from design to implementation					 18

PART III: POLICY ANALYSIS: STATUS-QUO AND SCENARIOS
                                                 19
 nZEB plans: definitions and instruments 							 19
 Scenario results for target countries								20
 Austria 											21
 Bulgaria											22
 Czech Republic										24
 Finland											25
 France											26
 Germany											27
 Italy												28
 Romania											29
 Spain												30
 Scenario results for EU-28									31

PART IV: POLICY RECOMMENDATIONS AT EU AND
MEMBER STATE LEVEL 								32
 Guidelines applicable to Member States							32
 Recommendations by type of instruments							34
 Recommendations at EU level 								35
EXECUTIVE SUMMARY
A very low energy consuming building stock in the EU can become a reality. ENTRANZE1
has created a policy ‘laboratory’ to develop and analyse the potential impact of national
strategies and policy sets so that buildings can achieve this target. Thus, the core mission
of ENTRANZE (Policies to Enforce the Transition to nearly Zero-Energy Buildings in the
EU-28) was to assist policy makers in developing integrated, effective and efficient
policy packages to achieve a fast and strong penetration of nearly Zero-Energy Buildings
(nZEB) and renewable heating and cooling technologies (RES H/C) – with a focus on the
refurbishment of existing buildings.
This report provides an overview of the activities and the results of ENTRANZE. The project covers the
whole EU-28. However, not all activities were carried out at the same level of detail for all Member States
(MS). The key target countries (Austria, Bulgaria, Czech Republic, Finland, France, Germany, Italy, Romania,
Spain) cover more than 60% of the EU building stock and all important climate regions.
The research conducted over several years covered the following topics:
• Filling information gaps related to the EU building stock;
• Analysing stakeholder behaviour and acceptance of various technologies;
• Identifying cost-optimal technology configurations of renovation activities;
• Developing scenarios for the development of energy demand in buildings up to 2030;
• Deriving policy recommendations for local, regional, national and EU policy makers.
One of the outstanding elements of ENTRANZE was the in-depth communication process with policy
makers through the setting up of policy group meetings and expert dialogues in all target countries.
The main conclusions and recommendations of the project are:
• Clear targets until 2050 for the energy performance of the building stock are required for the
development of target-oriented policy packages. Up to now only a few countries have adopted such
targets.
• A bundle of instruments is needed to properly address the heterogeneous target groups and
technology-specific barriers. The focus on a single instrument is not sufficient.
• While a strengthening of regulatory measures is essential, there is at the same time the need for
much stronger focus on compliance.
• There is a huge lack of data regarding renovation activities and the energy performance of buildings.
There is a need for a building data observatory, in particular for monitoring policy impacts.
• The EPBD (recast)2 was a first attempt to create a comparable framework for EU MS, however, further
enhancement of the legislation is necessary.
1
Policies to Enforce the Transition to nearly Zero-Energy Buildings in the EU-28, www.entranze.eu
2
Directive 2010/31/EU of the European Parliament and of the Council on the energy performance of buildings (recast).
Laying down the pathways to nearly Zero-Energy Buildings | 5• In particular, an enhanced EPBD framework should make clear that cost optimality has to represent
the absolute minimum requirements for existing regulations in the building codes. While nZEB
energy performance levels should be cost-effective, they still have to be more ambitious than cost-
optimal energy performance levels. Thus, an enhanced EPBD has to be very precise in asking MS to
present plans to close the gap between nZEB target levels in 2020 and the cost-optimal levels of
current building codes.
• The EPBD should also gradually increase the binding character of nZEB requirements for existing
buildings. Thus, a clear definition of nZEB or deep renovation is also required.
• Consistency in terminology and timing between Directives and CEN standardisation procedures
should be further enhanced.
In the end, the research conducted during the project offers policy makers a valuable toolkit and the
know-how on how to use it effectively so that they can improve the situation of the EU building stock by
achieving ambitious long-term energy savings and CO2 reductions.
This report is a non-exhaustive source of information regarding the results of the research conducted
during this project. It mostly offers hints and guidelines with respect to the project results. More
information can be found on the project website and in the report “Policies to enforce the transition to
nZEB: Synthesis report and policy recommendations from the project ENTRANZE.”3.
3
Available at http://www.entranze.eu/pub/pub-scenario
6 | Laying down the pathways to nearly Zero-Energy BuildingsINTRODUCTION
The recast EPBD requires that from 2019 onwards all new buildings occupied and owned by
public authorities are nearly Zero-Energy Buildings (nZEBs) and that by the end of 2020 all new
buildings are nZEBs. Acknowledging the variety in building culture and climate throughout
Europe, the EPBD does not prescribe a uniform approach for the implementation of nZEBs.
Member States (MS) should draw up specific national roadmaps reflecting national, regional
or local conditions. While it is necessary to improve the energy performance requirements
of newly constructed buildings to nearly zero-energy levels, it is of key importance to deeply
renovate the existing building stock towards highly ambitious levels, which are in line with
long-term energy policy and climate mitigation targets. The EPBD requires that MS stimulate
the progressive transformation of buildings that are refurbished into nearly Zero-Energy
Buildings, though without a clear definition of nZEB renovation.
The intelligent design of integrated policy packages will be crucial for achieving ambitious energy and CO2
savings in the building sector. Thus, the objective becomes to provide data, analyses and guidelines to design
ambitious and reality-proof policies and roadmaps to renovate the building stock towards nZEB levels.
The final results of ENTRANZE’s work addressing nZEB requirements and recommendations based on
in-depth communication with policy makers, experts and other stakeholders are now available in this
publication. The aim is to showcase innovative policy sets supporting nZEB and RES-H/C carried out in an
integrated, effective and efficient way. The following chapters also contain valuable guidelines on how to
provide favourable conditions and a framework for high-quality deep renovation measures.
Part I of this report lays out a somewhat detailed picture of the European building stock, its thermal
efficiency, its energy consumption for space heating, hot water, cooling, lighting, the split between different
heating and hot water systems and applied energy carriers. Furthermore, the structure of stakeholders,
investors and users is presented alongside their preferences and interests with respect to building-related
energy issues and their tendencies towards accepting nZEB technologies. All these elements establish a
sort of profile of these actors. Finally, policies that foster the transition to nZEB should be based on a sound
cost-optimal approach. An analysis of this approach was undertaken in order to identify cost-optimal levels
for the refurbishment of residential and public buildings.
Part II goes further by showcasing the tools and models developed to support policy makers by filling
the data gaps on the building stock and offering reliable parameters for an effective transition to nZEB. As
such the Data Tool contains an in-depth description of building characteristics and related energy systems.
The Cost Tool analyses the impact of a large number of renovation packages for specific building types in
terms of costs and primary energy demand. It is a flexible tool for deriving cost-energy curves to assess
cost optimal solutions which take into account specific climate zones, various energy price scenarios, and
renewable energy generation. The Online Scenario Tool provides the outcomes of applying different sets of
national policy packages on the refurbishment of existing buildings.
Part III focuses on policy analyses and policy scenarios for the transition to nZEBs both at EU and MS levels.
A cross-country comparison also highlights the diversity of the cases analysed and the common ground on
which to build future legislation at EU level.
Part IV derives policy recommendations for the target countries, in general at MS level, as well as for a
further enhancement of the policy framework at EU level.
Laying down the pathways to nearly Zero-Energy Buildings | 7PART I:
DRAWING THE MAP OF THE EU
BUILDING STOCK
FROM STAKEHOLDERS TO COST-OPTIMAL RENOVATION SOLUTIONS
Status-quo and dynamics of building stock and related energy systems
In order to implement effective policies for the transition to nZEBs, there is a crucial need to have reliable
and comprehensive information and data on the building sector and its energy consumption. After years
of research and by integrating relevant sources like Odyssee, the BPIE Data Hub, Tabula, Eurostat and
other studies and country specific, national data, we are able to depict a fairly detailed picture of the
European building stock, its thermal efficiency, its energy consumption for space heating, hot water,
cooling, lighting and the split applied between different heating and hot water systems and energy
carriers.
The results of these in-depth analyses of the dynamics, activities and challenges in the building sector
and its energy consumption were used to build up a data foundation and inputs for modelling exercises.
As is well known, the EU building stock is quite heterogeneous. Nevertheless, the aim was to cover the
whole building stock including different types of residential and non-residential buildings. However, there
are still huge data gaps in some of these sectors, in particular in non-residential buildings. Moreover, in
some countries the data might not be as complete as in others. The current situation reveals the following
gaps in data streams which are essential when assessing the potential savings and effectiveness of
national policies and measures:
• Data related to renovation activities are badly covered in MS official statistics. For instance, this is the
case for the rate of renovated stock/area per year with their corresponding level of retrofit (annual
expected savings, type of building components renovated, age of buildings retrofitted…) which are
not well estimated.
• The level and quality of data related to non-residential buildings is significantly lower than the data
on the residential stock. Non-residential buildings still represent on average 25% of the stock making
them a crucial part of the equation. However, basic data, such as the breakdown of stock according
to the age of construction or to branches and their corresponding U-values, are missing in several
countries.
• Data on Building Energy Management Systems (such as the diffusion of smart metering or smart
devices) are difficult to collect and we lack comprehensive statistics on their diffusion.
• Data on space heating and cooling systems are only partly covered to an acceptable extent. In
particular there are uncertainties and data gaps regarding secondary heating systems, the use of
biomass in particular in single stoves and the diffusion of air conditioning in the building stock.
8 | Laying down the pathways to nearly Zero-Energy BuildingsDespite of these barriers and insufficient data sources, ENTRANZE built on all relevant existing sources
to collect and present data on the EU building stock. Thus, relevant data which can impact the design
of policies are available, so it is possible to trace some of the main characteristics of the current stock
situation. For instance, one piece of the puzzle is the average age of buildings and the share of new
buildings in the total stock (see Figure 1). This is a good indicator of the average efficiency of the building
stock since the higher the share of recent dwellings, i.e. those built with more efficient standards, the
higher the energy performance of the stock. Figure 14 shows that up to 40% of dwellings were built
before 1945 in the UK or Belgium. In most EU countries, half of the residential building stock was built
before 1970, i.e. before the first thermal regulations. Only in a few countries does the stock of recent
dwellings, i.e. built after 2000, represent a significant share (e.g. over 30% for Cyprus or Ireland).
UK
Belgium
Demark
Sweden
Slovenia
Luxembourg
France
Lithuania
Czech Rep.
Sovakia
Austria
Italy
Netherlands
Malta
Germany
Latvia
Poland
Hungary
Estonia
Ireland
Croatia
Bulgaria
Finland
Portugal
Spain
Serbia
Romania
Greece
Cyprus %
10 20 30 40 50 60 70 80 90 100More than 75% of dwellings are heated by gas in the Netherlands or the UK, and by oil in Greece. Other
countries have a more balanced distribution of dwellings by energy used for space heating. At EU level,
26% of the stock is heated through district heating, 23% by gas, 21% by electricity, 18% by oil, 10% by
biomass and 2% by coal.
Total energy demand per m² is heterogeneous among countries in the residential sector: from 69,
respectively 90 kWh/m² in Malta or Portugal, to almost 294, respectively 301, kWh/m² in Finland and
Latvia, which is significantly higher than the EU average. These differences are partly due to climatic
differences and partly due to the different energy performance levels of the building stock.
On the other hand, the distribution of floor areas by service sub-sector is quite homogeneous between
countries. Offices (including private and public ones) represent on average a quarter of non-residential
floor areas, as well as wholesale and retail trade buildings.
As for residential buildings, energy consumption per m² in services is also heterogeneous between
countries: below 200 kWh/m² in Bulgaria or Denmark and above 500 kWh/m² in Belgium, Italy or Slovakia,
with the average EU consumption reaching 360 kWh/m².
All these elements are taken into account when simulating the impact that some policy measures could
have on energy consumption and are featured in an interactive data mapping tool5. Moreover, reports6
briefly describing the building stock and other framework conditions (rate of new building construction,
documentation of previous refurbishment activities, U-values, age of buildings, geometry, energy
efficiency class, type of use, etc.) in each target country are available for consultation on the ENTRANZE
website.
Profile of stakeholders: behaviour, preferences and interests
A picture of the EU building stock would not be fully complete without looking at the human factor.
This section investigates the structure of stakeholders, user and investor groups and their behaviour,
preferences and interests in nine target countries. These preferences relate to their willingness to invest in
improving the energy performance of their dwellings through renovation. These behaviour patterns are
important when developing successful policies because stakeholders react differently to policy measures
and because behaviour-based energy saving programmes are the next natural step in achieving our
energy demand-reduction targets. While primary data pertains to the countries mentioned above, the
analysis of barriers and decision criteria indicated that differences in barriers and drivers are in many
cases greater between building owner groups than between countries.
Our research7 further pointed to some differences between countries, as well as between owner
types, when considering their decision-making processes regarding energy saving measures targeting
buildings. Mapping the decision-making processes of stakeholders requires a series of intertwined factors
such as the structures of ownership, building types and level of professionalism with which buildings are
managed. Research also highlights the existence of stakeholder-specific barriers and drivers which play a
significant role in the decision-making process.
The barriers to energy renovation which need to be taken into account vary from financial considerations
to organisational problems. Co-ownership of multi-family buildings is an issue that needs more attention
because the measures taken so far to encourage energy renovation have proven to be ineffective.
Owners are put in the situation of having to take collective decisions that might affect them in different
ways. Before dealing with the lack of incentives, large-scale energy renovation plans should address
5
More information on the tool in the following chapter and at http://www.entranze.eu/tools/interactive-data-tool
6
http://www.entranze.eu/pub/pub-data
7
Documentation on this topic can be further consulted at: http://www.entranze.eu/pub/pub-policies
10 | Laying down the pathways to nearly Zero-Energy Buildingsorganisational issues by putting in place step-by-step technical and organisational support moderated by
external and unbiased professionals. Of course the situation with different types of stakeholders creates
different conditions for the decision-making process but, overall, high initial costs and perceptions of a
long payback time are common barriers.
A wide variety of criteria upon which stakeholders base their decisions concerning energy investments
was also considered. Country case studies demonstrate that almost all building owners prioritise the
initial cost in their decision-making process. This is due both to the lack of reliable and accessible financial
analysis and to genuine uncertainties about other financial indicators for which there are no guarantees.
On the other hand, energy cost savings and, even more so, improved comfort are major drivers of
renovation in several countries. But by adding government support programmes into the mix there is a
possibility to influence even more the type and scope of energy improvements.
The differences in ownership structure are still much greater in multi-family buildings. This variety
is displayed below and highlights the fact that some countries have a predominant share of owner-
occupancy in apartment buildings (Table 1). Moreover, the structure of decision-making within owner-
occupied apartment buildings varies greatly.
Table 1 Share of owner-occupancy in multi-family housing and required majorities for decisions
Share of
owner- Required majority
Type of
occupied, % for decisions on Other factors influencing renovations
ownership8
of multi-family renovations, %
dwellings
Mandatory renovation fund usually not big
>50% of shares,
Austria 23 unitary system enough. Joint loans have a big administrative
but minority rules
burden.
Almost all buildings do not have a
condominium
homeowners’ association. When no
Bulgaria 90 ownership/ >67% (of area)
homeowners’ association exists, each owner
unregulated
needs a separate loan.
Czech condominium Banks usually require that all apartment owners
79 >75% of votes
Republic ownership mortgage their apartments for the loan.
Mandatory renovation fund (1% of value of
condominium
Germany 24 >50% of shares building). Taking out a loan can require a
ownership
mortgage by all residents.
housing
The housing company can take out a loan of its
company (similar
Finland 50 >50% of shares own, once the majority of owners have agreed
to unitary
to it.
system)
condominium Taking out a loan can require a mortgage by all
France 26 >50% of shares
ownership residents.
>50% of shares Dissenters can move to delay the
condominium
Italy 65 (for energy implementation of decisions with significant
ownership
investments) financial consequences.
condominium Taking out a loan can require a mortgage by all
Romania 96 >67%
ownership residents.
Can be less for renewable energy (1/3), but
condominium those voting against cannot be charged.
Spain 86
ownership
> 50% of shares
Taking out a loan can require a mortgage by all
residents.
8
The unitary system refers to an undivided apartment building, in which owners own shares. Condominium ownership refers to a system where the
owners own their dwelling and all owners jointly own the common parts and the land (Lujanen 2010).
Laying down the pathways to nearly Zero-Energy Buildings | 11Considering these discrepancies in decision-making processes, possible solutions for dealing with these at the policy making stage are suggested. For example, the engagement of owner-occupants is necessary and further legislation should be drafted in this regard. But in order to really improve the current situation there is a need for a combination of well-designed advice schemes and the establishment of local and regional networks of qualified service providers. Furthermore, public advice should be strengthened through public-private finance schemes which at this moment pose a problem. Currently, owners do not consider investing in renovation due to the long return rates with no guarantees. However, financial support schemes are only part of the solution, because they must be mixed with advisory services, technical support and supplier certification in order to give particularly good results. Moreover, policy measures should take advantage of “windows of opportunity” such as a change of ownership, the end of a tenancy, or when other work is being done on a property. Timing is of the utmost importance in planning renovations. Cost-optimal analysis of renovation solutions towards nZEB standards The research carried out within this project includes a comprehensive analysis of cost optimal renovation levels of residential and public sector buildings. To be consistent with the EU process of the EPBD implementation (Directive 2010/31/EU), the research adopted a comparative methodology framework established by the European Commission to calculate cost-optimal levels of minimum energy performance requirements. For each building type in the different countries, cost-energy curves (representing global cost versus (net) primary energy demand of a large variety of renovation options) were established and thoroughly assessed, based on a selection of renovation packages leading to cost-optimal and nZEB levels (covering both energy efficiency measures and renewables). One of the main outcomes of this research, the Report on Cost-Energy curves calculation9, presents an assessment of curve sensitivity with respect to the main economic input data and the calculation period. The report analyses possible targets of (net) primary energy demand relating to cost-optimal and nZEB solutions. From a deep analysis of all cost-energy clouds, complete refurbishment solutions were selected, suitable for the considered energy performance targets. To generate the cost-energy clouds, a major effort was made to pull together all the required data. An important number of national experts contributed to the definition of reference characteristics for buildings. For each target country a technology choice was made for the building envelope and building system, taking into account widespread renovation practices. For each considered technology, a cost database was built10. Another database11 was also set up containing all techno-economic data of technologies and building solutions variants, including 20 to 30 packages of energy efficiency measures selected according to cost- optimal calculations. These energy-cost matrices allow a comparison in terms of the initial investment cost and (net) primary energy consumption of the most suitable packages of energy efficiency measures for each climate and building type. The results of cost-optimality calculations were used to define the level of light, medium and deep renovation as renovation options in the model-based scenario development, where deep renovation corresponds to a level which is in the minimum energy zone (i.e. could represent the nZEB standard), medium is in the cost-optimality zone and light represents current practice. Hence, for every target country and building type, the main results consist of the definition of possible targets of (net) primary energy representative of the “cost optimal” (a) and “nZEBs” (b) solutions for 9 http://www.entranze.eu/files/downloads/D3_3/131015_ENTRANZE_D33_Cost_Energy_Curves_Calculation_v18.pdf 10 Cost Tool accessible at http://www.entranze.eu/pub/ pub-optimality 11 http://www.entranze.eu/pub/pub-optimality 12 | Laying down the pathways to nearly Zero-Energy Buildings
building renovation. In addition to these two energy/costs targets, two further levels (c and d) of possible
renovation were defined and expressed as fixed percentages of reduction in (net) primary energy with
respect to the base refurbishment level12 with minimum performance thresholds. More precisely, the
following four targets were considered:

a. Minimum global cost: possible cost-optimal target,

b. Minimum (net) primary energy: possible nZEB target,

c. 50% of reduction of (net) primary energy with respect to base refurbishment level with a threshold of
   100 kWh/(m2y),

d. 75% of reduction of (net) primary energy with respect to base refurbishment level with a threshold of
   50 kWh/(m2y).

For each target a complete refurbishment solution was selected, which corresponds to one building
variant among all calculated ones (in other words, to one dot in the cost/energy clouds developed) like
in the example below.

                                                                    GLOBAL COST/PRIMARY ENERGY CLOUD
                                2500

                                2250

                                2000
 Global Cost -30 years (€/m2)

                                1750

                                1500

                                1250
                                                                                                  base refurbishment
                                       nZEB zone

                                1000                                                                     level
                                                              Cost Optimal Zone
                                750

                                500

                                250
                                       0           50       100     150    200     250     300     350      400     450     500      550

                                                        (net) Primary Energy for heating, cooling, DHW, lighting,
                                                            ventilation and auxiliary systems (kwh/m2/year)

Figure 2. Example of cost/energy cloud with some target zones indicated

12
     The base refurbishment level (BRL) corresponds to the adoption of renovation measures only for aesthetic, functional and safety reasons of the
     same building components considered for renovation packages. In BRL the old generators and systems are replaced by components with the same
     technology and with the efficiency of the current state of the market.”

                                                                                  Laying down the pathways to nearly Zero-Energy Buildings | 13
Following this analysis we can spot some very general lessons learned in all countries and for all types of
buildings.
In general, the minimum global cost zone is characterised by a medium level of efficiency for envelope
strategies, probably due to a better balance between initial investment costs and energy savings. The
cost-energy curve is very flat in the cost-optimality area. This means that the cost-optimality criteria
as such generates only a moderate stimulus to increase the requirements of the building codes, if not
solutions in the left part of the cost-optimal zone are selected. Thus, it is highly important to shift the
requirements to the left hand side of the cost-optimality zone in order to provide a real impact on the
energy performance of buildings with no or very limited additional costs.
For the single family houses it is quite evident that, also within the minimum global cost zone, the
penetration of renewable energy technologies is more effective in Mediterranean climates (characterised
by higher solar radiation) than in other target countries. A similar trend applies to office buildings, but
with fewer differences between the South and North of Europe. This is due to a more relevant role played
by photovoltaic systems in a building type characterised by higher electricity consumption for auxiliary
systems and mechanical ventilation.
Furthermore, net primary energy saving percentages for cost-optimal and nZEB targets are closer
together in residential buildings than in office and school buildings. Multi-family houses show lower
energy saving potential in respect to single houses, due to geometric limits (e.g. lower available roof
surface for solar systems with respect to total floor area relative to a single house).
In many cases, the global costs of selected nZEB solutions (minimum net primary energy) are lower and
more advantageous than global costs of corresponding base refurbishment levels. Generally, for the
buildings selected in the cost-optimal zone and the nZEB zone, the initial investment costs are higher
with respect to base refurbishment levels. This means that the building with a minimum global cost (over
a time lapse of 30 years) and a higher initial investment energy savings, plays a fundamental role.13
The research developed in order to improve the cost-optimal methodology is also meant to provide
input for the next recast of the EPBD and to push for more innovation on the subject. This topic is further
developed in Part IV of this study which gives some guidance to all relevant stakeholders.
13
For more details on the cost-optimal methodology and the results of the calculations consult http://www.entranze.eu/pub/pub-optimality
14 | Laying down the pathways to nearly Zero-Energy BuildingsPART II:
TOOLS AND MODELS
During the ENTRANZE project several databases and tools were developed in order to
facilitate a quick, easy and tailor-made access to national and comparative international
indicators. The databases and modelling tools can also act as a comprehensive basis for
decision-making processes both for policy makers and other stakeholders.
As such three tools were developed:
• The Data Tool14: contains an in-depth description of the characteristics of buildings and related
energy systems in the EU-28 and Serbia.
• The Cost Tool15: is a powerful, flexible instrument to analyse the impact of a large number of
renovation packages for specific building types in terms of costs and primary energy demand.
• The Online Scenario Tool16: provides the results of alternative scenarios for the development of the
building stock and its energy demand in the EU-28 (+ Serbia) up to 2030.
14
Available at http://www.entranze.eu/tools/interactive-data-tool
15
Available at http://www.entranze.eu/tools/cost-tool
16
Available at http://www.entranze.eu/tools/scenario-results
Laying down the pathways to nearly Zero-Energy Buildings | 15Data Tool – Mapping the EU building stock As described in the first part of this report, the required background data was strongly built on existing studies and surveys from statistical offices. The EU-wide typology includes data for building construction characteristics and installations in the residential buildings, which is a valuable source of initial data for further generalisation and the energy assessment of the building stock. For instance, building typology and climatic data were used to carry out detailed building related analyses and investigations of the cost- optimal levels of nZEB technologies. Maybe the key function of this tool was the support for the policy assistance process and the role it played in communicating results to various stakeholders. In the end the tool depicts a clear picture of the European building stock. Figure 3. Data Tool showing total unit consumption per m2 in buildings 16 | Laying down the pathways to nearly Zero-Energy Buildings
Cost Tool – Defining a cost/energy balance
This spreadsheet allows assessment of the policy impact of renovation packages in existing buildings,
by cost/energy curves and clouds. This tool focuses on building renovation and provides a comparative
analysis expressed as a dot plot (cloud) graph of global cost versus (net) primary energy of various
renovation options. It produces both graphical and numerical outputs.
Furthermore, the Cost Tool considers different variables in its calculations of the cost/energy cloud for
a specific building in different climatic contexts. These variables range from choosing the timeframe,
taking into account different economic perspectives and allow a comparison of primary energy with the
minimum limits for energy performance requirements in force.
The tool also integrates default energy price scenarios over the period of calculation in the different
countries considered within the cost-optimality calculations of the project. Moreover, compiled data set
files are provided containing all input data of the reference buildings for the various climate conditions
considered within the cost-optimality calculation.
GO TO USER
GUIDE
index matrix 1 3 4 5 6 7 8 9
INITIAL COST
PACKAGES BUILDING TECHNOLOGY SHORT DESCRIPTION PARAMETER VALUE UNITS CODE MATERIAL COSTS + LABOUR COSTS + BUSINESS PROFIT
REMOVE AND DISPOSAL COST INITIAL COSTS
+ GENARAL EXPENDITURE
€/unit units quantity € €/unit TOT R&D rb
Renovation of the exterior layer of the walls
External Wall (plaster or tile or ...) for U 1.22 W/m2K 1_1_W 33.52 €/m2 164.51 € 5,514.92 € 11.69 € 1,923.17 € 7,438.09
aesthetic/functional/security reasons
1 Roof No renovation U 1.67 W/m2K 1_1_R 0.00 €/m2 72.30 € 0.00 € 0.00 € 0.00 € 0.00
2 2
Basement No renovation U 1.69 W/m K 1_1_B 0.00 €/m 72.30 € 0.00 € 0.00 € 0.00 € 0.00
10cm insulation -External insulation (EIFS
External Wall U 0.3 W/m2K 1_2_W 70.30 €/m2 164.51 € 11,564.69 € 0.00 € 0.00 € 11,564.69
System)
OPAQUE ENVELOPE
15cm insulation - Add on a thermal
2 Roof insulation layer over the last slab in contact U 0.23 W/m2K 1_2_R 34.45 €/m2 72.30 € 2,490.44 € 0.00 € 0.00 € 2,490.44
with unconditioned space
5cm insulation - Install a layer of thermal
2 2
Basement insulation bellow the slab in contact with U 0.54 W/m K 1_2_B 50.55 €/m 72.30 € 3,654.72 € 0.00 € 0.00 € 3,654.72
the basement
15cm insulation -External insulation (EIFS
External Wall U 0.22 W/m2K 1_3_W 78.55 €/m2 164.51 € 12,922.61 € 0.00 € 0.00 € 12,922.61
System)
20cm insulation - Add on a thermal
3 Roof insulation layer over the last slab in contact U 0.18 W/m2K 1_3_R 44.95 €/m2 72.30 € 3,249.86 € 0.00 € 0.00 € 3,249.86
with unconditioned space
10cm insulation - Install a layer of thermal
Basement insulation bellow the slab in contact with U GLOBAL
0.32 COST/PRIMARY
W/m K 2
1_3_B 57.91 ENERGY
€/m CLOUD
72.30 2
€ 4,187.02 € 0.00 € 0.00 € 4,187.02
the basement
3000
20cm insulation -External insulation (EIFS 2 2
External Wall U 0.17 W/m K 1_4_W 86.80 €/m 164.51 € 14,280.53 € 0.00 € 0.00 € 14,280.53
System)
2750
30cm insulation - Add on a thermal
4 Roof 2500
insulation layer over the last slab in contact U 0.12 W/m2K 1_4_R 65.96 €/m2 72.30 € 4,768.70 € 0.00 € 0.00 € 4,768.70
with unconditioned space
Global Cost -30 years (€/m2)
2250
2000
1750
1500
1250
1000
750
500
250
0
50 100 150 200 250 300 350 400 450 500 550 600 650
(net) Primary Energy for heating, cooling, DHW, lighting, ventilation and auxiliary systems (kWh/m2/year)
MILAN (IT)-Residential-2011-Financial-Standard private-Energy Scenarios:reference Cost Optimal Zone
Base refurbishment level - - - Encouraged target of Primary Energy
Figure 4. Illustration of the Cost Tool
Laying down the pathways to nearly Zero-Energy Buildings | 17Online Scenario Tool – From design to implementation This tool presents model-based scenario results about the future energy performance improvement and RES-H/C in the EU building stock while also assessing the corresponding costs, expenditures and benefits. The overall objective of the scenario development was to analyse the effects of different policy packages on the diffusion process and the building-related energy demand, taking into account economic, technical, non-technical and institutional barriers and rebound-effects. The scenarios were developed up to 2030 with a particular focus on the year 2020, according to the targets set by the EPBD (recast), the RED17 and the EED18. The national policy scenarios were defined according to the specific needs, ideas and suggestions of the policy makers and stakeholders included in the national discussion processes that took place at every key stage of the project in the target countries. The scenario calculation was done by a coupling of the well-established models POLES19 and INVERT/EE- Lab20. Thus, POLES delivered the projection of key input data concerning the overall energy system like end-user energy prices and of the power mix, so as to derive the average primary energy and emission factors of power generation in each country (respectively, toe/kWh and gCO2/kWh). Invert/EE-Lab was used to derive scenarios for the space heating, hot water cooling and lighting energy demand scenarios and corresponding technology mix. Figure 5. Illustration of the Online Scenario Tool 17 Directive 2009/28/EC of the European Parliament and of the Council of 23 April 2009 on the promotion of the use of energy from renewable sources and amending and subsequently repealing Directives 2001/77/EC and 2003/30/EC 18 Directive 2012/27/EU of the European Parliament and of the Council on energy efficiency, amending Directives 2009/125/EC and 2010/30/EU and repealing Directives 2004/8/EC and 2006/32/EC, 2012. 19 The POLES model provides a complete system for the simulation of world energy demand and supply and can be used for the long-term economic analysis of energy markets, power sector investments or sectorial impacts of climate change mitigation strategies. The model is driven by two macro-economic parameters as inputs (regional GDP and population growth) and provides forecasts for regional and sectorial energy balances, energy prices and key energy and economic indicators. 20 The model INVERT/EE-Lab has been used in several European and national projects for scenario analyses of the RES-H/C sector in various EU coun- tries. The model is based on a detailed disaggregated description of the building stock and its heating, cooling and hot water systems. 18 | Laying down the pathways to nearly Zero-Energy Buildings
PART III:
POLICY ANALYSIS: STATUS-QUO
AND SCENARIOS
The starting point for deriving recommendations was a thorough analysis of the status
quo of energy efficiency policies in the building stock and in particular the related
implementation of the EPBD, RED and EED in different Member States. A special focus was
put on the nZEB national plans according to Article 9 EPBD. This led to a comprehensive
report entitled “Overview of the EU-27 building policies and programmes and cross-
analysis on Member States’ nZEB plans”21.
One of the main objectives of ENTRANZE was to elaborate policy packages for the target
countries. These packages were created within policy groups22 and analysed in scenarios
derived by the model Invert/EE-Lab. The results were played back to the policy groups
and revised according to the discussions. The resulting scenarios and corresponding
discussions were a key element for deriving recommendations.
In the following chapters the nZEB plans of Member States are summarised; secondly
an overview of scenario results and derived recommendations in the target countries is
given; and finally the scenario results for EU 28 are described.

nZEB plans: definitions and instruments
The approaches in defining the nZEB targets (i.e. the interim target by 2015 and the 2020 target) vary
largely among the national plans. Some EU MS define nZEB in terms of minimum energy performance
requirements (e.g. Brussels Region-Belgium, Cyprus and Denmark), other MS decided to set requirements
on the basis of energy labels (e.g. Bulgaria, Lithuania, Czech Republic). In some cases, the nZEB national
definitions include additional minimum requirements for the renewable energy share (e.g. Bulgaria,
France and Cyprus), while in a few countries the nZEB target is defined as the minimum requirement for
carbon emissions of the building (e.g. the United Kingdom and Ireland, the latter having two indicators,
one on carbon emissions and the other on energy consumption). Furthermore, in several national plans,
the nZEB targets are based on or compared to the cost-optimal levels resulting from the implementation
of Art. 3 from the recast of the EPBD.

A summary of cost-optimal calculations and nZEB approaches in the ENTRANZE target countries is
provided in chapter 5 of the ENTRANZE report “Policies to enforce the transition to nZEB: Synthesis report
and policy recommendations from the project ENTRANZE”.

14 Member States had published the national plan by October 2013, and only 12 MS did so in the English
language23. These plans have been evaluated in terms of policies and instruments. All MS include in their

21
   Available at http://www.entranze.eu/pub/pub-policies
22
   “Policy groups” have been set up in all target countries. Members have been political decision makers and relevant experts. They met regularly and
   contributed to all project-phases, especially to the policy sets and to the recommendations.
23
   Belgium, Bulgaria, Cyprus, Denmark, Finland, Germany, Ireland, Lithuania, the Netherlands, Slovak Republic, Sweden and the UK

                                                                   Laying down the pathways to nearly Zero-Energy Buildings | 19
national nZEB plans measures to support the renovation of the existing building stock. These measures
vary from one country to another and include one or more of regulatory, economic (and financial), Energy
Performance Certificates (EPCs), information and advice, educational and training or demonstrative
measures. To enrich and structure the discussion about policy instruments ENTRANZE provided a toolbox
of policies and described various types of instruments and their main characteristics (see chapter 5 of
“Policies to enforce the transition to nZEB: Synthesis report and policy recommendations from the project
ENTRANZE”.
The instruments and measures listed in the national plans do not mainly focus on nZEB, but on energy
efficiency in the building sector in general. The majority of these measures will be reasonable steps
towards more nZEB in the future. However, by October 2013 only three out of 12 MS reported measures
and activities suitable for increasing the energy performance of buildings towards the nZEB standard
(Belgium, the Netherlands, and Germany). In most of the plans evaluated, the measures named so far
will not be sufficient to increase the number of nZEB significantly. Some instruments might even create
lock-in effects that hamper the transformation of buildings toward nZEB. The latter may happen if
the refurbishment of buildings is supported without a clear requirement to meet certain high energy
standards.
The full and more detailed results are documented in the ENTRANZE reports “Policy pathways for reducing
energy demand and carbon emissions of the EU building stock until 2030”24 and “Policies to enforce the
transition to nZEB: Synthesis report and policy recommendations from the project ENTRANZE”.
Scenario results for target countries
The following pages summarise the key results and recommendations for each target country. The results
and policy recommendations below were derived from the modelling exercises conducted within the
ENTRANZE framework and consider input data from the tools already mentioned and the discussions
within the policy and expert dialogues.
The description of country results below shows that policy sets chosen by the ENTRANZE target countries
differ widely according to the country-specific needs and their current political framework. For each
target country, three specific policy sets have been developed. The first policy scenario reflects more or
less a business-as-usual scenario with implementation of the existing policy framework. The second and
third include a more innovative and more ambitious implementation of policies leading to a stronger
reduction of energy demand, a higher share of deep (“nZEB”)25 renovation and faster reduction of CO2-
emissions due to a stronger penetration of RES-H technologies. Since the three policy sets derived are
based on very concrete policy suggestions and stakeholder discussions, they should definitely not be
understood to be the maximum possible ambition level. Instruments from various categories have been
investigated in the different scenarios. Many countries included information and/or coaching of building
owners in their policy sets. Also the tightening of the building code and the enhancement of the financial
support have been selected in many cases.
Examples for innovative instruments selected for model-based analysis are:
• Energy efficiency dependent property tax (AT),
• Energy and/or CO2 taxation (FI, FR),
• Mandatory renovation in case of real estate transaction, energy refurbishment obligation (FR, ES),
• Implementing enforcement and compliance measures (DE),
• RES-use obligations (DE, IT).
24
Available at http://www.entranze.eu/pub/pub-scenario
25
The term “nZEB” renovation is not yet clearly and unambiguously defined. In “Overview of the EU-27 building policies and programmes and cross-
analysis on Member States’ nZEB plans”, an approach with different layers of “nZEB” renovation is proposed. In ENTRANZE, we followed this idea by
taking into account the results from the cost-optimality calculations for defining different levels of renovation, including an ambitious one, which
could be called “nZEB” renovation.
20 | Laying down the pathways to nearly Zero-Energy BuildingsIt can be seen that different types of instruments have been selected for further analysis. Instruments
focusing on information and the coaching of building owners in a new dimension are among the most
often taken into consideration. Regulatory instruments considered for recommendation are, besides
tightening the building code (ES), instruments implementing mandatory renovations (ES, FR). Economic
instruments mentioned are tax-based as well as grants and soft loans. Among the tax-based instruments
are the increase of the energy tax or the implementation of a CO2-tax (FR) as well as tax deductions (IT).
Another important group of instruments are cross-cutting instruments. Examples are the introduction of
a scheme for nZEB renovation of public buildings (RO) and the implementation of a long-term dialogue
between relevant stakeholders (CZ). Recommendations that are applicable for all Member States are
presented in more detail in the following pages.
We can see that the maximum reduction of final energy demand reached in the more ambitious policy
sets 3 in 2030 compared to 2008 is about one third. Moderate ambitions in most countries only lead to
energy savings from 2008-2030 below 23%, and in four out of five target countries even below 15%.
Ambitious instruments as usually chosen in Policy Set 3 are needed to reach significant reductions of
final energy demand of the building sector. However, since for some countries no clear policy targets are
available, it is not clear whether policy set 3 may lead to achieving ambitious long-term targets. Rather, at
least for some countries we consider that even policy set 3 is not sufficient.
Austria AT
All nine federal states in Austria, which have the main responsibility for building
codes and RES-H, have implemented substantial, mostly financial support
programmes for residential building construction. Within these programmes, the application of energy
efficiency criteria has increased in recent years. Moreover, efforts to harmonise building codes have led
to some progress and also to a joint agreement on the national nZEB action plan. However, despite these
efforts and a substantial increase of RES-H in some regions, building renovation activities have remained at a
moderate level for years.
The Austrian policy group decided to investigate the potential impact of innovative policy packages mainly
based on the following elements, in addition to the existing ones:
• A property tax depending on the energy efficiency of buildings;
• Intensified coaching of building owners before and during a thermal building retrofit;
• Innovative financing of thermal building retrofit by initiating public/private funds providing the financial
support for building renovation at low interest rates. Partly, increased tax revenues from the property tax
could also be used as a source for this fund.
Three model-based scenarios were developed: (1) a business-as-usual (BAU) scenario with the current schemes
remaining constant, (2) a scenario with a new policy approach described above, however, with a low intensity
and (3) a new policy approach with a higher policy intensity.
Figure 6 shows the results of the ENTRANZE policy scenario modelling. While the BAU scenario leads to about
20-24% reduction of final energy demand and almost 25-30% of delivered energy demand (under moderate
and high energy prices) from 2008-2030, the additional measures in scenario 2 induce only a very moderate
additional reduction of energy demand. Thus, new policies as such do not guarantee substantial progress. They
have to be designed and implemented in an ambitious way. The third scenario indicates a significant increase
of renovation activities and related energy performance. However, it has to be taken into account that the
Laying down the pathways to nearly Zero-Energy Buildings | 21implementation of a property tax related to the energy efficiency of buildings would require a comprehensive
building registry and corresponding energy performance certificate registry. Thus, corresponding activities
have to be enhanced. Moreover, there is a need for further work and the elaboration of coaching of building
renovation activities. Corresponding pilot projects should be intensified. The options on how to initiate funds
to finance building renovation needs to be investigated more concretely. Although building codes and the
regulatory framework were not the focus of the scenario work, the comparison with other countries revealed
that the Austrian nZEB definition is not at the forefront of the European standard. Thus, stricter regulatory
measures would be required to achieve ambitious long term climate and energy policy targets.
120,000
Gas Electricity Oil District heating Coal Biomass Solar Ambient energy
110,000
100,000
90,000
80,000
70,000
60,000
50,000
40,000
30,000
20,000
10,000
GWh
0
2008 2020 2020 2020 2030 2030 2030
BAU Moderate Ambitious BAU Moderate Ambitious
Figure 6. Building energy demand for space & water heating. Austria, high price scenario
Bulgaria
BG
The building stock in Bulgaria has had a very high level of energy consumption
for heating and also for cooling in the recent years. First legislative initiatives
for heat energy conservation were introduced in 1961, strengthened for the panel buildings in 1979
and for all buildings subsequently in 1987, 1999, 2004 and 2009. The official approval of the national
definition for nZEBs and an additional increase in the energy efficiency requirements for new buildings
and also in the event of a major renovation are expected by the end of 2014. The economic incentives to
support the national policy for energy efficiency and the use of RES in the building sector up to now were
limited mainly to public buildings and multi-family apartment blocks. The current legislation does not
address barriers relating to the renovation of condominiums.
The main issues discussed during the policy group meetings were related to problems of the renovation
process (such as the quality of the renovation work) and the importance of introduction of green building
design practices and principles into the national legislation. The issues of financial support and incentives
for the renovation of buildings were also highlighted as a critical factor for accelerating the rate of
rehabilitation of the existing stock. The main focus of the policy sets were on the existing building stock
and how to ensure good quality and quantity of renovated buildings.
22 | Laying down the pathways to nearly Zero-Energy BuildingsThe Bulgarian ENTRANZE Policy Group elaborated the following policy principles to be proposed for the
national policy for the building sector:
• Introduction of building codes with stronger requirements for energy performance characteristics
and use of RES in one stage in 2015 or in two stages – in 2015 and in 2020.
• Ensuring financial support – the use of currently available local, national and EU funds and in addi-
tion the mobilisation of public private partnership initiatives (ESCO and others), soft bank loans and
further tax reduction measures. As the Bulgarian government decided to implement a white certifi-
cate scheme and it is stated in the draft energy law, the effective employment of the system of energy
saving obligations for the energy suppliers was also considered to be an important financial factor
and stimulus. The white certificates for measures in the building sector could provide additional fi-
nancial resources for renovation of the existing building stock.
• Capacity building and training for professionals were also proposed to guarantee the quality of
the construction and installation process and ensure sustainability of the results.
• Information and awareness rising campaigns are important to overcome many market barriers for
some modern and advanced technologies and to ensure the good quality of renovation work.
Figure 7 shows the results of the ENTRANZE policy scenario modelling for Bulgaria. Compared to the existing
policy scenario (PolSet1), the “medium term policy” scenario (PolSet2) and “policies in two steps+” (PolSet3)
show good results for the period up to 2030. It is expected that less electricity will be used for heating
and DHW as the share of natural gas, solar thermal and ambient heat will increase. The scenarios foresee
investments between EUR 6 and EUR 14 billion in the building sector for the period 2030.
30,000
Gas Electricity Oil District heating Coal Biomass Solar Ambient energy
28,000
26,000
24,000
22,000
20,000
18,000
16,000
14,000
12,000
10,000
8,000
6,000
4,000
2,000
GWh
0
2006 2020 2020 2020 2030 2030 2030
LOW Medium High LOW Medium High
Figure 7. Building energy demand for space & water heating. Bulgaria, high price scenario
The policy recommendations for Bulgaria include the introduction of building codes with stronger
requirements for energy performance characteristics and use of RES for new buildings and also in the event
of major renovation. This should be implemented in two phases in 2015 and in 2020. The financial support
from the EU funds is limited and additional resources should be mobilised – national funds, private resources
(through public private partnership) and bank resources (soft loans), as tax reductions are a workable option
which are already giving some results. Important policy instruments are related to ensuring the quality of
renovation, and information and awareness-raising campaigns targeted at the relevant stakeholders.
Laying down the pathways to nearly Zero-Energy Buildings | 23You can also read