ESG and Material Efficiency Perspective for Investors - Presentation by Céline Méchain for the WMF 17-19th June 2021

Page created by Chester Weber
 
CONTINUE READING
ESG and Material Efficiency Perspective for Investors - Presentation by Céline Méchain for the WMF 17-19th June 2021
ESG and Material Efficiency Perspective for Investors

Presentation by Céline Méchain for the WMF
17-19th June 2021
ESG and Material Efficiency Perspective for Investors - Presentation by Céline Méchain for the WMF 17-19th June 2021
Avertissement

Le présent document ne doit pas être interprété comme une offre de vente ou une proposition d'achat de titres dans toute juridiction
ou une telle offre ou proposition serait illégale. Nous ne sollicitons aucune action sur la base du présent document, qui est fourni à
titre d'information uniquement et de portée générale. Il ne constitue pas une recommandation et ne tient pas compte des objectifs
d'investissement, de la situation financière et des besoins de chaque client. Avant d'agir en fonction du contenu du présent document,
nous vous conseillons de vérifier s'il est adapté à votre situation particulière et, si nécessaire, de prendre conseil auprès d'un
professionnel.

Nous ne fournissons pas de conseils juridiques, comptables ou fiscaux à nos clients et recommandons à tous les investisseurs de
consulter leur conseiller fiscal, comptable ou juridique pour tout investissement envisagé.

Le présent document est basé sur des informations que nous jugeons fiables mais nous ne pouvons garantir qu'elles sont exactes,
exhaustives et/ou à jour et elles ne doivent pas être considérées comme telles. Les opinions exprimées dans le présent document
sont nos opinions les plus récentes à la date du présent document seulement. Sauf stipulation contraire, elles ne représentent que
l'opinion des rédacteurs et non pas celle de Goldman Sachs.

Les prix et valeurs mentionnés dans le présent document, ainsi que les revenus qui en découlent, peuvent fluctuer à la baisse comme
à la hausse et les investisseurs peuvent subir des pertes sur tout ou partie de leur investissement. Les performances passées ou
simulées ne sont pas une indication de la performance future. Les rendements futurs ne sont pas garantis et les investisseurs
peuvent perdre tout ou partie du capital investi. Les comparaisons et simulations présentées vous sont données uniquement à titre
illustratif afin de servir de base de discussion.

Les transactions présentées peuvent être notamment exposées aux risques suivants : liquidité, taux d’intérêt, crédit, capital et de
contrepartie.

Aucune partie du présent document ne saurait être (i) copiée, photocopiée ou polycopiée de quelque manière que ce soit ou (ii)
redistribuée sans notre accord écrit préalable.

Further disclosure information available on https://research.gs.com/disclosures/hedge.html#/general/equity

                                                                                                                                    2
ESG and Material Efficiency Perspective for Investors - Presentation by Céline Méchain for the WMF 17-19th June 2021
Growing awareness of Investors around
Environmental Challenges, Carbon Emissions,
Climate Risks and Scarcity of Planet Resources
                          Global Natural Disasters                                                                                           Social Preferences

    Consequences of global natural disasters from 2000 to 2019 1
                                                                                                               Growing interest by various demographic groups to incorporate ESG in
                                          +81%                                                                                          investment decisions
                                                                       4.0bn
             $3.0trn                      increase in
        $    Economic
             Losses
                                          losses vs.
                                          previous
                                                                       people
                                                                       injured or
                                                                       displaced
                                          period                                                                                               General Population
                                                                                                                                                                            85%
                                                                                                                                  71%                    75%
                                                                                                                                                                            36%
                                                                                                                                  52%                    52%
             The “Green Deal” in Europe (Dec-2019)                                                                                19%                    23%
                                                                                                                                                                            49%

                                                                                                                                 2015                    2017               2019
         Largest Economic stimulus since the Marshall Plan
                                                                                                                                                    Millenials
         €7 trillion total investments needed by 2050E                                                                           84%                    86%
                                                                                                                                                                            95%
                                                                                                                                                                            25%
         €1.85 trillion secured by the EU Recovery Package                                                                       56%                    48%
                                                                                                                                                                            70%
                                                                                                                                  28%                    38%
         Acceleration of National Energy Plans through Covid-19
          crisis                                                                                                                 2015                    2017               2019
                                                                                                                                 2015                    2017               2019
                                                                                                                                       Very Interested         Somewhat Interested

                                                                                                                          Interest in sustainable investing continues to grow
         c.$5 of GDP by 2020 for every $1 of capex invested in                                                                 amongst both millennials and the general
          energy transition3                                                                                                                    population

         First benefits expected in 2022/2023

Sources: PRI, U.S. Trust Wealth and Worth Survey, GS Research.
Notes: 1 UNISDR, Human cost of disasters, Oct-2020. 2 $1,600 billion over the 1980-1999 period. 3 IRENA: International Energy Agency

                                                                                                                                                                                      3
ESG and Material Efficiency Perspective for Investors - Presentation by Céline Méchain for the WMF 17-19th June 2021
Introduction to the EU Taxonomy
                      EU Sustainability Taxonomy Regulation (June 2020)

      In June 2020, the EU's Sustainability Taxonomy Regulation was formally adopted
       — Provides an EU-wide framework for classifying economic activity as environmentally sustainable
       — Expected to reduce “greenwashing”, where financial products are marketed as environmentally sustainable without sufficient factual basis for their claims
      The objective of the EU Taxonomy is to encourage capital flows to green activities by enabling investors to identify:
        — Companies that fall under the scope of the Non-Financial Reporting Directive will have to disclose:
              –    The proportion of turnover from activities aligned with Taxonomy
              –    Capex and opex associated with Taxonomy-aligned activities
        — The first company reports and investor disclosures using the EU Taxonomy are due at the start of 2022

             1                                                                                       2       Do no significant harm to any of the other five
                                                                                                              environmental objectives, where relevant
                  Substantially contribute to at least one of the six
                  environmental objectives:

                       1. Climate change mitigation -- adopted by 2020YE and                         3
                          enter into application by 2021YE                                                  Comply with minimum social safeguards:
                                                                                                           — UN Guiding Principles on Business & Human Rights –
                       2. Climate change adaptation                                                           including 8 conventions of ILO1‘s Fundamental Rights &
                       3. Sustainable use and protection of water & marine                                    Principles at Work; and International Bill of Human Rights
                          resources – rest adopted by 2021YE, apply 2022YE                                 — OECD Guidelines on Multinational Enterprises
                       4. Transition to circular economy, waste prevention &
                          recycling
                       5. Pollution prevention & control                                              4      Comply with quantitative or qualitative Technical Screening
                       6. Protection of healthy ecosystems                                                    Criteria: quantitative technical screening criteria will be
                                                                                                              tightened over time for CO2 intensity metrics which trend
                                                                                                              towards zero by 2050

                                                               Currently covered in EU Taxonomy; Other objectives are to be covered at a later date

Note: 1 International Labour Organization

                                                                                                                                                                            4
ESG and Material Efficiency Perspective for Investors - Presentation by Céline Méchain for the WMF 17-19th June 2021
Evolution of the Principles for Responsible
                                      Investment Signatories

                 PRI signatories have grown to more than 3,800 members, with c.$100 Trillion in assets under management

                                                                                                Growing Initiative Since 2006
                                120                                                                                                                                                                   3,200
      Assets Under Management

                                                                                                                                                                                                              Number of signatories
                                100                                                                                                                                                                   2,800
                                                                                                                                                                                                      2,400
                                80
                                                                                                                                                                                                      2,000
              (US$ trn)

                                60                                                                                                                                                                    1,600

                                40                                                                                                                                                                    1,200
                                                                                                                                                                                                      800
                                20
                                                                                                                                                                                                      400
                                  0                                                                                                                                                                   0
                                      2006   2007         2008      2009       2010          2011       2012      2013        2014       2015        2016      2017          2018       2019   2020
                                                    Assets under management (US$ trillion)          AO AUM ($ US trillion)        Number of Assets Owners             Number of Signatories

                                                                                                    Overview of Signatories
                    Signatories as of April-2021
                    Net new signatories since April-2020                                                                                                              Benelux
                                                                                                                                                                       145
                                                                                                                                                                        +41         Nordic
                                                                                                                                                                                     287
                                                                                                                                                                UK &                 +45
                                                                                                                                                               Ireland
                                                                                                                                                                 665
                                                                                   Canada                                                                       +159
                                                                                    185                               CEE & CIS
                                                                                                                                                                                 Germany,
                                                                                    +25                                  29                                         France       Austria &
                                                                                                                         +8                                          304        Switzerland
                                                                                                                         Middle East                                 +55           360
                                                                                       US                                    21     China                   Southern
                                                                                                                                                  Japan                             +95
                                                                                      +761                                    +7     56                      Europe
                                                                                                                                                   94
                                                                                      +174                                           +17                      209
                                                                                                                                                   +10
                                                                                                                  Africa                                       +52
                                                                                                                   91     Rest of Asia
                                                                                                                    +3         142
                                                                                  Latin America     Brazil                     +35
                                                                                                     89                                  Australia & NZ
                                                                                   (Ex. Brazil)
                                                                                                     +24                                      214
                                                                                        78
                                                                                                                                              +14
                                                                                       +38

Source: UN PRI Initiative website

                                                                                                                                                                                                                                      5
ESG and Material Efficiency Perspective for Investors - Presentation by Céline Méchain for the WMF 17-19th June 2021
ESG is Increasingly Material to Financial Investors
… and is Becoming Increasingly Mainstream

                                                                                                                 200       ESG Funds Growing Steadily, Non-ESG Funds are Seeing Outflows

                                                                                       Cumulative Flows ($bn)
                                                                                                                 100

                                                                                                                   0

                                            2020 saw ESG funds receive net inflows                             (100)
     AuM1 is Growing…                        of $153bn whilst non-ESG funds
                                             experienced net outflows of $37bn                                  (200)

                                                                                                                (300)

                                                                                                                (400)
                                                                                                                  Jan-2019Jan-19               Jul-2019                 Jan-2020
                                                                                                                                                                    Jan-20                               Jul-2020 Jan-21
                                                                                                                                     All ESG Funds                                 All Funds Excluding ESG

                                                                                                                                                       EMEA Leading the Charge

                                                                                                                                    19 %                                                                 25 %
                                                                                                                                     7%                           35 %
                                                                                                                                                                                                         9%
                                                                                                                                                                  11 %
                                            GS survey of 1,600 investors revealed
 … and Mainstream
                                             majority currently, or are planning to,                                                74 %
 Adoption by Investors…                      incorporate ESG into investment process                                                                              54 %
                                                                                                                                                                                                         66 %

                                                                                                                                    EMEA                         Americas                                APAC

                                                                                                                        Currently Applying             Planning to Apply                      Not Planning to Apply / Undecided

                                                                                                                                              Cumulative ESG vs. Non-ESG Passive Fund Flows
                                                                                                                100%
                                                                                                                80%
                                                                                                                60%

                                                                                                                             100%

                                                                                                                                       100%

                                                                                                                                                100%

                                                                                                                                                          99%

                                                                                                                                                                  99%

                                                                                                                                                                            99%

                                                                                                                                                                                       99%

                                                                                                                                                                                                  99%

                                                                                                                                                                                                          97%
 … and in Passive ETFs2  The rise of ESG ETFs continues to place
                                              2

                                                                                                                                                                                                                  86%

                                                                                                                                                                                                                           69%
                          an emphasis on having the right ESG                                                   40%
 too                      score for companies                                                                   20%
                                                                                                                  0%
                                                                                                                             2010

                                                                                                                                       2011

                                                                                                                                                2012

                                                                                                                                                          2013

                                                                                                                                                                  2014

                                                                                                                                                                            2015

                                                                                                                                                                                       2016

                                                                                                                                                                                                  2017

                                                                                                                                                                                                          2018

                                                                                                                                                                                                                  2019

                                                                                                                                                                                                                           2020
                                                                                                                                                       Non-ESG Flows                     ESG Flows

Notes: 1 Assets under Management. 2 Exchange Traded Funds.

                                                                                                                                                                                                                                  6
ESG and Material Efficiency Perspective for Investors - Presentation by Céline Méchain for the WMF 17-19th June 2021
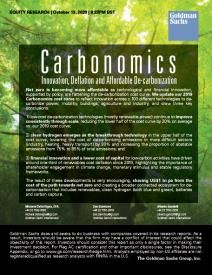
The Market is Differentiating Already Between
 “Good” and “Bad”
… Missed Opportunity to Maximise Value

                                                                                                         250                                                                                                         245.58

                                                                                                                                                                                                                     203.62
                                                                                                         200
        ESG Favourites                         Strong market bias towards ESG Fund                                                                                                                                  167.62
         Outperform…                            favourites                                               150
                                                                                                                                                                                                                     121.45
                                                                                                         100
                                                                                                                                        Jan-19                              Jan-20                      Jan-21
                                                                                                                                  US ESG Favorites            S&P 500                EU ESG Favorites            STOXX 600

                                                                                                                                 13x                                                                                   24%
                                                                                                                                                   Premium (RHS)
                                                                                                                                                   Low carbon emitters (Q5)
                                                                                                                                 12x                                                                  2019-21
                                                                                                                                                   High carbon emitters (Q5)                                           20%
                                                                                                                                                                                                    avg premium:

                                                                                                             12m Fwd EV/EBITDA
                                                                                                                                 11x                                                                   14.6%
                                                                                                                                                                                                                       16%
                                                                                                                                 10x

 … High Carbon Emitters  Low Carbon intensive companies trade at

                                                                                                                                                                                                                              Premium %
                                                                                                                                  9x                                                                                   12%
                          increasingly elevated premia vs. high
    Penalised too…        carbon sectors                                                                                          8x
                                                                                                                                                                               2015-19 avg premium:                    8%
                                                                                                                                                                                       8.3%
                                                                                                                                  7x

                                                                                                                                            2010-15 avg premium:                                                       4%
                                                                                                                                  6x
                                                                                                                                                    4.4%
                                                                                                                                  5x                                                                                   0%
                                                                                                                                       2010 2011 2012 2013 2014 2015 2016 2017 2018 2019 2020 2021

                                                                                                                                 16%                                                                                    16%
                                                                                                                                                                                                                        15%
                                                                                                           Adjusted WACC

                                                                                                                                 14%                                                                                    14%
                                                                                                                                                                                                                        13%

                                                                                                                                                                                                                                 CROCI
                                                                                                                                 12%                                                                                    12%
                                               Top ESG Disclosers have an average                                                                                                                                      11%
… and       impacting WACC1                     104bps lower WACC1                                                               10%                                                                                    10%
                                                                                                                                                                                                                        9%
                                                                                                                                 8%                                                                                     8%
                                                                                                                                   2011     2012       2013   2014     2015      2016      2017     2018    2019    2020
                                                                                                                                                   2                    1                                                                 1
                                                                                                                                       Q1 (Top E&S Performers) WACC                               Q5 (Bot. E&S Performers) WACC
                                                                                                                                                 3                                                          3
                                                                                                                                       Q1 CROCI                                                   Q5 CROCI

Notes: 1 Weighted Average Cost of Capital. 2 Environment and Social. 3 Cash Return on Capital Invested

                                                                                                                                                                                                                                          7
ESG and Material Efficiency Perspective for Investors - Presentation by Céline Méchain for the WMF 17-19th June 2021
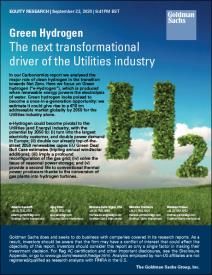
Growing Sophistication of Investors Means Risks
from Getting it “Wrong” are Greater
……With Potential For Rapid Value Impact For Communication Missteps

                                                                          GS SUSTAIN ESG Universe Listed Since 2010, SUSTAIN Absolute Controversies
                                                                                         Scores (2010-2017); TSR is GICS 2 Relative
                                                                                                      0.6%
                                                                                                      0.3%

                                                                           Rolling region-relative
                                                                                                      0.0%

                               ESG missteps can have an enduring                                    (0.3)%
       ESG Crises

                                                                                    TSR
                                impact on value                                                      (0.6)%
                                                                                                     (0.9)%
                                                                                                     (1.2)%
                                                                                                                   Not Controversial     Somewhat Controversial     Very Controersial

                                                                                                              1-year relative TSR                 3-year relative TSR CAGR

… Amplified by the Mass  Mass organised online social
                          engagement can rapidly amplify
and Social Media…         perception and value from a crisis

                                                                                                                                               Activist Value     Influence on Board
                                                                        Company                          Crisis                     Activist       Thesis              Changes?
                                                                                                                                                                          
                                                                                                       Gas Leak                                  Break-up         Board Representation

                                                                                                       Epstein                                                              ?
     … A(a)ctivism             Growing use of ESG as a ‘wedge’ issue                                 Connection
                                                                                                                                                 Break-up          Situation Ongoing
     Increasing                 and greater investor engagement
                                                                                                       Round up                                                             ?
                                                                                                                                                 Break-up          Situation Ongoing
                                                                                                       Litigation
                                                                                                                                                   Cost
                                                                                                                                                Reductions,                 
                                                                                                      “Dieselgate”
                                                                                                                                               Remuneration       Director Resignations
                                                                                                                                                  Reform

                                          Navigating ESG is becoming increasingly more complex.
                      Understanding your ESG strengths and vulnerabilities are key to ensuring a robust investment case

                                                                                                                                                                                          8
ESG and Material Efficiency Perspective for Investors - Presentation by Céline Méchain for the WMF 17-19th June 2021
ESG Investing Across the Fund Manager
                      Spectrum

    Funds Reflect ESG
    Criteria in Different
            Ways

                                                         ALIGNMENT                                  INTEGRATION                                              IMPACT

    Negative /
   Exclusionary              $19.8t
    Screening

                                              Seek to better align                ESG considerations largely incorporated into                   High degree of ESG focus,
                                               portfolios with ESG factors          active investment processes                                     with ESG specialist funds,
                                               with minimal financial                                                                               exclusionary criteria, and
ESG Integration             $17.5t
                                               impact                                                                                               positive screening
                                                                                   Still some uncertainty over how to incorporate ESG
                                                                                    into valuations, with few institutions actually adjusting
                                              Typically avoid objectionable        valuations to reflect sustainability as of yet                 Typically among the early PRI
                                               exposures while optimizing for                                                                       signatories (pre-2010)
   Corporate                                   desired exposures
 Engagement /
  Shareholder
                       $9.8t                                                       May employ both norms-based and negative ESG
    Action                                                                          screens                                                        Strong proponents of the
                                              Ex. passive low carbon equity                                                                        positive correlation between
                                               strategy                                                                                             sustainability and future
                                                                                   Ex. Active ESG equity strategy                                  valuations
  Norms-based
                    $4.7t                     Developing more integrated
   Screening
                                               frameworks while mitigating         At the more ESG-focused end are Blackrock and                  It is important to note that only
                                               large ESG risks                      Amundi, with the latter having announced that ESG               c.$3tn of AuM lies in these
                                                                                    analysis will be integrated across all Amundi funds             relatively small funds
                                                                                    within 3 years

         Other      $3.2t                                                          The bulk of AuM2 lies in this group

 Source: PRI Signatory Directory
 Notes: 1 Preqin Ltd report. 2 Assets Under Management

                                                                                                                                                                                        9
ESG and Material Efficiency Perspective for Investors - Presentation by Céline Méchain for the WMF 17-19th June 2021
Market Update | Growth of ESG-Labelled Bond
Diversification From Pure Green Bonds

                              Global ESG-Labelled Bonds                                                                     European ESG-Labelled Bonds
                                                                                                               Green
                                                                                       383.7                                                                                250.8
     Green                                                                                       5.6           Social                                                            4.5
                                                                                                 1.3           Sustainability                                               22.5 1.0
     Social
                                                                                                               Transition
     Sustainability                                                                     51.9                   Sustainability-Linked
                                                                                                                                                                            93.7
     Transition                                                                                                                                               138.1
                                                                                                                                                                   3.9
     Sustainability-Linked                                                                                                                                    12.0 0.5
                                                                                                                                                               9.1
                                                                       289.3
                                                                                 3.9                                                      69.8
                                                                                                                                          60.8 7.8
                                                                                 0.5                                                  6.2  -                                129.2
                                                                        32.3                                                                   5.2 112.7
                                                                                       120.1                   26.8     30.4          5.5
                                                                                                                    2.7      3.7          56.8
                                                                                                                    2.0 25.0 1.6 49.1
                                                                        14.7                                   22.1
                                                                                                               2015         2016          2017      2018      2019          2020

                                                                                                                  Rest of the World ESG-Labelled Bonds
                                                                                                               Green                                          147.8
                                      143.8                                                                    Social                                                       133.3 1.1
                                                      137.9                                                    Sustainability                                 20.2
                                       8.7     0.4                                                                                                                                0.3
                                       8.5             11.9                                                    Transition                                             5.7
                                                                                                               Sustainability-Linked                                        29.5
                                                       11.2            238.0
                      90.2                                                             204.7                                              82.5
                               4.9                                                                                                                                          26.5
                                                                                                                                                 2.5
                               2.0                                                                                                                   66.6
                                                                                                                             59.6                3.0      4.2
                                      126.2                                                                                         1.2                   6.0 121.9
     43.5                                             114.8                                                                         0.3
              3.0     83.3                                                                                                                76.5                              75.9
              2.0                                                                                                            58.1
                                                                                                               15.8                                  56.4
     38.5                                                                                                             0.3
                                                                                                               15.5
     2015            2016             2017            2018             2019            2020                    2015         2016          2017      2018      2019          2020

Sources: Bloomberg, ClimateBonds, as of Dec-2020 – foreign exchange used as of the date of the bond issuance
Note: In bn€-eq

                                                                                                                                                                                    10
ESG Debt Instruments Available
              Recent Evolution of Moving Away from “Project-Based” Structures to
              “Target-Based” Structures
                                                                   “Project-Based” Structures                                                  “Target-Based” Structure

                                                                         Sustainability
                                                                                                                                                  Sustainability-Linked
                          Green Bond             Social Bond                                     Transition Bond         SDGs Bond
                                                                             Bond                                                                         Bond
                         Funds dedicated to    Funds dedicated to      Funds dedicated to     Funds dedicated to    Funds dedicated to        No requirements for the
                          strict green           social projects          both green and          a wider range          a wider range of           use of proceeds
                          projects              Follow the ICMA          social projects         green / energy         both green /              The issuer is indirectly
      Short              Follow the ICMA        SBPs framework          Follow the ICMA         efficiency projects    energy efficiency          committed to meet green
    Description           GBPs framework                                  SBPs and GBPs          Follow the ICMA        and social projects        target(s) otherwise
                                                                          frameworks              GBPs framework        Follow the ICMA            coupon/return will
                                                                                                                         SBPs and GBPs              increase
                                                                                                                         frameworks

   Subject to a
   Framework?                                                                                                                                          
  Project Based?                                                                                                                                        
Funds Committed?                                                                                                                                                   Target based
                                                                                                                                                                        structure gives
  Issuer Retains
    Flexibility?                                                                                                                                                more flexibility

 Return / Coupon
    Increase?                                                                                                                                                        The coupon
                                                                                                                                                                          step up gives
                                                                                                                                                                          more comfort
  ESG Investors’                                                                                                                                                         that the issuer
  Attractiveness                                                                                                                                               will meet the
                                                                                                                                                                               target

 Included in Green
      Indexes?                                                                                                                                          
   Will Attract
 Dedicated Green                                                                                                                                       
   Investors?

Positive Marketing?                                                                                                                              
   Size Available                                                                                                                                                        Target based
   (Limited to the                                                                                                                                                structure
 Issuer’s Projects)                                                                                                                                                     allows for large
                                                                                                                                                                               size

                                                                                                                                                                              11
Which KPIs Have Been Retained to Define
                     Sustainability in Recent Debt Issuances?
                     Increased Diversity of Criteria and Issuers Across All Sectors
      Single or multi-criteria KPIs
      Influencing the cost of debt issuance in case of non-compliance: “Greenium” vs. “Coupon step-up”
      Donation to charities and reinvestment in environment

                                               Bond KPIs                                                                                                     Loan KPIs

          Apr-2021                              Feb-2021                             Feb-2021                                         Feb-2021                                      Feb-2021
       Greenhouse gas                        25% reduction in              30% of recycles materials, 20%                    Patient satisfaction, medical                  Emissions reduction, content
     emission reduction,                     greenhouse gas               reduction of Scope 1 and 2 CO2                         waste reduction and                         packaging and women In
      Board diversity and                 emission by 2025 and            emissions and 10% reduction of                      improvement of work / life                           management
     investment advisory                     10% increase in                Scope 3 emissions from fabric                       balance for employees
    professionals diversity              recycled aluminum input                production, garment
                                                 by 2026                    manufacturing, raw materials
                                                                          and upstream transport by 2025

           Jan-2021                             Jan-2021                              Nov-2020                                        Jan-2021                                          Nov-2020
     Water consumption,                   Reduce Scope 1 and 2                 Target of kg net of CO2                        Volumes of the company’s                 Implementing systems for collecting and
    waste reuse / recycling                  greenhouse gas                       emitted per ton of                         products being used in wind                 recycling packaging from customers,
   and reintroduction and /                 emissions by 60%                    cementitious material                                  turbines                         increasing the share of green products
   or reinforcement of wild                                                                                                                                                 and % of employees given the
   species intro ecosystem                                                                                                                                                opportunity to become shareholders

                                                                                       Sep-2020                                                                 Jun-2020
          Nov-2020                         Sep-2019 / Oct-2020               Increase number of patients                                                     Reduction in CO2
   CO2 emissions, gender                    Increase installed               reached in low- and middle-                                                        emissions
   diversity and training of              renewable energy and             income countries (LMICs) with
   underprivileged people                reduce greenhouse gas              strategic innovative therapies
                                                emissions

                                                                                 Protect environment, Resources and Humanity

Sources: Company reports and press releases. 1Novartis global health flagship programs target leprosy, malaria, Chagas disease, and sickle cell disease.
Note: A positive “greenium” implies an estimated pricing benefit for the Issuer vs. a similar “vanilla” transaction

                                                                                                                                                                                                                 12
Goldman Sachs Research on Thematic Deep
                   Dives

  1st of 40 years: China de-      ESG Sector Roadmaps: E-     Investing in the Sustainable     Top of Mind: Investing       The Green Deal: EU Green      ESG Sector Roadmap: Brands
 carbonization: Reshaping of            Commerce                  Development Goals               Climate Change           Deal estimate up 50%, now at            & Apparel
           upstream                      Apr-2021                      Feb-2021                       Jan-2021                        €10trn                       Jan-2021
           Apr-2021                                                                                                                  Jan-2021

Carbonomics: China net zero:     ESG Sector Roadmap: Banks    Carbonomics: 10 key themes       ESG Sector Roadmap:          Carbonomics: Innovation,        Green Hydrogen: The next
  The clean tech revolution               Dec-2020           from the inaugural conference       Utilities Nov-2020        Deflation and Affordable De-   transformational driver of the
          Jan-2021                                                      Nov-2020                                                   carbonization                 Utilities industry
                                                                                                                                     Oct-2020                        Sept-2020

 ESG Sector Roadmap: Food &       The EU Green Deal: Green     Carbonomics: The Rise of      GS SUSTAIN: Carbon offsets:     Carbonomics: The green       The EU Green Deal: Towards
 Beverage, Alcohol & Tobacco              Upside                   Clean Hydrogen              Tools for the low carbon    engine of economic recovery     "net zero": A plan to fight
            Sep-2020                      Jul-2020                     Jul-2020                       transition                     Jun-2020                   climate change
Source: Goldman Sachs Research                                                                         Jun-2020                                                    Jan-2020

                                                                                                                                                                                       13
You can also read