Ethylene Carbonate-Lean Electrolytes for Low-Temperature, Safe, Lithium-Ion Batteries
←
→
Page content transcription
If your browser does not render page correctly, please read the page content below
Ethylene Carbonate-Lean Electrolytes for Low-
 Temperature, Safe, Lithium-Ion Batteries

 Bryan D. McCloskey, Principal Investigator
 Lawrence Berkeley National Laboratory
 June 21-25, 2021
 Project ID: bat521

This presentation does not contain any proprietary, confidential, or otherwise restricted information
Overview
 Timeline Barriers Addressed
• Start Date: Oct. 1, 2019 • Energy Density
• End Date: Sept. 30, 2022 • Safety
• Percent complete: 50% • Low rate capability
Budget • Low temperature performance
• Total budget (3 years): $2350K
• FY21 funding: $650K
Partners/Collaborators
Kristin Persson, Nitash Balsara, Robert Kostecki, Vincent Battaglia, Wei Tong, Gao Liu
LBNL/UC
Cell Analysis, Modeling, and Prototyping (CAMP) Facility, ANL (Electrode preparation)
 1
Relevance
• At low temperatures (
Milestones
Date Milestones Status

December 2020 Complete molecular dynamics simulation studies on influence of Completed
 temperature on LP57 electrolyte transport/solvation properties.

March 2021 Complete pouch cell temperature-dependent discharge and Completed
 impedance analysis of R2 electrodes in LP57 electrolyte with and
 without butyrolactone substitution.
June 2021 Complete study on influence of common additives on low Completed
 temperature discharge capability. Go: continue studies on the best
 performing additive composition, No-go: all others.
September 2021 Complete 3-electrode impedance comparison of graphite and NMC On track
 electrodes cycled at low and moderate temperature in LP57 with
 and without additive containing electrolytes.

 3
Approach • Electrodes used: 2.9 mAh/cm2 graphite, 2.5 mAh/cm2 NMC622 (from CAMP)
 • Understand low temperature performance as a function of electrolyte composition
 • Electrolyte parameters examined: LiPF6 concentration, additive concentration/
 composition, substitute GBL for EC (GBL is chemically similar to EC, but has a much
 larger liquid temperature window).
Techniques utilized:
 Electrochemical Characterization
 Transport analysis
 Impedance analysis,
3-electrode cells to Distribution of relaxations (DRT)
isolate impedances

 Molecular dynamics simulations
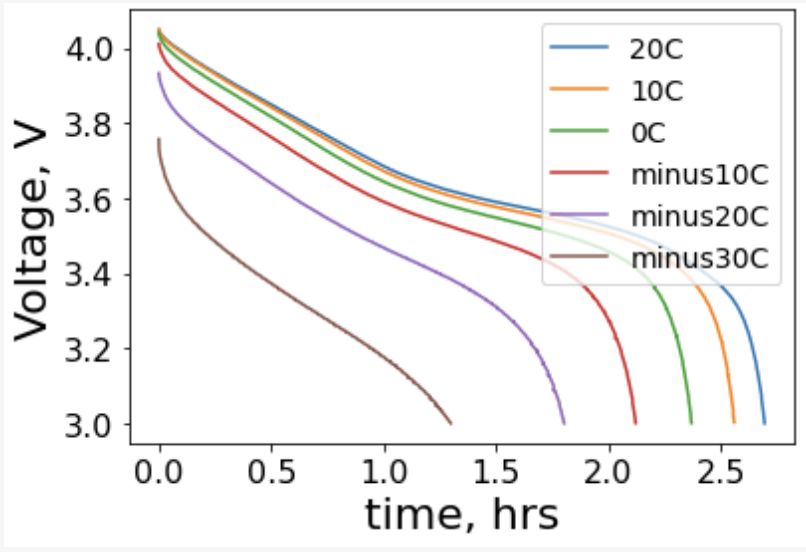
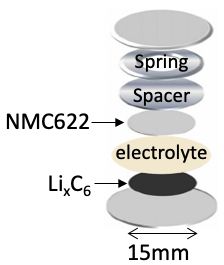
Accomplishment: Baseline cell performance and impedance analysis
 1.4 mA discharge rate (C/3)
 Coin cells Cell impedance at 20 oC

 RS RT

 Total Resistance, RT [Ω cm2]
 Q/Q20C (%)

 40 µL 1M LiPF6 in
 3:7 wt:wt EC:EMC (LP57)
Celgard separator (18 mm dia) Temperature [oC]
 Cell capacity: 4.3 mAh total Capacity normalized • Cell resistance reported at average cell
 1.8 cm2 electrode area to 20 oC capacity
 voltage at each individual temperature
 Formation: 3 x C/10,
 • Impedance collected galvanostatically (during
 3 x C/3 cycles at 20 oC
 application of discharge current)
 Discharge capacity and average voltage decrease • Data satisfies Kramers-Kroenig relations for
 substantially at low temperatures due to high resistances linearity
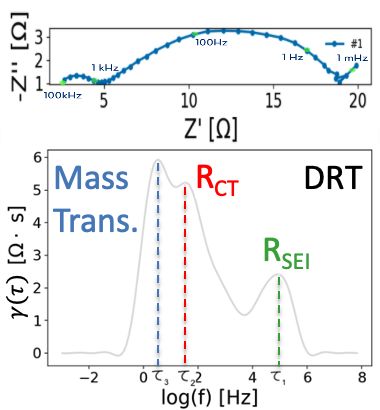
Approach (II): Impedance analysis using distribution of relaxation
times (DRT) to resolve processes
• Separating processes by time constants offers better resolution than traditional equivalent circuit fitting
• Impedance associated with mass transport and charge transfer resistance have similar time constants at
 low temperatures. • DRT fits impedance data to an
 infinite number of RC circuits,
 each with its own unique time
 Time constant, .
 transform
 • Time transform allows the
 extraction of the distribution of
 time constants, .
 Equivalent circuit: Infinite RC elements • Peaks correspond to dominant
 each with unique time constant, ( system processes
 Simulated 3 RC circuit where • Integration of peak area gives
 time constants overlap, make '
 process resistance
 deconvolution difficult
 = % + "#$ *
 & 1 +
 = total system impedance; ! = cell series resistance; "#$ = total polarization resistance;
 = time constant (considered continuous); ( )= distribution of time constants
 Orazem and Tribollet, Electrochemical Impedance Spectroscopy, 2008
 Schichlein, et al, J. of App. Electrochem. 32 (2002) 6
Accomplishment: Galvanostatic impedance to understand origin of resistance rise
 Galvanostatic impedance at
 0 oC analyzed using DRT
 Coin cells RCT

 Resistance [Ω cm2]
 Peak
 integration

 RS RSEI

 Temperature [oC]

 RS= Electrolyte (series) resistance,
 RCT = total cell charge transfer resistance
 from Nyquist plot
 (anode + cathode)
 40 µL 1M LiPF6 in RSEI= total interfacial resistance (SEI + CEI)
 3:7 wt:wt EC:EMC (LP57) Mass trans.= mass transport/ The peak ascribed to charge
Celgard separator (18 mm dia) diffusion processes transfer resistance dominates
 Cell capacity: 4.3 mAh total Peak assignments from prior reports: over SEI/CEI and electrolyte
 1.8 cm electrode area
 2
 J. Power Sources (2021) 496, 229867 transport at low temperatures
 J. Power Sources (2015) 282, 335
 Electrochimica Acta (2019) 322, 134755
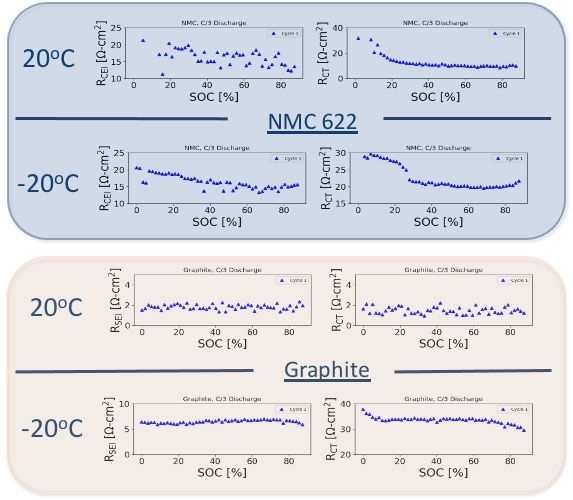
Accomplishment: 3 electrode cell to understand impedance origins at anode and
cathode Galvanostatic impedance/DRT collected during
 C/3 discharge at NMC and LixC6 at 20 and -20 oC
 3 electrode cell
 configuration
Baseline electrolyte (LP57)
 Measured at SOC =40%
 o o
 W cm2 20 C –20 C
 NMC622
 RCEI 15 17
 NMC622
 RCT 9 22
 RSEI 2 7
 Graphite
 RCT 1.8 35
 RCEI= cathode-electrolyte
 LixC6 interface resistance
 Allows deconvolution of
resistances at NMC and graphite
 At 20 oC, NMC impedances dominate overall resistance. Comparing -20 to 20 oC, NMC
 impedance modestly increases, but LixC6 charge transfer resistance dramatically increases.
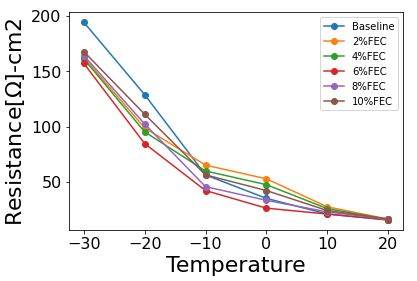
Accomplishment: Electrolyte concentration and additive influence on cell resistance
• Data collected in full LiC6-NMC622 coin cells (see first accomplishment slide), galvanostatic impedance
 Concentration influence (in 3:7 EC:EMC) Fluoro-EC (FEC) influence Vinyl carbonate (VC), propane
 sultone (PS) influence

 Resistance [Ω cm2]
 Resistance [Ω cm2]

 8.5
 Baseline (LP57) -20°C Energy Baseline
 -30 oC 8.2 VC

 Total
 Total

 Energy (mWh)
 -20 oC PS
 7.9
 -10 oC 6% FEC
 in LP57 7.6

 Concentration [M] Temperature [oC] 7.3

 7.0
 0% 0.5% 1% 2% 5%

 Q/Q20C
 Additive Quantity
 Q/Q20C

 4.4
 -20°C Discharge
 Capacity normalized Capacity normalized 4 4.2V Charge @ 30°C
 A100 - Baseline
 C/3 Rate
 to 20 oC capacity, C/3 to 20 oC capacity, C/3 F1 - 0.5% VC

 Voltage (V)
 3.6
 J3 - 0.5% PS

 Temperature [ C] o
 Temperature [ C] o
 3.2

 –20 oC RCT [W cm2 ] RSEI and RS are only –20 oC RCT [W cm2 ] 2.8

 1 M LiPF6
 very slightly affected 0% FEC 109
 2.4
 109 0 0.5 1 1.5 2 2.5
 by concentration and FEC Capacity (mAh)
 0.8M LiPF6 74 6% FEC 82 VC and PS have minimal
 effect on RT and capacity
Low temp RT optimized at ~0.8 M LiPF6, FEC has no influence on RT above
driven by reduction in overall RCT 0 oC, reduces RT below 0 oC, with 6 Future work: 3 electrode cell to
 wt% showing optimal performance identify anode/cathode resistances
Accomplishment: Low melting point liquid as co-solvent: -butyrolactone (GBL)
GBL melts at -43 oC and boils at 204 oC; EC melts at 39 oC and boils at 248 oC, EC and GBL are very similar chemically
Does GBL offer any advantage over EC in low temp performance?
 Coin cell electrodes punched
 Pouch cell cycled 400 times in out, symmetric Gr/Gr and
 LP57 at 20 oC, discharged to NMC/NMC cells prepared
 70% SOC on final cycle

 EIS at OCV

 -20 oC

 3:0:7 1:2:7
Note: Cells formed with GBL as a co-solvent EC:GBL:EMC
and no additives form poor SEIs

 Modest increase in graphite impedance with GBL as
 co-solvent, very large decrease in NMC impedance
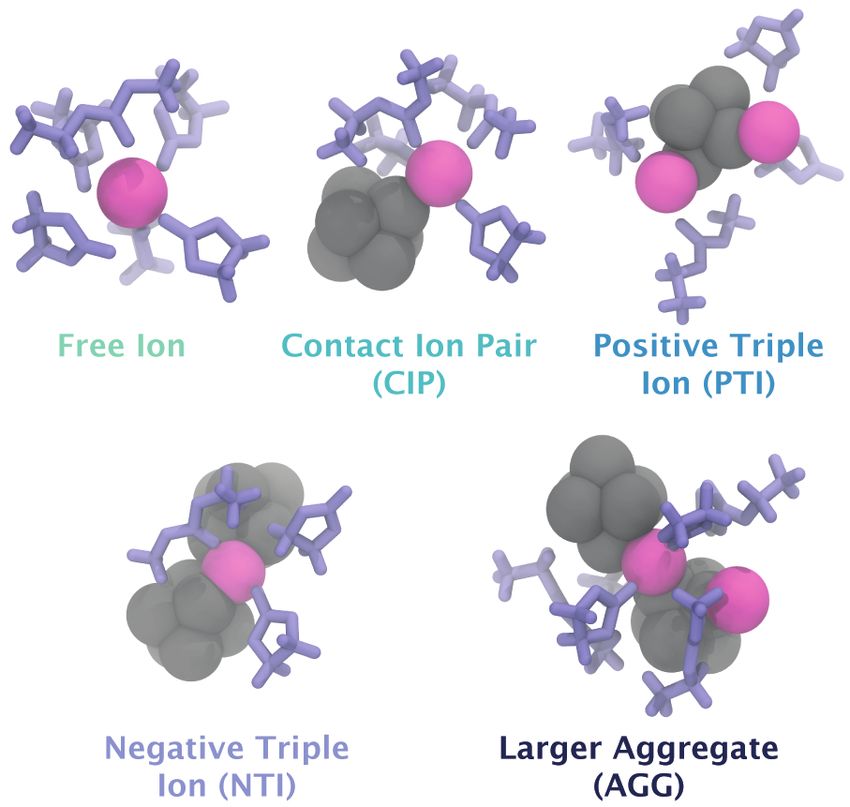
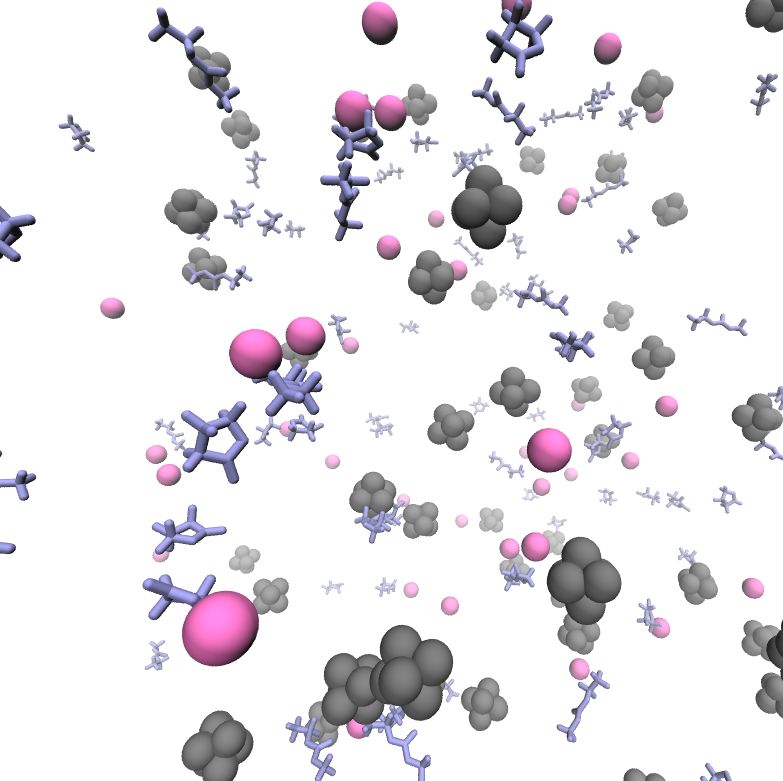
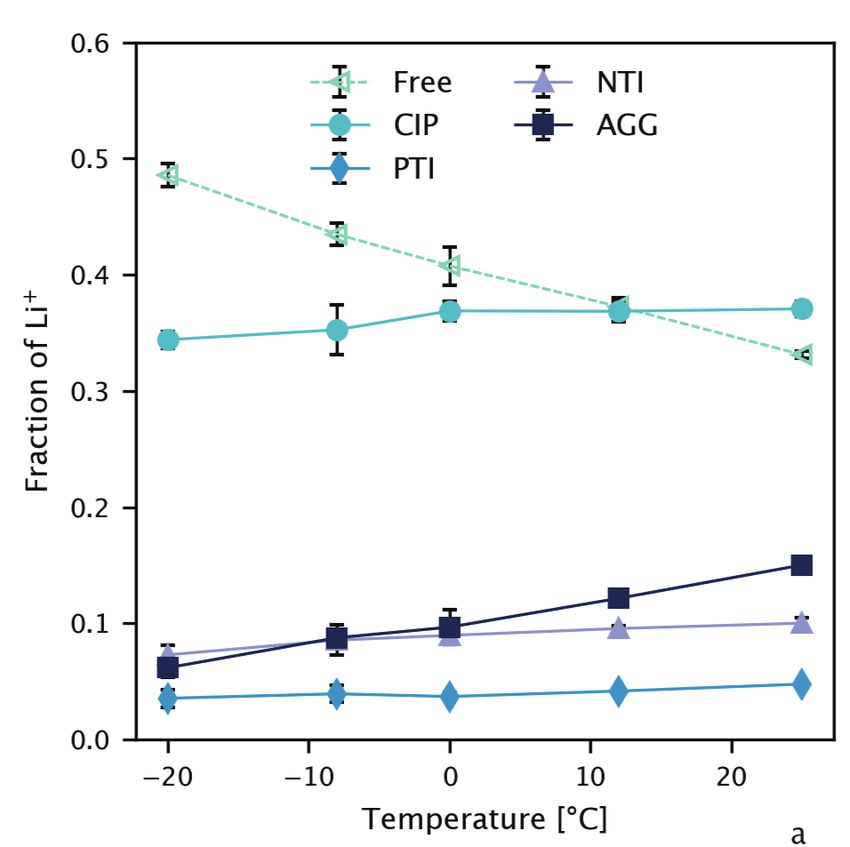
Accomplishment: Molecular dynamics to understand low temperature transport mechanisms
 All results on LP57 x 10-6

 Self-diffusion coeff. [cm2/s]
 !
 ≈

 Fraction of Li+
 6

 Temperature [oC]
 Snapshot of simulation Temperature [oC]
 Li+ are pink spheres,
 PF6- are grey sphere aggregates
 Solvents are shown explicitly
Methodology:
1) Select a system of N particles
2) Initialize positions and velocities of
 each particle
3) Compute the forces acting on each
 particle
4) Integrate Newton's equations of Ion pairing decreases and viscosity increases,
 motion with decreasing temperature, results in net
 conductivity decrease Reasonable agreement between
5) Advance the simulation in time experiments and theory
Accomplishment: Development of experimentation to measure low temperature transport
properties of liquid electrolytes
 Electrolyte used: Conductivity in Li-Li symmetric cells
 4000 30 C Probe Current fraction ( " ) of initial vs steady-state
 3500 30 C current during polarization

 Conductivity (µS/cm)
 15 C
 3000 0C
 2500 -20C
 2000
 1500
 Chosen initially due to known
 1000
reasonable stability toward Li metal:
 500
 0
 0 0.1 0.2 0.3 0.4
 r
 Voltage relaxation after polarization,
 can relate to salt diffusion coefficient
 X-ray tomogram after cycling • Conductivity, restricted diffusion, and polarization
 measurements to measure current fraction
 Polarization measurement • Future work: Concentration cells to measure
 thermodynamic factor to relate concentration and
 chemical potential gradients
 • Combine these measurements with Newman-Balsara
 theory to fully characterize the transport properties of
 liquid electrolytes (transference number, diffusion
 coefficient, conductivity, and thermodynamic factor)
 • Future work: extend to LP57 and other liquid
 compositions
Remaining challenges and barriers
• While GBL clearly improves charge transfer resistance at NMC, it has poor
 stability at the anode. Can we engineer an additive composition that allows
 improved anode stability while taking advantage of improved cathode
 performance?
 – Stability of any other co-solvents/additives will need to be carefully considered
 – We need to continue to develop an understanding of why GBL reduces cathode
 resistance and link resistance reduction to cell performance
• Additives other than FEC appear to have limited capacity/resistance reduction
 improvements, likely because charge transfer resistance dominates cell
 performance (not SEI resistance)
 – The focus of low temperature performance should be on solvent engineering, with
 additives to improve stability as needed
• Can we accurately measure transport properties in electrolytes that have poor Li
 metal stability?

 13
Future work
• Why does the addition of GBL reduce cathode impedance?
 – Hypothesis: Solvation of Li+ influences charge transfer resistance, so examine co-solvents with
 varying donor numbers: propylene carbonate, acetonitrile, GBL may provide insight
 – Study additives to improve stability of electrolytes with new co-solvents as needed
• Spectroscopic analysis (Raman, infrared) of anodes and cathodes to link interfacial chemical
 composition to impedance
 – Parameters to be examined: salt concentration, FEC, GBL inclusion
• Gas evolution analysis to understand stability limitations in new electrolyte compositions
 containing GBL or other co-solvents
 – Additive/salt engineering to improve stability of GBL-containing electrolytes
• Molecular dynamics to understand solvation dynamics of Li+ in varying salts
 – Important to understand charge transfer kinetics
• Fully evaluate transport properties of new electrolyte compositions as a function of
 temperature
• Delivery of 100 mAh pouch cells with optimized electrolyte composition to DOE (final
 deliverable of project)
 – So far, lower concentration LiPF6 (~0.8M) in 3:7 EC:EMC with a few percent FEC likely provides
 best performance of electrolyte studies so far, but solvent engineering will likely increase
 performance further

 Any future work is subject to change based on funding levels 14
Summary
• Charge transfer resistance dominates low temperature
 performance of Li-ion batteries
 – Both anode and cathode charge transfer resistance are large at
 low temperatures.
• Overall cell impedance optimized at slightly lower salt
 concentrations (~0.8 M) than LP57
• FEC is the only additive studied so far that appears to reduce
 cell impedances at low temperatures
• GBL, while unstable at the graphite anode, reduces charge
 transfer resistance at the cathode when employed as a co-
 solvent. Further additive engineering is needed to improve
 stability.
• Ion pairing decreases with decreasing temperature, but viscosity
 dramatically increases, reducing overall conductivity

 15
Response to previous year’s reviewer’s comments

• This is the first year that the project has been reviewed

 16
You can also read