A warm autumn with bursts of heavy rainfall - NIWA
←
→
Page content transcription
If your browser does not render page correctly, please read the page content below

New Zealand Climate Summary: Autumn 2021                                           Issued: 4 June 2021

A warm autumn with bursts of heavy rainfall
                                      th
    Temperature Autumn 2021 was the 10 -warmest autumn in 112 years of records. Temperatures
                     were above average (+0.51°C to +1.20°C of average) for most of Aotearoa New
                     Zealand. Pockets of well above average temperatures (>1.20°C above average) were
                     recorded in eastern Canterbury. Near average (±0.50°C of average) temperatures
                     were recorded in most of Northland, parts of Auckland, parts of Waikato, parts of Bay
                     of Plenty, most of Marlborough and Tasman, and scattered portions of Southland,
                     Otago and West Coast. No areas experienced below average temperatures.
          Rainfall   Autumn rainfall was below normal (50-79% of normal) across Northland, Auckland,
                     parts of Waikato, parts of Manawatū-Whanganui, Gisborne, Hawke’s Bay, Wairarapa,
                     eastern Southland and most of Otago. Above normal rainfall (120-149% of normal)
                     was observed in parts of Taranaki, northern Tasman, Nelson, northern Marlborough,
                     and parts of eastern Canterbury. Pockets of well above normal rainfall (>149% of
                     normal) was observed around Ashburton. Most of the total autumn rainfall that was
                     recorded in the Canterbury region fell in the last two-to-three days of the season.
                     Near normal rainfall (80-119% of normal) was observed elsewhere.
    Soil moisture    At the end of autumn, soil moisture levels were drier than normal for northern
                     Northland, Auckland, parts of Waikato, southern Hawke’s Bay, the Tararua district,
                     the Wairarapa, much of the Otago and southern parts of the Canterbury. Soil
                     moisture levels were wetter than normal spanning from the Nelson/Marlborough
                     region through to much of eastern Canterbury.

Click on the link to jump to the information you require:
Overview
Temperature
Rainfall
Autumn in the six main centres
Highlights and extreme events

Overview
Autumn 2021 was characterised by long dry spells and warmth, interspaced by bursts of heavy
rainfall. This was because La Niña began its transition to ENSO-neutral in March and the dominant
climate driver became the Madden-Julian Oscillation (an eastward moving “pulse” of cloud and rain
in the tropics). The MJO lingered over the western Indian Ocean, leading to higher than normal
pressures over Aotearoa New Zealand. As a result, much of Aotearoa experienced warm days, but
chilly overnight temperatures. However, on the occasions when the MJO quickly pulsed across the
Pacific, this led to several notable rain and storm outbreaks, including the Canterbury flood event at
the end of May.

The nationwide average temperature for autumn 2021 was 14.0°C (0.7°C above the 1981-2010
average from NIWA’s seven station temperature series which begins in 1909), making it the 10th-
warmest autumn on record. No areas of New Zealand experienced below average temperatures
during autumn. Autumn 2021 temperatures were above average (+0.51°C to +1.20°C of average) for
most of New Zealand. Pockets of well above average (>1.20°C above average) were recorded in
eastern Canterbury while near average (±0.50°C of average) temperatures were recorded in most of
Northland, parts of Auckland, Waikato and Bay of Plenty, most of Marlborough and Tasman, and
scattered portions of Southland, Otago and West Coast. Although there were some cool spells,
summer-like heat lingered well into autumn. Notably, parts of Canterbury and Hawke’s Bay observed
several days of temperatures above 30°C during March, and notably a 30.8˚C day in Timaru on 4
April. This warmth was still felt well into May, where 29 locations observed record or near-record
high daily maximum May temperatures during the month.

Autumn rainfall was below normal (50-79% of normal) across parts of Waikato as well as most
northern and eastern North Island locations, including Northland, Auckland, parts of Manawatū-
Whanganui, Gisborne, Hawke’s Bay, and the Wairarapa. In the South Island, below normal rainfall
was also observed in eastern Southland and most of the Otago region. Above normal autumn rainfall
(120-149% of normal) was observed in parts of Taranaki, northern Tasman, Nelson, northern
Marlborough, and parts of eastern Canterbury. Pockets of well above normal rainfall (>149% of
normal) was observed in eastern Canterbury. Near normal (80-119% of normal) was observed
elsewhere. For most of the season, there was a clear east-west divide of rainfall, with fronts bringing
rain to western areas but eastern areas missing out. However, bursts of sub-tropical and tropical
moisture transported over New Zealand ahead of low pressure systems led to significant rainfall in
some areas. Of most note was the Canterbury rainfall event which occurred in the final three days of
autumn. Prior to this event, it had been a very dry season, with most of the region tracking towards
less than half of its normal rainfall for autumn.

Further highlights for autumn 2021:

    •   The highest temperature was 31.9°C, observed at Waiau on 14 March.
    •   The lowest temperature was -10.8°C, observed at Tara Hills on 27 May
    •   The highest 1-day rainfall was 209 mm, recorded at Milford Sound on 8 May.
    •   The highest wind gust was 178 km/h, observed at South West Cape on 4 April.
    •   Of the six main centres Auckland was the warmest, Dunedin was the coolest and driest,
        Hamilton was the wettest, Christchurch was the sunniest, and Hamilton was the least sunny.

For further information, please contact:
Tristan Meyers
Meteorologist / Forecaster
Tel. 09 375 4508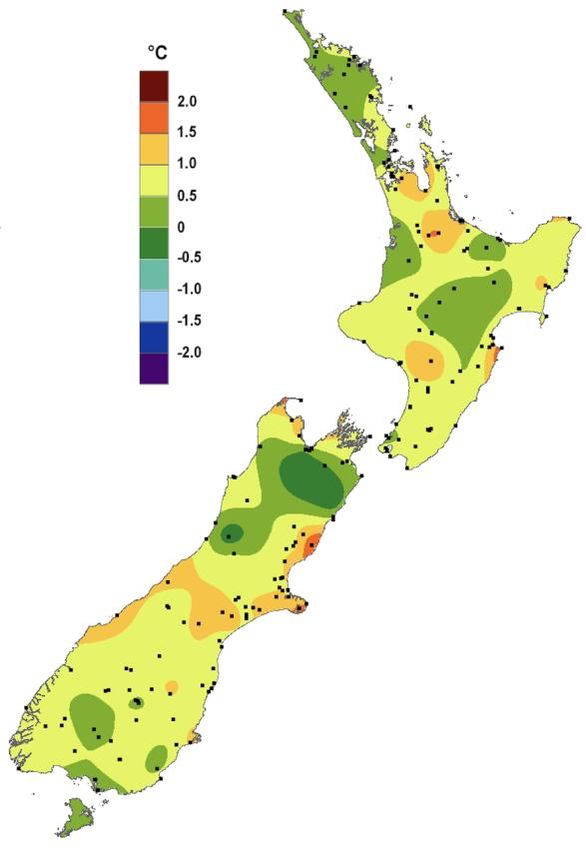
Temperature: Widespread warmth and pulses of extreme heat
The nationwide average temperature for autumn 2021 was 14.0°C (0.7°C above the 1981-2010
average from NIWA’s seven station temperature series which begins in 1909), making it the 10th-
warmest autumn on record.

Twenty-two locations ranked within their top-four warmest mean maximum (i.e. daytime) autumn
temperature records, while ten locations ranked within their top-four warmest autumn mean
temperature records.

There were several days throughout autumn during which pulses of warm air resulted in
temperatures in excess of 30°C. See the Highlights and extreme events section below for more
details.

Record1 or near-record mean air temperatures for autumn were recorded at:
    Location                                  Mean           Departure                 Year             Comments
                                                air             from                 records
                                              temp.          normal (oC)              began
                                               (oC)
    High records or near-records
    Motueka                                     14.5                1.6                 1956            Highest
    Wairoa                                      16.3                1.6                 1964            2nd-highest
    Kaikōura                                    14.5                1.4                 1963            2nd-highest
    Medbury                                     12.9                1.1                 1927            2nd-highest
    Cheviot                                     13.4                1.6                 1982            2nd-highest
    Rangiora                                    13.0                1.2                 1965            3rd-highest
    Akaroa                                      14.8                1.8                 1978            3rd-highest
    Le Bons Bay                                 13.4                1.2                 1984            3rd-highest
    Campbell Island                              8.2                0.7                 1991            3rd-highest
    Dunedin (Musselburgh)                       12.8                1.3                 1947            4th-highest
    Low records or near-records
    None observed

Record or near-record mean maximum air temperatures for autumn were recorded at:
    Location                                   Mean               Departure                Year           Comments
                                            maximum                 from                 records
                                          air temp. (oC)           normal                 began
                                                                     (oC)
    High records or near-records
    Cheviot                                      20.8                   2.7                1982           Highest
    Rangiora                                     20.1                   2.6                1965           Highest
    Wairoa                                       22.0                   2.3                1964           Highest
    Medbury                                      20.1                   2.0                1927           Highest

1
  The rankings (1st, 2nd, 3rd etc.) in all Tables in this summary are relative to climate data from a group of nearby stations, some of which
may no longer be operating. The current climate value is compared against all values from any member of the group, without any regard
for homogeneity between one station’s record, and another. This approach is used due to the practical limitations of performing
homogeneity checks in real-time.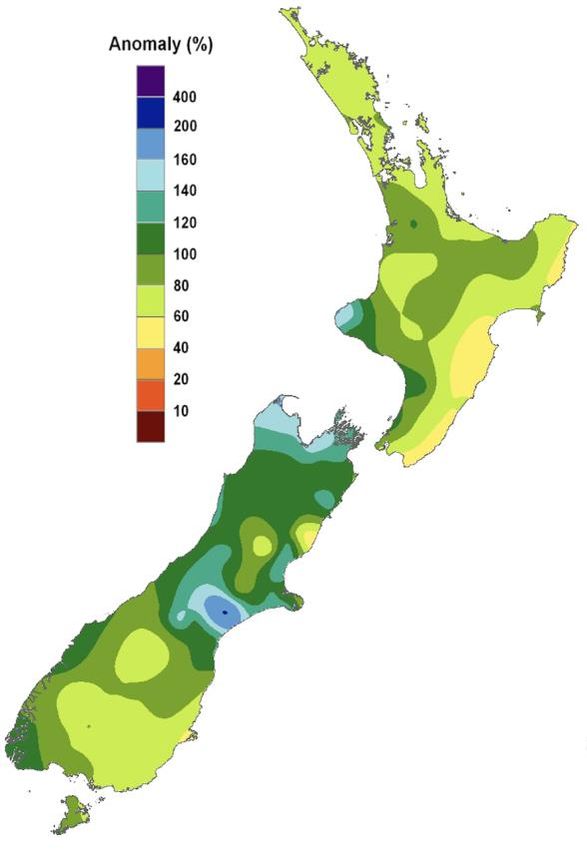
Campbell Island                  10.3             0.7          1991       Highest
 Hanmer Forest                    20.1             2.5          1906       2nd-highest
 Waiau                            20.2             2.0          1974       2nd-highest
 Kaikoura                         18.3             1.9          1963       2nd-highest
 Akaroa                           19.9             1.9          1978       2nd-highest
 Waipawa                          20.5             1.8          1945       2nd-highest
 Christchurch                     19.2             1.8          1863       2nd-highest
 Timaru                           18.1             1.4          1885       2nd-highest
 Porirua                          18.6             0.9          1968       2nd-highest
 Ohakune                          17.7             2.0          1962       3rd-highest
 Dunedin (Musselburgh)            17.0             1.9          1947       3rd-highest
 Waipara West                     20.2             1.6          1973       3rd-highest
 Motueka                          20.2             1.5          1956       3rd-highest
 Middlemarch                      18.0             1.5          2000       3rd-highest
 Whangarei                        22.0             1.3          1967       3rd-highest
 Le Bons Bay                      16.6             1.2          1984       3rd-highest
 Whitianga                        21.6             1.5          1962       4th-highest
 Ngawi                            19.1             1.0          1972       4th-highest
 Low records or near-records
 None observed

Record or near-record mean minimum air temperatures for autumn were recorded at:
 Location                         Mean         Departure        Year       Comments
                               minimum           from         records
                             air temp. (oC)     normal         began
                                                  (oC)
 High records or near-records
 Le Bons Bay                      10.2             1.1          1984       2nd-highest
 Low records or near-records
 Middlemarch                       2.6            -0.9          2000       4th-lowest

Rainfall: Extended periods of dryness and bursts of heavy rain
There were periods of extended dry spells for many parts of New Zealand, as well as significant
rainfall events. The last three days of autumn saw widespread rainfall totals of at least 100 mm in
the Canterbury region, leading to some areas receiving 2-3 times their May normal within a 72-hour
period. See the Highlights and extreme events section below for more details.
Record or near-record autumn rainfall totals were recorded at:
Location Rainfall Percentage Year Comments
total (mm) of normal records
began
High records or near-records
None observed
Low records or near-records
Auckland (Western Springs) 166 57 1948 Lowest
Tara Hills 72 57 1949 2nd-lowest
Tiwai Point 194 63 1970 3rd-lowest
Auckland (Airport) 182 67 1959 4th-lowestAutumn in the six main centres
Mean autumn temperatures were above average in all main centres except Hamilton, where the
mean temperature was near average. Auckland, Tauranga and Dunedin all experienced below
normal rainfall, while near normal rainfall was observed at Hamilton and Wellington. Christchurch
was the only centre to have above normal rainfall, but this was largely due to the extreme rain
during the last three days of autumn. Of the six main centres in autumn 2021, Auckland was the
warmest, Dunedin was the coolest and driest, Hamilton was the wettest, Christchurch was the
sunniest, and Hamilton was the least sunny.
Autumn 2021 main centre climate statistics:
Temperature
Location Mean temp. Departure Comments
(oC) from normal
(oC)
Aucklanda 16.9 +0.6 Above average
Taurangab 16.5 +0.8 Above average
Hamiltonc 14.7 +0.4 Near average
Wellingtond 14.3 +0.6 Above average
Christchurche 12.9 +0.9 Above average
Dunedinf 12.8 +1.3 Well above average
Rainfall
Location Rainfall (mm) % of normal Comments
a
Auckland 185 66 Below normal
Taurangab 193 59 Below normal
Hamiltonc 306 110 Near normal
Wellingtond 273 97 Near normal
Christchurche 208 141 Above normal
Dunedinf 83 46 Well below normal
Sunshine
Location2 Sunshine
(hours)
Aucklanda 518
Taurangab 545
Hamiltong 472
Wellingtond 582
Christchurche 594
Dunedinf 498
a Māngere b Tauranga Airport c Hamilton Airport d Kelburn e Christchurch Airport f Musselburgh g Ruakura
2Tauranga, Wellington and Christchurch record sunshine use Campbell-Stokes manual sunshine recorders, whereas Auckland, Hamilton
and Dunedin record sunshine with high-precision electronic sensors.Highlights and extreme events
This section contains information pertaining to some of the more significant highlights and extreme
events that occurred during autumn 2021. Note that a more detailed list of significant weather
events for autumn 2021 can be found in the Highlights and extreme events section of NIWA’s
monthly Climate Summaries. These monthly summaries are available online, and may be viewed at
the following website: https://niwa.co.nz/climate/monthly
Temperatures
The highest temperature during autumn 2021 was 31.9°C, observed at Waiau on 14 March.
The lowest temperature during autumn 2021 was -10.8°C, observed at Tara Hills on 27 May.
During autumn, several spells of intense heat affect eastern areas of the North and South Island. This
included:
- 2 March: Hastings and Napier both recorded temperatures over 30°C and their hottest
March day in 5 years.
- 4-5 April: numerous record and near-record temperatures occurred in the South Island,
including a maximum temperature of 30.8˚C in Timaru on 4 April, New Zealand’s 4th-highest
April temperature on record, and 30.7˚C in Bromley (Christchurch) on 5 April, New Zealand’s
equal-5th highest April temperature on record.
- 9-11 May: exceptionally high daily maximum and minimum temperatures, including 28.3°C
in Rangiora on 11 May, New Zealand’s 3rd-highest May temperature on record.
On 26 and 27 May, severe frosts were observed in many South Island areas. Most notable
was Tara Hills (Omarama), which recorded -10.8°C on 27 May. Dunedin Airport’s maximum
temperature on 27 May was just 3.2°C, which was that location’s lowest daily maximum air
temperature for May on record.
Record or near-record daily maximum air temperatures for autumn were recorded at:
Location Extreme Date of Year Comments
maximum extreme records
(°C) temperature began
High records or near-records
Le Bons Bay 29.0 Apr-5th 1984 Highest
Campbell Island 18.8 Mar-1st 1991 Highest
Waiau 31.9 Mar-14th 1974 3rd-highest
Low records or near-records
Dunedin (Airport) 3.2 May-27th 1972 Lowest
Record or near-record daily minimum air temperatures for autumn were recorded at:
Location Extreme Date of Year Comments
minimum extreme records
(°C) temperature began
Low records or near-records
Tara Hills -10.8 May-27th 1949 Lowest
Middlemarch -10.1 May-27th 2000 Lowest
Timaru -7.8 May-26th 1885 Lowest
Dunedin (Airport) -8.8 May-27th 1962 Equal lowestRangiora -5.2 May-27th 1965 2nd-lowest
Clyde -7.8 May-27th 1978 3rd-lowest
Appleby -3.9 May-26th 1932 3rd-lowest
Ranfurly -9.3 May-26th 1897 Equal 3rd-lowest
Puysegur Point 2.7 May-25th 1978 4th-lowest
High records or near-records
Clyde 19.1 Apr-5th 1978 Highest
Alexandra 18.6 Apr-5th 1930 Highest
Campbell Island 12.8 Mar-2nd 1991 Highest
Middlemarch 18.4 Apr-5th 2000 2nd-highest
Akaroa 19.5 Apr-5th 1978 3rd-highest
Cheviot 18.0 Apr-5th 1982 3rd-highest
Motu 16.4 Apr-12th 1990 3rd-highest
Le Bons Bay 17.5 Apr-5th 1984 4th-highest
Palmerston 15.7 Mar-2nd 1972 4th-highest
Windsor 15.2 Mar-2nd 2000 4th-highest
Rain and slips
The highest 1-day rainfall was 209 mm, recorded at Milford Sound on 8 May.
On 28 April, the government added the Mid Canterbury, South Canterbury, and Otago areas to a
large-scale adverse event classification for drought, while support for the large-scale adverse event
classification for drought was extended for Marlborough, North Canterbury, and the Chatham
Islands. This was due to an extended period of dryness for these areas.
From 29-31 May, a prolonged and heavy rainfall event struck Canterbury. A state of emergency was
declared across the region, with severe flooding occurring in many areas east of the eastern
foothills. The government declared a medium-scale adverse event, unlocking funding for recovery
measures. Damage caused by flooding was widespread, with numerous roads closed, bridges
damaged and impassable, and farms suffering considerable impacts to infrastructure and stock.
Hundreds of residents from several settlements were forced to evacuate, including the entire town
of Springfield. There were several reports of people getting caught by the floodwaters and requiring
rescue, including people becoming trapped after driving into floodwaters, and two individuals who
were rescued from trees after being swept away in the floods.
Record or near record autumn extreme 1-day rainfall totals were recorded at:
Location Extreme 1- Date of Year Comments
day rainfall extreme records
(mm) rainfall began
Opouriao 159 Apr-20th 1962 Highest
Waipara West 75 May-29th 1973 2nd-highest
Lake Tekapo 107 May-29th 1925 3rd-highest
Wind
The highest wind gust was 178 km/h, observed at South West Cape 4 April.On 4 April, strong northwesterly winds caused damage and power outages in parts of the lower
North Island and South Island.
From 23-24 May, a low pressure system east of the North Island generated strong winds and large
swells, generating extensive coastal erosion around Northland and parts of the Bay of Plenty.
Record or near record autumn extreme wind gusts were recorded at:
Location Extreme Date of Year Comments
wind gust extreme records
(km/h) gust began
Mt Cook (Airport) 145 Apr-5th 2000 Highest
South West Cape 178 Apr-4th 1991 Equal highest
Diamond Harbour 102 May-30th 1980 Equal highest
Secretary Island 148 Mar-5th 1994 2nd-highest
Gore 117 Apr-4th 1987 2nd-highest
Puysegur Point 154 Apr-4th 1986 Equal 3rd-highest
Mt Ruapehu (Chateau) 107 May-24th 2000 4th-highest
Dannevirke 89 May-18th 1961 4th-highest
Tara Hills 83 Apr-4th 1985 4th-highest
Oamaru 87 Apr-4th 1984 Equal 4th-highest
Snow and ice
On 18 May, snow fell to low elevations over much of the South Island, particularly in Southland. This
resulted in road closures.
Canterbury’s heavy rainfall event from 29-31 May also resulted in significant snowfalls at high
elevations. Mount Hutt ski area reported snow depths of 4 metres at the summit of their ski area
along the wind fence (~2,080 metres above sea level), tapering to just 5 cm at the bottom of their
triple chair (~1,440 metres above sea level).
Lightning and hail
Several periods of thunderstorm activity affected the North Island during March. Along with heavy
rainfall rates, marble-sized hail was reported around Waitomo caves on 11 March with a severe
thunderstorm. During 27 – 31 March, isolated daily thunderstorms erupted in parts of the North
Island, with over 2500 lightning strikes recorded over or near land during this period. And power
outages in Rotorua attributed to these thunderstorms.
Cloud and fog
Heavy fog was attributed to a six-vehicle pile-up on the Hawke’s Bay Expressway during the morning
of 15 March.
For further information please contact:
Tristan Meyers
Meteorologist / Forecaster
Tel. 09 375 4508Autumn rainfall Autumn temperature
Expressed as a percentage of the 1981-2010 normal. Expressed as a departure from the 1981-2010 average
Note, at the time of writing we have identified missing in degrees Celsius.
data from a climate station at Cheviot. This has
resulted in an inaccurate illustration of autumn rainfall
for an area of coastal north Canterbury. An updated
map was not ready in time for publication of this
summary.
https://www.niwa.co.nz/our-science/climate
© Copyright NIWA 2021.
All rights reserved. Information presented in this
summary is based on data available at the time of
publication, which is subject to ongoing quality assurance
procedures.You can also read