Dry for northern North Island, wet for much of South Island
←
→
Page content transcription
If your browser does not render page correctly, please read the page content below
New
New Zealand Climate Summary: September 2020 Issued: 6 October 2020
Dry for northern North Island, wet for much of South Island
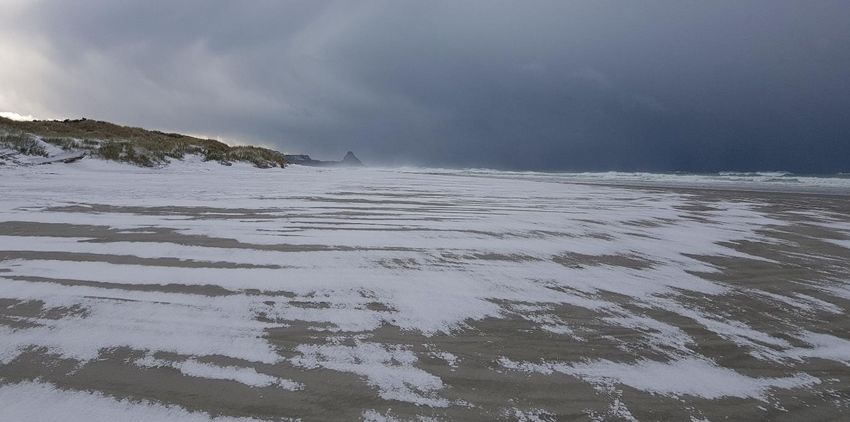
Rainfall Rainfall was well below normal (149% of
normal) rainfall was observed in much of the South Island and the southern North
Island including Southland, western and central Otago, north Canterbury, the
northern West Coast, Wellington, Wairarapa, the Kapiti Coast and Manawatu-
Whanganui. Rainfall was typically below normal for easternmost parts of the South
Island from Christchurch to Dunedin.
Temperature Temperatures were near average (±0.50°C of average) for most of the country.
Temperatures were above average (0.51°C to 1.2°C above average) in eastern parts of
Otago, Canterbury, Hawke’s Bay and Gisborne, as well as northern parts of Tasman
and Marlborough.
Soil Moisture As of 1 October, soil moisture was lower than normal for eastern parts of Otago and
Canterbury from Dunedin to Christchurch, as well as parts of Northland, Auckland,
coastal Bay of Plenty and East Cape. Soil moisture was considerably lower than
normal in North Otago and South Canterbury – these areas were categorised as “Dry”
or “Very Dry” according to NIWA’s New Zealand Drought Index. Soil moisture was
higher than normal in parts of western Otago and eastern Marlborough. Soil
moisture was typically near normal for remaining areas of New Zealand.
Click on the link to jump to the information you require:
Overview
Rainfall
Temperature
September 2020 climate in the six main centres
Highlights and extreme events
Overview
September 2020 was characterised by higher than normal mean sea level pressure over the northern
North Island and the Tasman Sea, with lower than normal pressures to the southeast of New Zealand.
This pressure set up resulted in a westerly airflow anomaly across the country (i.e. more westerly
winds than normal). The prevalence of high pressure over the northern North Island suppressed
rainfall, resulting in a very dry month for that area of the country. September rainfall was well below
normal (
southwestern parts of the North and South Islands, and much of the inland and northern portions of
the South Island. Rainfall was above normal (120-149% of normal) or well above normal >149% of
normal) for Southland, western and central Otago, north Canterbury, the northern West Coast,
Wellington, Wairarapa, the Kapiti Coast and Manawatu-Whanganui. Remaining parts of New Zealand
typically experienced near normal (80-119% of normal) rainfall totals for the month.

September temperatures were near average (-0.50 to +0.50°C of average) for most of the country. The
exception was eastern parts of Otago, Canterbury, Hawke’s Bay and Gisborne where temperatures
were above average (0.51°C to 1.20°C above average). These areas were located to the lee of the
inland mountain ranges given the prevailing westerly winds, and the mild temperatures were likely a
result of the Foehn effect (when air warms and dries as once it passes over elevated terrain).
September temperatures were also above average for northern parts of Tasman and Marlborough. It
was an especially warm month in Banks Peninsula, Motueka and Wairoa where September
temperatures were well above average (>1.20°C above average). Overall, the nationwide average
temperature in September 2020 was 11.0°C. This was 0.5°C above the 1981-2010 September average,
making it New Zealand’s seventeenth-warmest September since NIWA’s seven station temperature
series began in 1909. It has now been 44 consecutive months since New Zealand’s nationwide average
temperature was below average.

Further Highlights:

   •   The highest temperature was 25.5°C, observed at Hanmer Forest on 23 September.
   •   The lowest temperature was -7.5°C, observed at Middlemarch on 2 September.
   •   The highest 1-day rainfall was 239 mm, recorded at Milford Sound on 13 September.
   •   The highest wind gust was 187 km/h, observed at Cape Turnagain on 14 September.
   •   Of the six main centres in September 2020, Auckland was the warmest, Dunedin was the driest,
       Christchurch was the sunniest and coldest, Wellington was the wettest and Hamilton was the
       least sunny.
   •   Of the available, regularly reporting sunshine observation sites, the sunniest four regions in
       2020 so far are Bay of Plenty (1972 hours), Wider Nelson (1958 hours), Marlborough (1939
       hours) and Taranaki (1905 hours).

For further information, please contact:
Gregor Macara
Climate Scientist – NIWA Wellington
Tel. 04 386 0509

Rainfall: Near-record dry for parts of the northern North Island

It was a particularly dry month for much of Northland, Auckland and the Bay of Plenty where several
locations observed near-record low September rainfall totals. Rainfall was much lower than normal in
Northland, which continues the exceptionally variable pattern of monthly rainfall totals observed in
the region this year. In Kerikeri, monthly rainfall has been near normal (within 20% of normal) for just
two of the nine months so far this year. However, rainfall deficits from the four drier than normal
months (January, February, April and September) have been offset by the three wetter than usual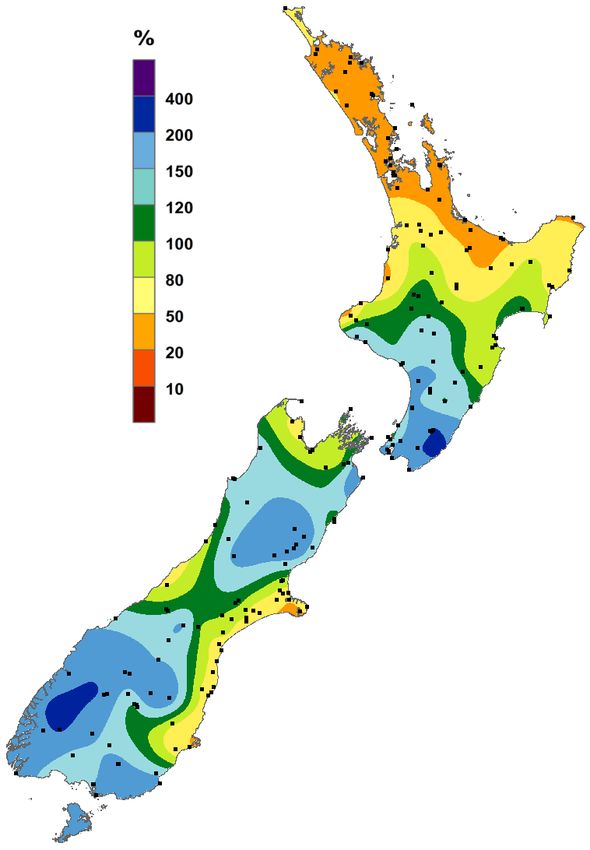
months (May, July and August), such that Kerikeri’s year-to-date rainfall total (1,321 mm) is only 3%
lower than normal.

New Zealand’s wettest location relative to normal was Lauder, where 52 mm of rainfall was recorded
(224% of normal). It was also very wet month in Milford Sound, which recorded 1000 mm of rainfall
(181% of normal). Although both locations observed a similar rainfall anomaly (i.e., difference from
normal), the absolute difference in September rainfall at the two locations (948 mm) demonstrates the
incredible precipitation gradients created by the Southern Alps. For context, the distance between
Milford Sound and Lauder is approximately the same as the distance between Auckland and Tauranga.

Record1 or near-record September rainfall totals were recorded at:

    Location                     Rainfall               Percentage        Year records Comments
                               total (mm)                of normal           began
    High records or near-records
    Manapouri (West Arm Jetty)    740                       239                1971          2nd-highest
    Manapouri                     210                       198                1961          3rd-highest
    Tiwai Point                   161                       187                1970          3rd-highest
    Dannevirke                    166                       186                1951          4th-highest
    Low records or near-records
    Kaikohe                        42                        34                1956          2nd-lowest
    Auckland (Whenuapai)           37                        36                1943          2nd-lowest
    Auckland (Western Springs)     39                        37                1948          2nd-lowest
    Te Puke                        48                        38                1973          2nd-lowest
    Kerikeri                       46                        28                1935          3rd-lowest
    Whangarei                      36                        27                1937          3rd-lowest
    Leigh                          38                        40                1966          3rd-lowest
    Auckland (North Shore)         47                        45                1966          3rd-lowest
    Tauranga                       28                        33                1898          3rd-lowest
    Auckland (Mangere)             43                        45                1959          3rd-lowest
    Whitianga                      65                        38                1961          4th-lowest
    Whakatane                      33                        35                1952          4th-lowest

Temperature: Mostly near average, above average in eastern parts

Le Bons Bay was New Zealand’s warmest location relative to average: the mean temperature (11.4°C)
was 2.2°C higher than average. The country’s coldest location relative to average was Cromwell (8.1°C,
0.8°C lower than average). Many eastern locations observed a larger diurnal range than usual (i.e.
higher daily maximum and lower daily minimum temperatures compared to average), indicating clear
skies featured during the month. This was confirmed by sunshine data: Napier, Blenheim, Cheviot,
Winchmore and Rangiora each observed their highest September sunshine totals on record.

1The rankings (1st, 2nd, 3rd.etc) in all Tables in this summary are relative to climate data from a group of nearby stations, some
of which may no longer be operating. The current climate value is compared against all values from any member of the
group, without any regard for homogeneity between one station’s record, and another. This approach is used due to the
practical limitations of performing homogeneity checks in real-time.
Record or near-record mean air temperatures for September were recorded at:

 Location                         Mean air     Departure from      Year       Comments
                                 temp. (oC)      normal (oC)     records
                                                                  began
 High records or near-records
 Farewell Spit                     13.6             1.8           1971        Highest
 Le Bons Bay                       11.4             2.2           1984        Highest
 Motueka                           11.8             1.5           1956        2nd-highest
 Wairoa                            13.4             1.5           1964        3rd-highest
 Cheviot                           10.2             0.7           1982        3rd-highest
 Akaroa                            11.7             1.3           1978        3rd-highest
 Gisborne                          13.6             1.7           1905        4th-highest
 Low records or near-records
 None observed

Record or near-record mean maximum air temperatures for September were recorded at:

 Location                          Mean        Departure from   Year records    Comments
                                maximum air      normal (oC)       began
                                 temp. (oC)
 High records or near-records
 Farewell Spit                     17.9             2.5             1971        Highest
 Motueka                           18.2             2.5             1956        Highest
 Le Bons Bay                       15.9             3.5             1984        Highest
 Whangarei                         18.5             1.0             1967        2nd-highest
 Waipawa                           17.1             1.8             1945        2nd-highest
 Cheviot                           16.3             1.2             1982        2nd-highest
 Whitianga                         18.0             1.2             1962        3rd-highest
 Gisborne                          18.7             1.7             1905        3rd-highest
 Wairoa                            19.1             2.2             1964        3rd-highest
 Takaka                            17.1             1.3             1978        3rd-highest
 Leigh                             18.2             1.8             1966        4th-highest
 Low records or near-records
 None observed

Record or near-record mean minimum air temperatures for September were recorded at:

 Location                          Mean        Departure from   Year records    Comments
                                minimum air      normal (oC)       began
                                 temp. (oC)
 High records or near-records
 Le Bons Bay                        7.0             1.0             1984        3rd-highest
 Ngawi                             10.4             0.8             1972        4th-highest
 Medbury                            4.4             1.8             1927        4th-highest
 Low records or near-records
 None observed
September climate in the six main centres
Of the six main centres in September 2020, Auckland was the warmest, Dunedin was the driest,
Christchurch was the sunniest and coldest, Wellington was the wettest and Hamilton was the least
sunny. It was a particularly windy month in Wellington, where the mean wind speed (measured at
Kelburn) was 24.8 km/h. This was Wellington’s highest monthly mean wind speed since October 2009,
when the mean wind speed was 25.2 km/h. It was Christchurch’s sunniest September on record,
exceeding its previous sunniest September by 39.7 hours. The Garden City observed more sunshine
during September than it normally records in December (220 hours) and January (238 hours), a
remarkable feat given the difference in daylight hours between September and December/January.
Dunedin observed a bitterly cold day on 29 September with weather conditions akin to a ski field: from
9 a.m. to 2 p.m. the mean temperature was just 0.9°C, with wind gusts reaching 73.8 km/h and
frequent snow showers passing through the city.
September 2020 main centre climate statistics:
Temperature
Location Mean temp. Departure Comments
(oC) from normal
(oC)
Aucklanda 13.1 +0.1 Near average
Taurangab 12.9 +0.5 Near average
Hamiltonc 11.4 +0.1 Near average
Wellingtond 10.9 +0.1 Near average
Christchurche 9.9 +0.5 Near average
Dunedinf 10.2 +0.7 Above average
Rainfall
Location Rainfall (mm) % of normal Comments
Aucklanda 43 45 Well below normal. 3rd-lowest on record
Taurangab 28 33 Well below normal. 3rd-lowest on record
Hamiltonc 72 71 Below normal
Wellingtond 196 200 Well above normal
Christchurche 35 86 Near normal
Dunedinf 23 48 Well below normal
Sunshine
Location Sunshine
(hours)
Aucklanda 186
Taurangab 217
Hamiltong 167
Wellingtond 196
Christchurche 260
Dunedinf 185
a b c d e f g
Mangere Tauranga Airport Hamilton Airport Kelburn Christchurch Airport Musselburgh RuakuraHighlights and extreme events Temperatures On 1 September, several South Island locations observed near-record low September daily maximum temperatures. The cold temperatures resulted from a southerly front that delivered snow to relatively low elevations. On 12 September, clear skies and light winds following the passage of a cold front allowed a heavy frost to develop in many parts of the South Island. Christchurch Airport recorded a minimum temperature of -4.7°C; the city’s second-lowest September temperature since records began in 1863. From 23-27 September, a warm northerly airflow covered much of New Zealand, with numerous locations observing record or near-record high daily minimum and maximum temperatures. From 28-30 September, a bitterly cold southerly outbreak brought unseasonably low temperatures to many parts of the South Island. The coldest air of the system passed over during 29 September, when several locations observed record or near-record low daily maximum temperatures for September. The prevalence of negative air temperatures at many low elevation coastal locations on 29 September indicates that the free air freezing level was situated at around sea level (0 m elevation), which is particularly impressive given the time of year. The air was so cold as it was sourced from Antarctica, and travelled on a relatively direct path towards New Zealand (Figure 1). The southerly airflow was established by a very deep low pressure system in the Southern Ocean, with central air pressures as low as 938 hPa. This system met the criteria of a “bomb cyclone” as it strengthened at a pace of ≥24 hPa in 24 hours. The cold air temperatures combined with strong winds resulted in severe wind chill factors, which created stress for livestock, and meant it felt much colder than the measured air temperature. At Nugget Point between 9-10 a.m., the lowest temperature was -1.1°C and the maximum wind gust was 137.1 km/h, resulting in a “feels like” temperature as low as -13.5°C. Figure 1. HYSPLIT trajectory output for 8 a.m. 29 September 2020 (NZDT) out to -120 hours. The red-dotted trace indicates the 5-day track of the airmass that started over Antarctica at 8 a.m. on 24 September 2020, and arrived over Dunedin at 8 a.m. on 29 September 2020. Data credit: NOAA Air Resources Laboratory. Image credit: Todd Redpath.
On a given day (24-hour period) at New Zealand locations, the lowest daily temperatures observed
typically occur overnight under clear skies and light winds. Remarkably, this wasn’t the case for several
low elevation locations on 29 September, where lowest daily temperatures were observed near the
middle of the day. Locations where this occurred included Dunedin (Musselburgh; -0.2°C between 10-
11 a.m.), Balclutha (-0.7°C between 12-1 p.m.) and Tiwai Point (-1.5°C between 10-11 a.m.). Perhaps
most notably, Nugget Point recorded its lowest ever September temperature of -1.4°C between 11
a.m. and midday.

Several Canterbury locations observed near-record low minimum temperatures on 30 September
during the early morning hours. Christchurch recorded a minimum temperature of -4.8°C, the equal-
lowest September temperature ever observed in the city. A temperature of -4.8°C was also recorded at
Christchurch Gardens in September 1919. As noted previously, temperature records at Christchurch
began in 1863.

The highest temperature was 25.5°C, observed at Hanmer Forest on 23 September. The lowest
temperature was -7.5°C, observed at Middlemarch on 2 September.

Record or near-record daily maximum air temperatures for September were recorded at:

 Location                            Extreme            Date of          Year     Comments
                                   maximum (°C)         extreme        records
                                                      temperature       began
 High records or near-records
 Cheviot                                25.2             23rd           1982      Highest
 Le Bons Bay                            24.1             17th           1984      Highest
 Dargaville                             23.8             26th           1943      2nd-highest
 Whangaparaoa                           21.5             23rd           1982      2nd-highest
 Whangarei                              23.5             26th           1967      3rd-highest
 Akaroa                                 25.2             23rd           1978      3rd-highest
 Hamilton (Ruakura)                     22.3             26th           1906      Equal 3rd-highest
 Whakatu                                25.3             22nd           1965      4th-highest
 Farewell Spit                          19.9             24th           1971      4th-highest
 Low records or near-records
 Secretary Island                        6.0             28th           1989      Lowest
 Puysegur Point                          6.2             28th           1978      Lowest
 Dunedin (Airport)                       5.2             29th           1972      Lowest
 Manapouri (West Arm Jetty)              1.9             28th           1972      Lowest
 Alexandra                               4.6             29th           1930      Lowest
 Clyde                                   5.7             29th           1978      Equal lowest
 Mt Cook (Airport)                       0.4              1st           1929      2nd-lowest
 Rangiora                                6.2              1st           1972      2nd-lowest
 Oamaru                                  6.8             29th           1972      2nd-lowest
 Balclutha                               4.6             29th           1972      2nd-lowest
 Nugget Point                            3.2             29th           1972      2nd-lowest
 Westport                                9.4             29th           1966      Equal 2nd-lowest
 Waiau                                   5.6              1st           1974      Equal 2nd-lowest
 Roxburgh                                5.3             28th           1950      Equal 2nd-lowest
 Cheviot                                 6.4              1st           1982      3rd-lowest
Waipara West 6.1 1st 1973 3rd-lowest
Five Rivers 3.8 29th 1982 3rd-lowest
Gore 2.8 29th 1907 3rd-lowest
Tiwai Point 6.3 28th 1972 Equal 3rd-lowest
Culverden 4.8 1st 1930 4th-lowest
Te Anau 4.5 28th 1973 4th-lowest
Lumsden 4.5 29th 1982 4th-lowest
Cromwell 5.7 1st 1949 4th-lowest
Record or near-record daily minimum air temperatures for September were recorded at:
Location Extreme Date of Year Comments
minimum extreme records
(°C) temperature began
High records or near-records
Hastings 16.0 27th 1972 Highest
Waiouru 10.7 24th 1972 Highest
Le Bons Bay 15.4 23rd 1984 Highest
Cape Reinga 14.8 27th 1971 Equal highest
Kaitaia 16.1 27th 1948 2nd-highest
Whangarei 16.8 27th 1967 2nd-highest
Paeroa 16.0 27th 1971 2nd-highest
Napier 16.8 24th 1940 2nd-highest
Wairoa 16.4 27th 1972 2nd-highest
Porirua 13.3 24th 1972 2nd-highest
Hawera 13.9 27th 1977 2nd-highest
Motueka 13.3 27th 1972 2nd-highest
Lincoln 14.2 23rd 1881 2nd-highest
Tauranga 15.8 27th 1941 Equal 2nd-highest
Dargaville 15.3 27th 1951 3rd-highest
Port Taharoa 14.8 27th 1974 3rd-highest
Medbury 14.5 23rd 1927 3rd-highest
Waipawa 12.7 27th 1945 Equal 3rd-highest
Ohakune 11.4 27th 1972 Equal 3rd-highest
Hanmer Forest 12.8 23rd 1972 Equal 3rd-highest
Kaikohe 15.1 27th 1973 4th-highest
Warkworth 15.5 27th 1966 4th-highest
Te Puke 14.8 27th 1973 4th-highest
Ngawi 15.2 24th 1972 4th-highest
Whakatu 15.1 27th 1972 4th-highest
Low records or near-records
Le Bons Bay -0.9 18th 1984 Lowest
Nugget Point -1.4 30th 1970 Lowest
Puysegur Point 1.1 29th 1978 Equal lowest
Christchurch -4.8 30th 1863 Equal lowest
Ohakune -5.2 4th 1962 2nd-lowest
Motu -5.0 13th 1990 Equal 2nd-lowestTiwai Point -1.5 30th 1970 Equal 2nd-lowest
Mt Cook (Airport) -7.0 3rd 1929 3rd-lowest
Te Kuiti -2.0 4th 1959 Equal 3rd-lowest
Secretary Island 1.3 29th 1985 4th-lowest
Winchmore -4.7 30th 1928 4th-lowest
Lumsden -4.3 2nd 1982 4th-lowest
Appleby -2.9 12th 1932 Equal 4th-lowest
Cheviot -3.6 30th 1982 Equal 4th-lowest
Rangiora -3.6 12th 1965 Equal 4th-lowest
Rain and slips
On 6 September, heavy rain caused a slip on SH6 through the lower Buller Gorge (between Westport
and Inangahua), forcing the road to close temporarily.
On 18 September, several hours of heavy rain fell in the Wellington region. Metlink reported flooding
in the Taita subway (Hutt Valley). Fire and Emergency crews reported responding to several call outs
due to flooding.
On 26-27 September, heavy rain struck the Wellington region. Several roads were closed temporarily
due to flooding and slips, including Grays Road between Plimmerton and Pauatahanui, Glenmore
Street in Kelburn, Wainuiomata Hill, and Block Road adjacent to Hutt River. This was one of four heavy
rainfall events observed in Wellington during the month. Overall, both climate stations at Kelburn and
the Airport observed 200% of normal September rainfall.
The highest 1-day rainfall was 239 mm, recorded at Milford Sound on 13 September.
Record or near-record September extreme 1-day rainfall totals were recorded at:
Location Extreme 1-day Date of extreme Year records Comments
rainfall (mm) rainfall began
Stratford 89 26th 1960 3rd-highest
Manapouri (West Arm Jetty) 129 13th 1971 3rd-highest
South West Cape 36 12th 1991 3rd-highest
Upper Hutt (Trentham) 56 26th 1939 4th-highest
Milford Sound 239 13th 1929 4th-highest
Wind
On 9 September, strong winds hampered efforts to control a fire near Macraes (approximately 50 km
north of Dunedin). The fire started had started as a controlled burn-off, but winds caused it to flare up
and burn beyond its designated area.
On 18 September, strong winds occurred in Auckland. A shipping container truck travelling south on
the Harbour Bridge was blown sideways causing structural damage to the bridge. By the end of
September, lane closures remained in place to allow repair work.
On 23 September, strong northerly winds in Wellington caused the East by West ferry service to
reduce sailings.From 27-28 September, winds brought down trees in the Wellington region. Widespread power
outages were reported in Wainuomata, Eastborne, Plimmerton Pukerua Bay, Judgeford, Tawa, Elsdon,
Grenada North, Takapu Valley and Pauatahanui with approximately 2000 residents affected.
Paraparaumu also experienced strong winds, with fences, trees, a shipping container and a shed blown
over in and near Mazengarb Reserve and Kapiti Sports Turf and Pavilion.
On 29 September, more than 700 properties across the wider Whanganui region were without power
after strong winds brought down trees onto powerlines. The Auckland Harbour Bridge was closed due
to strong wind gusts. Four cars and a street light in Hamilton were crushed by a falling tree. Farther
south, a fallen tree caused traffic delays in Little River (between Christchurch and Akaroa).
The highest wind gust was 187 km/h, observed at Cape Turnagain on 14 September.
Record or near-record September extreme wind gusts were recorded at:
Location Extreme Date of Year records Comments
wind gust extreme began
(km/h) gust
Upper Hutt (Trentham) 98 28th 1999 Highest
Hawera 104 29th 1986 Highest
Westport 120 15th 1973 Highest
Secretary Island 156 26th 1994 Highest
Palmerston North 96 15th 1991 Equal highest
Motu 107 27th 1991 2nd-highest
Levin 95 28th 1971 2nd-highest
Brothers Island 139 28th 1997 3rd-highest
Farewell Spit 98 28th 1973 Equal 3rd-highest
Reefton 57 28th 1999 Equal 3rd-highest
Hanmer Forest 98 17th 1995 4th-highest
Clyde 74 16th 1983 4th-highest
Turangi 89 15th 1973 Equal 4th-highest
Mt Kaukau (Wellington) 145 27th 1969 Equal 4th-highest
Snow and ice
On 1 September, snow fell to relatively low elevations throughout the South Island. Snow flurries
were reported in parts of Ashburton and Timaru, with snow accumulations to the valley floor reported
in several inland Southland, Otago and Canterbury locations including Kingston, Arrowtown, the
Maniototo, Lake Tekapo and Castle Hill Village. The cold front delivered a welcome dump of fresh
snow to ski areas which had suffered from a relative lack of snow during winter. Coronet Peak (near
Queenstown) reported 25-40 cm of fresh snow, while farther north Craigieburn (Canterbury, north of
Castle Hill Village) reported 42 cm of fresh snow. The snowfall provided relief to firefighters battling a
large scrub fire near SH80 between Twizel and Mount Cook Village.
From 28-29 September, snow settled to sea level in Otago, Southland and Stewart Island (Figure 2). It
was the most widespread low-elevation snowfall of the year to-date, with polar air drawn from
Antarctica by a deep low pressure system in the Southern Ocean. There were widespread road
closures in Southland and Otago, and snow also caused the closure of SH6 between Fox Glacier and
Franz Josef Glacier. Approximately 50 cars and trucks were stranded on SH1 north of Balclutha due toblizzard conditions, with police and council contractors called in to move the vehicles safely. Flights at Invercargill, Dunedin and Queenstown Airports were disrupted by snow on their runways and poor visibility. The Remarkables ski area reported up to 60 cm of fresh snow, and the snow density was relatively low due to very cold air temperatures associated with the snowfall. Snow also fell to low elevations in Nelson and Tasman, with several road closures including SH63 from Kawatiri to St Arnaud and Canaan Road (Takaka Hill). Figure 2. Snow on the beach at Waldronville (near Dunedin) on 29 September 2020. Credit: Todd Redpath Lightning and hail On 6 September, a late-afternoon southerly change generated several thunderstorms over parts of Canterbury, especially towards the eastern foothills. Heavy hail was reported in the town of Oxford, which blanketed the ground white. Fire and Emergency responded to several calls in Oxford where household roofs were leaking. At least 900 lightning strikes were recorded over the area between Methven and Amberley. On 15 September, thunderstorms delivered at least 2000 lightning strikes over the South Island, especially about the West Coast. On 27 September, an Air New Zealand flight travelling from Invercargill to Auckland was struck by lightning shortly after take-off. In the early hours of 28 September, thunderstorms struck parts of Taranaki with heavy hail reported near Rahotu. Cloud and fog On 21 September, early morning fog in Timaru caused flight delays at the local airport.
For further information, please contact:
Gregor Macara
Climate Scientist – NIWA Wellington
Tel. 04 386 0509

 September rainfall                                    September temperature
 Expressed as a percentage of the 1981-2010 normal.    Expressed as a departure from the 1981-2010 average.

                                 https://www.niwa.co.nz/our-science/climate

                                             © Copyright NIWA 2020

                        All rights reserved. Information presented in this summary is
                        based on data available at the time of publication, which is
                        subject to ongoing quality assurance procedures.
You can also read