EUROPEAN STATE OF THE CLIMATE
←
→
Page content transcription
If your browser does not render page correctly, please read the page content below

EUROPEAN STATE
OF THE CLIMATE
—
SUMMARY 2020

               IMPLEMENTED BY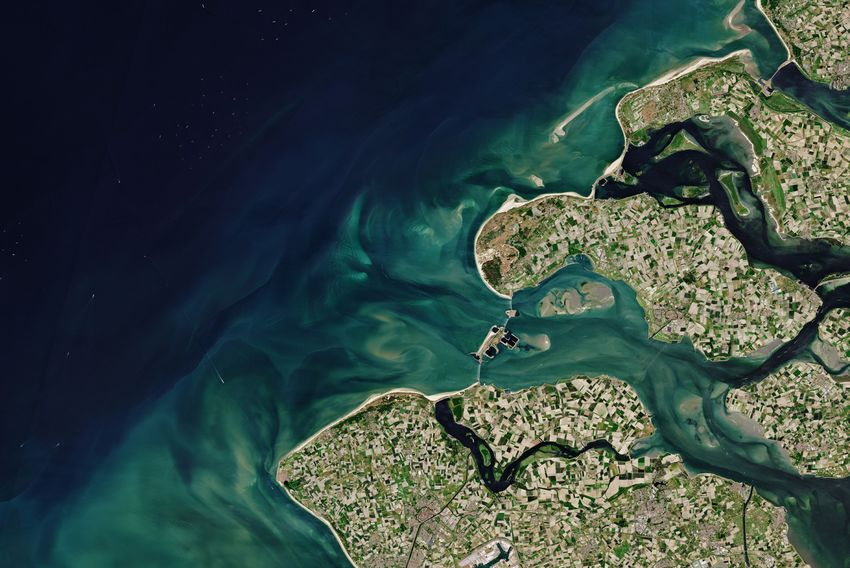
Cover image: European Union,
                                                                                     3    INTRODUCTION
contains modified Copernicus Sentinel
imagery, processed by Annamaria
Luongo/SpaceTec Partners 2020.

                                                                                          GLOBAL CONTEXT IN 2020
Image below: The snow-covered Alps,
captured by the Copernicus Sentinel-3                                                4
mission. Credit: contains modified
Copernicus Sentinel data (2020),
processed by ESA.

                                                                                     5    EUROPE IN 2020

                                                                                     10   THE ARCTIC IN 2020

                                                                                     13   TRENDS IN CLIMATE INDICATORS

REPORT                                                                                    ABOUT THE REPORT
SECTIONS
                                                                                     17

                                                                                     18   BEYOND THE ESOTC

        This is an interactive document                                              19   ABOUT US
        The top toolbar and contents buttons allow you to navigate
        through the different sections of the report.

Copernicus Climate Change Service               European State of the Climate 2020   20   CONTACT
GLOBAL CONTEXT           EUROPE       THE ARCTIC            TRENDS IN               ABOUT              BEYOND
INTRODUCTION                                                                                                                                 ABOUT US       CONTACT
                       IN 2020              IN 2020       IN 2020          CLIMATE INDICATORS        THE REPORT          THE ESOTC

   INTRODUCTION

   European State of
   the Climate 2020
   —                                                                                                                                                      Image: Kiruna, the northernmost
   Welcome to the summary of the European State of the Climate                                                                                            town in Sweden. Credit: contains
   2020, compiled by the Copernicus Climate Change Service (C3S),                                                                                         modified Copernicus Sentinel
                                                                                                                                                          data (2020), processed by ESA.
   implemented by the European Centre for Medium-Range Weather
   Forecasts (ECMWF) on behalf of the European Commission.                                                  Atmospheric concentrations       In early spring, there was a remarkable
                                                                                                            of the greenhouse gases          transition from wet to dry conditions in
                                                                                                            CO2 and CH4 continued to         northwestern and northeastern Europe,
                                                C3S provides climate monitoring for the                     rise and are at their highest    as captured in precipitation levels, river
               Explore the complete             globe, Europe and the Arctic, and annually                  levels on record. Globally, it   discharge and vegetation cover. Several
               ESOTC                            releases the European State of the           was one of three warmest years on record.       episodes of very warm weather occurred
               The complete report              Climate (ESOTC). For 2020, the ESOTC         Over northern Siberia, temperatures             during the summer and November.
               is available online at:          includes a short overview of the global      reached more than 6°C above average for         Although many temperature records were
               climate.copernicus.eu/           context in 2020, a more comprehensive        the year as a whole, with dry conditions        broken, the heatwaves were not as
               ESOTC/2020                       overview of conditions in Europe, and a      and record-breaking fire activity during        intense, widespread or long-lived as
                                                focus on the Arctic. This report provides    summer. In the adjacent Arctic seas, sea        others of recent years.
                                                a detailed analysis of the past calendar     ice was at a record low for most of the
               Throughout the report you        year, with descriptions of climate           summer and autumn.                              For Europe as a whole, 2020 showed
               will find symbols which          conditions and events, and explores                                                          close-to-average fire danger conditions,
               indicate the types of data       the associated variations in key climate     In 2020, the annual temperature for             with periods of locally above-average
               and the reference period         variables from across all parts of the       Europe was the highest on record. Winter        conditions, most notably in the Balkans
               used for each section.           Earth system. The ESOTC also gives           was particularly warm, also setting a           and eastern Europe during spring months.
               More information on these        updates on the long-term trends of           record, at more than 3.4°C above average.       Total emissions from wildfires in Europe
               are in About the report.         key climate indicators.                      This had an impact on snow cover and            were lower than average.
                                                                                             sea ice, particularly around the Baltic Sea.

   Copernicus Climate Change Service            European State of the Climate 2020                                                                                                      3
GLOBAL CONTEXT          EUROPE         THE ARCTIC               TRENDS IN                        ABOUT              BEYOND
INTRODUCTION                                                                                                                                            ABOUT US         CONTACT
                        IN 2020             IN 2020         IN 2020             CLIMATE INDICATORS                 THE REPORT          THE ESOTC

   Global                                                                                                                                                          Sea ice

   context
                                                                                                                                                         Arctic sea ice reached its second lowest
                                                                                                                                                         extent on record, while Antarctic sea ice
                                                                                                                                                         extent was close to average around its
                                                                                                                                                         annual minimum.

   in 2020                                                                                                                                                         Sea level

   —                                                                                                                                                     Data are only available until June 2020,
                                                                                                                                                         however, during this period, global mean
                                                                                                                                                         sea level continued to rise.
   The evolution of key climate
   indicators provides the global                                    -7   -5   -3   -2   -1   -0.5   0   0.5   1    2   3   5   7 °C
                                                                                                                                                                   Glaciers
   context for 2020.                             Surface air temperature for 2020, shown relative to the 1981–2010 average.
                                                 Data source: ERA5 Credit: C3S/ECMWF.
                                                                                                                                                         Due to the COVID-19 pandemic,
                                                                                                                                                         several field campaigns were delayed
   The global context is given by the Climate                                                                                                            or cancelled, affecting the availability of
                                                            Temperature                                             Greenhouse gases                     comprehensive data coverage for 2020
   Indicators for which data are available for
   the majority of the year. These indicators                                                                                                            at the time of publication.
   typically build on multi-source or            Globally, 2020 was one of three warmest                 Atmospheric concentrations of the
   community estimates, leading to a delay       years on record. Over parts of the Arctic               greenhouse gases CO2, CH4 and N2O
   for producing final data records, and so      and northern Siberia, temperatures                      were at their highest since satellite-based
   not all indicators are covered here.          reached more than 6°C above average.                    observations started in 2003. Preliminary
                                                 Below-average temperatures were                         analysis indicates that CO2 increased at a
   Additional information about the global       recorded over the eastern equatorial                    somewhat lower rate than in recent years,
   climate during 2020 can be found in the       Pacific later in the year, associated with              while CH4 increased more rapidly. These
   World Meteorological Organization (WMO)       cooler La Niña conditions.                              changes are likely due to a slight reduction
   statement on the State of the Global                                                                  in emissions linked to the COVID-19
   Climate in 2020.                                                                                      pandemic and to warm temperatures                         Click here to
                                                                                                         leading to increased CO2 and CH4 fluxes                   find out more
                                                                                                         associated with land surfaces.

   Copernicus Climate Change Service             European State of the Climate 2020                                                                                                                    4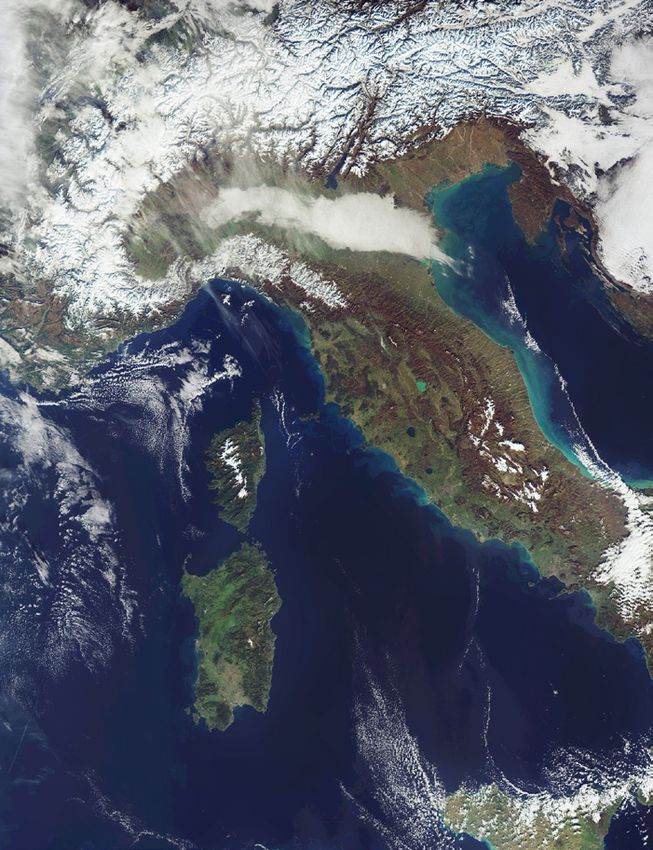
GLOBAL CONTEXT       EUROPE       THE ARCTIC            TRENDS IN          ABOUT       BEYOND
INTRODUCTION                                                                                                          ABOUT US        CONTACT
                        IN 2020          IN 2020       IN 2020          CLIMATE INDICATORS   THE REPORT   THE ESOTC

   Europe                                       Winter in northeastern Europe
                                              was nearly 1.9°C warmer than the
                                                                                                                                 Image: The Copernicus Sentinel-2
                                                                                                                                 mission takes us over Zeeland – the
                                                                                                                                 westernmost province in the
                                                                                                                                 Netherlands. Credit: contains

   in 2020
                                                                                                                                 modified Copernicus Sentinel data
                                               previous record, with low sea ice                                                 (2020), processed by ESA.
                                                 cover for the Baltic Sea and a
                                                low number of days with snow
   —                                                     in some areas.

   Europe saw its warmest year,
   winter and autumn on record.
   Wet and dry conditions varied
   substantially across the region
   and the year.                                 The start of the year saw a
                                               remarkable transition from wet
   This section provides the 2020 view
   for Europe compared to the long-term
                                              to dry conditions. In northwestern
   trends of variables across the climate      Europe, it was one of the driest
   system. Key events that occurred during            springs on record.
   the year are also described within a
   climatic context.

               Click here to
               find out more

   Copernicus Climate Change Service         European State of the Climate 2020                                                                                        5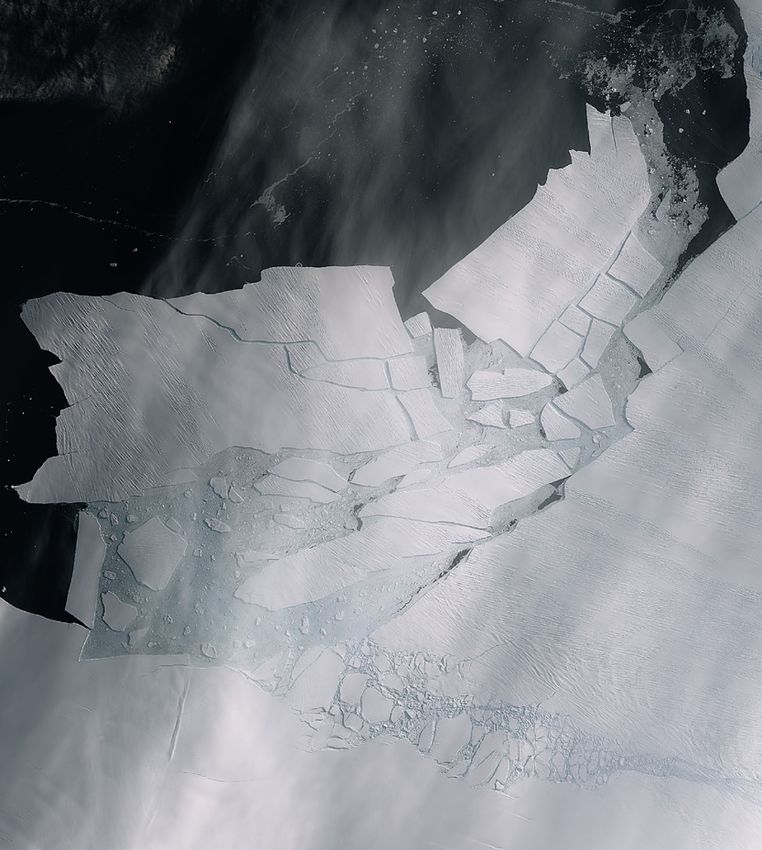
GLOBAL CONTEXT          EUROPE       THE ARCTIC            TRENDS IN             ABOUT             BEYOND
INTRODUCTION                                                                                                                            ABOUT US       CONTACT
                        IN 2020             IN 2020       IN 2020          CLIMATE INDICATORS      THE REPORT         THE ESOTC

   Temperature                                  Heat and cold stress                        Lake surface                                 Clouds and
               The annual temperature for                 eat stress levels are
                                                          H                                 temperatures                                 sunshine duration
                Europe was the highest on                 increasing across Europe.
                record.                                                                               T he surface water                           unshine duration is
                                                                                                                                                   S
                                                                                                       temperature of European                     increasing across Europe.
   In 2020, the annual temperature for          During the summer months, the number                   lakes is increasing.
   Europe was the highest on record; at least   of days with high heat stress levels
   0.4°C warmer than the next five warmest      are increasing throughout Europe. The       The surface water temperature of             2020 saw the largest number of sunshine
   years, which all occurred during the last    number of winter daytimes with cold         European lakes was just 0.03°C above         hours since satellite records began in
   decade. Winter and autumn were the           stress has decreased over time in           the 1996–2016 average during their           1983. This large annual anomaly was
   warmest on record; the winter record         northern Europe.                            2020 warm season, from July to               driven by significantly above-average
   was particularly substantial, at more than                                               September. This is a small positive          sunshine duration from January to May.
   3.4°C above the 1981–2010 average            For summer 2020, only a few regions of      anomaly, especially when compared with       The largest anomaly values were found
   and around 1.4°C warmer than the             western, central and northern Europe saw    the record of over 0.8°C above average       in parts of central and eastern Europe.
   previous warmest winter.                     a maximum heat stress level that was        reported in 2018. While temperatures
                                                very different to average. During winter,   were close to average for the year as        In line with the high number of sunshine
   The regions with the largest anomalies       the region of ‘moderate cold stress’        a whole, there was wide variability          hours, cloud cover was at a record low
   during winter and autumn were in the         reached less far to the south and west      throughout the warm season, with             for 2020. The largest below-average
   northeastern and eastern parts of            than on average, both for nighttime and     temperatures both above and below            anomalies were found over central
   Europe, respectively.                        daytime cold stress levels.                 average. The warm season European lake       Europe and across the land areas
                                                                                            surface temperatures are increasing at an    bordering the central and eastern
   During winter, maximum and minimum                                                       average rate of around 0.4°C per decade.     Mediterranean Sea.
   temperatures over northeastern                            1981–2010
   Europe were up to 6°C and 9°C warmer,                                                                                                              1991–2020
   respectively, than the 1981–2010 average.                                                            1996–2016

                      1981–2010

   Copernicus Climate Change Service            European State of the Climate 2020                                                                                                  6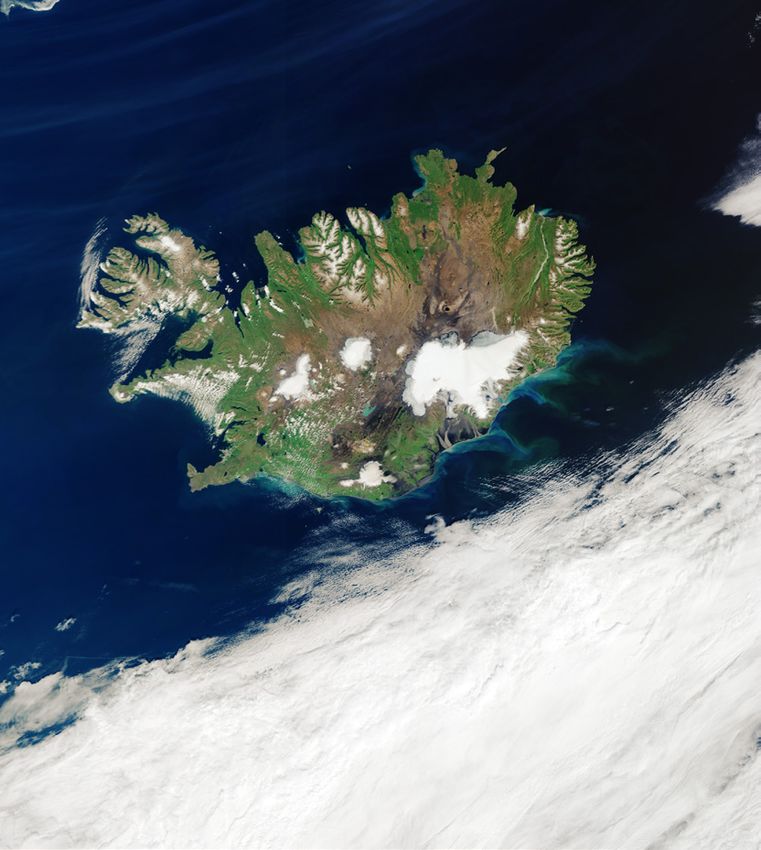
GLOBAL CONTEXT         EUROPE        THE ARCTIC            TRENDS IN               ABOUT                 BEYOND
INTRODUCTION                                                                                                                                    ABOUT US   CONTACT
                        IN 2020            IN 2020        IN 2020          CLIMATE INDICATORS        THE REPORT             THE ESOTC

                                                                                            Number of 'ice days' – Winter 2020
                                                                                                                                                              90
   Warm winter                                  Heatwaves and
               Record-breaking warmth          warm spells                                                                                                   80

                across a large area of                                                                                                                        70
                northeastern Europe.                       ummer heatwaves
                                                          S
                                                          were less intense, less
                                                                                                                                                              60
   Winter in northeastern Europe was                      widespread, and shorter-
   exceptionally warm, with average                       lived than in recent years.
                                                                                                                                                              50
   temperatures nearly 1.9°C higher than
   the previous record. This led to unusually   Several episodes of very warm weather
   low sea ice cover in the northern part of    occurred during the summer, affecting                                                                         40

   the Baltic Sea and the Gulf of Finland,      different regions each month. In June,
                                                Scandinavia and eastern Europe                                                                                30
   and a low number of days with snow in
   the area around the southern Baltic Sea.     experienced a high number of ‘warm
                                                                                                                                                              20
   The area of Europe where the daily           daytimes’. In August, a ridge of high
   maximum temperature stayed above             pressure brought warm air up from Africa,
                                                                                                                                                              10
   freezing in winter was the largest on        driving surface temperatures up and
   record, in keeping with a general increase   resulting in remarkably warm nighttime
                                                                                            Number of 'ice days' – Winter 2020 relative to 1981–2010          0
   since the early 1980s, and the number        temperatures in western Europe. In
   of days with ‘very strong’ and ‘strong’      France, several maximum temperature
                                                                                                                                                              -10
   cold stress during daytime was the           records for the month of August were
   lowest on record.                            broken; high temperatures were observed                                                                       -20
                                                in other parts of Europe as well. None
                                                of the heatwaves were as intense,                                                                             -30
                            1981–2010           widespread or long-lived as others
                                                of recent years. In early November,                                                                           -40     The number of days
                                                Scandinavia experienced a warm spell,                                                                                 during which the
                                                breaking daily maximum temperature                                                                            -50     daily maximum
                                                records.                                                                                                              temperature was
                                                                                                                                                              -60     below freezing
                                                                                                                                                                      during winter 2020
                                                                          1981–2010                                                                        No. days
                                                                                                                                                                      (top) and for winter
                                                                                                                                                                      2020 relative to the
                                                                                                                                                                      1981–2010 reference
                                                                                                                                                                      period (bottom).
                                                                                                                                                                      Data source: E-OBS.
                                                                                                                                                                      Credit: C3S/KNMI.

   Copernicus Climate Change Service            European State of the Climate 2020                                                                                                      7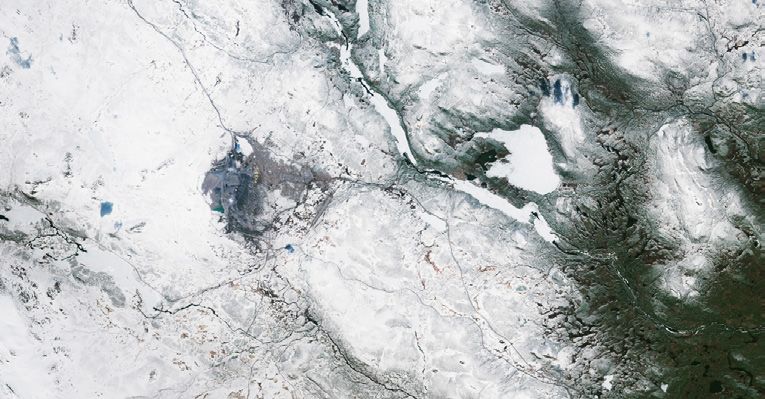
GLOBAL CONTEXT        EUROPE        THE ARCTIC            TRENDS IN               ABOUT             BEYOND
INTRODUCTION                                                                                                                              ABOUT US         CONTACT
                         IN 2020           IN 2020        IN 2020          CLIMATE INDICATORS        THE REPORT         THE ESOTC

   Precipitation                                Soil moisture                                 River discharge                              Wildfires
               Precipitation across Europe                arts of western Europe
                                                          P                                              iver discharge in April and
                                                                                                        R                                             T otal European wildfire
                was near average in 2020.                 saw a long period of drier-                   May was the lowest since at                    emissions were low
                                                          than-average conditions.                      least 1991.                                    compared to the
                                                                                                                                                       2003–2019 average.
   While precipitation levels were average      The year as a whole saw below-average         In parts of northwestern Europe, there
   for the year as a whole, there was a wide    soil moisture conditions of a similar         was a remarkable transition from             Wildfires in Europe occur throughout the
   range of anomalies between regions and       magnitude to 2019, and these were the         exceptionally high river discharge from      year, although peak activity is normally
   between different times of year. For         second lowest since at least 1979. Most       January to March, to exceptionally low       during the summer months in the
   example, February saw higher levels          of Europe was dominated by soil moisture      river discharge in April and May. Across     Mediterranean region. For Europe as a
   of precipitation than average, while         deficits, especially in France and near the   Europe, average river discharge in April     whole, 2020 showed close-to-average
   November saw lower than average              Black and Caspian Seas.                       and May was the lowest in records which      fire danger conditions, however, there
   precipitation.                                                                             date back to 1991.                           were periods of locally above-average fire
                                                In winter and spring, northeastern Europe                                                  danger in winter and spring, most notably
   A wetter-than-average winter transitioned    experienced above-average soil moisture       River discharge in October was above         in the Balkans and eastern Europe,
   into a dry spring in northwest Europe, and   conditions. Below-average soil moisture       average across large parts of Europe in      associated with regional events outside
   then across western continental Europe,      conditions occurred during spring in a        response to the heavy rainfall from Storm    the main fire season. One indicator of
   where persistent dry conditions were         band from the UK and Ireland to the           Alex. Correspondingly, over 60% of the       wildfire activity is total wildfire emissions.
   present from spring through to autumn. In    Caspian Sea. In summer and autumn,            river network in northwestern Europe         2020 European emissions were lower
   summer, wet conditions were experienced      western central Europe continued to see       experienced above-average discharge.         than average, possibly due to very few
   in a band from the Adriatic Sea to the       below-average soil moisture conditions,                                                    wildfires during the summer, which are
   Baltic countries.                            whereas eastern central Europe had                                                         typically those with the highest emissions.
                                                                                                          1991–2019
                                                above-average soil moisture conditions.
   On the whole, there is no significant
   long-term trend in European precipitation.
                                                             1981–2010

                       1981–2010                                                                                                                  ildfire danger 1981–2010
                                                                                                                                                 W
                                                                                                                                                 Wildfire emissions 2003–2019

   Copernicus Climate Change Service            European State of the Climate 2020                                                                                                     8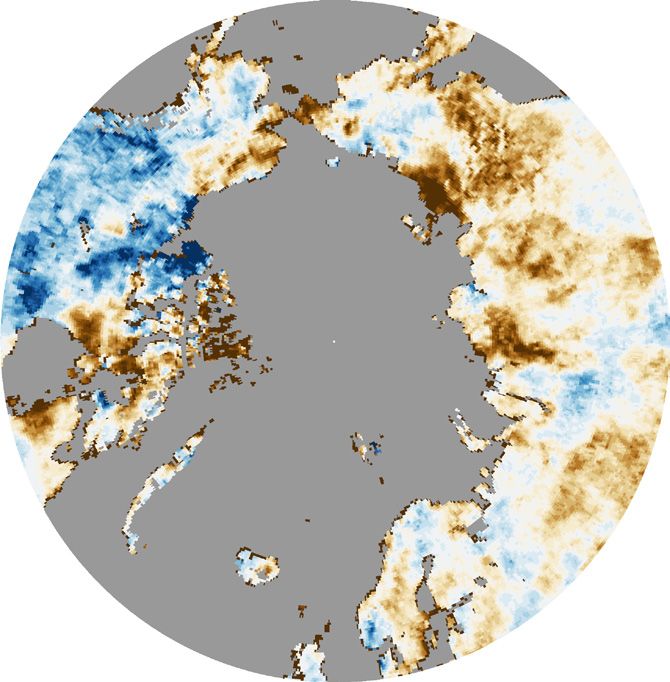
GLOBAL CONTEXT             EUROPE        THE ARCTIC            TRENDS IN                    ABOUT              BEYOND
INTRODUCTION                                                                                                                                           ABOUT US              CONTACT
                        IN 2020                IN 2020        IN 2020          CLIMATE INDICATORS             THE REPORT          THE ESOTC

                                                                                                   February

   Transition from a wet                            Storm Alex
                                                                                                                                                              In early spring, there was a
   winter to a dry spring                                      torm Alex brought
                                                              S
                                                                                                                                                              remarkable transition from
                                                              exceptional levels of rain in
               There was a remarkable                        a short period of time.                                                                           wet to dry conditions, as
                transition from a wet winter                                                                                                                    captured in precipitation
                into a dry spring.                  Storm Alex, in early October 2020, was the
                                                    first storm of the 2020–21 European winter                                                                 levels, river discharge and
   In February 2020, a large area of                storm season. The storm brought unusually                                                                       vegetation cover.
   Europe was affected by above-average             high levels of rainfall in a short period of
   precipitation from several heavy rainfall        time and broke many one-day precipitation
   events. However, northern parts of               records in the UK, northwestern France and
   western Europe experienced one of the            in the southern Alps.
   driest springs of the last 40 years, in                                                         -15     -10    -5       0     5      10     15 %
   terms of both rainfall and soil moisture.        The precipitation was particularly high
                                                    across the French and Italian sides of the     March                                                 April
   This wet to dry transition had an                Maritime Alps, with daily rainfall in some
   appreciable impact on vegetation growth          places more than three times the October
   and soil moisture across the continent.          average. Storm Alex led to above-average
   On a regional scale, the impacts were            river discharge over large parts of western
   seen in river discharge in northwestern          Europe resulting in devastating floods in
   and northeastern Europe, notably for             some regions.
   the Rhine river basin.

                                                                        1981–2010

          981–2010
         1
         River discharge 1991–2019
                                                                                                   -15     -10    -5       0     5      10     15 %     -15      -10    -5      0      5      10     15 %
                                                                                                   Monthly soil moisture anomalies for February, March and April 2020 relative to the respective monthly
                                                                                                   average for the 1981–2010 reference period. Data source: ERA5. Credit: C3S/ECMWF.

   Copernicus Climate Change Service               European State of the Climate 2020                                                                                                                      9
GLOBAL CONTEXT EUROPE THE ARCTIC TRENDS IN ABOUT BEYOND
INTRODUCTION ABOUT US CONTACT
IN 2020 IN 2020 IN 2020 CLIMATE INDICATORS THE REPORT THE ESOTC
Image: Sea ice patches south of Pioneer Island
(Russia), on 14 August 2020. Credit: European
Union, Copernicus Sentinel-2 imagery, processed
by Pierre Markuse for C3S.
The Arctic
in 2020
—
Temperatures in the Arctic were
remarkably warm, particularly
over northern Siberia, which
also saw low snow cover, dry
conditions and high wildfire
activity.
The Arctic section provides an overview
of key climate events in high northern
latitudes during 2020, both at the
surface and higher up in the atmosphere.
The start of the year brought
colder-than-average temperatures
to much of the Arctic. In addition,
March saw a record ozone
depletion event in the stratosphere.
Click here to
find out more
Copernicus Climate Change Service European State of the Climate 2020 10GLOBAL CONTEXT EUROPE THE ARCTIC TRENDS IN ABOUT BEYOND
INTRODUCTION ABOUT US CONTACT
IN 2020 IN 2020 IN 2020 CLIMATE INDICATORS THE REPORT THE ESOTC
Temperature Heat in Siberia 180°
For the Arctic as a whole, It was by far the warmest
2020 was the second year on record in Arctic
warmest year on record. Siberia. 135°W 135°E
2020 was the second warmest year The average 2020 temperature over the
on record for the Arctic, with a surface whole of Arctic Siberia was 4.3°C above
temperature anomaly of 2.2°C above the 1981–2010 average; 1.8°C above the
the 1981–2010 average. previous record.
The first three months of 2020 were Record temperatures in spring and
colder than average over large parts of autumn led to lower-than-average snow
the Arctic. At the same time, most of cover. This in turn likely contributed to the
Europe and Siberia were experiencing heat, as less solar energy was reflected
90°W 90°E
much warmer-than-average temperatures. and instead was absorbed by the darker
Later in the year, the Arctic saw its snow-free surfaces.
warmest summer and autumn on record.
During the summer, Arctic Siberia saw
The year was marked by exceptional widespread wildfire activity, which resulted
warmth over large parts of Arctic Siberia, in the largest amounts of CO2 emissions
where annual temperature anomalies from wildfires since at least 2003.
reached more than 6°C above average,
the largest anomalies worldwide.
1981–2010
45°W 45°E
1981–2010
0°
Soil moisture anomaly (%)
-30 -24 -18 -12 -6 0 6 12 18 24 30
Wildfire radiative power (W m )-2
1–10 10–50 50–100 >100
Summer 2020 soil moisture anomalies relative to the 1981–2010 average (brown/blue) and wildfire
locations (red dots). The shades of the dots denote the total wildfire radiative power, a measure of intensity.
Data source: ERA5, CAMS GFAS v1.2. Credit: C3S/CAMS/ECMWF.
Copernicus Climate Change Service European State of the Climate 2020 11GLOBAL CONTEXT EUROPE THE ARCTIC TRENDS IN ABOUT BEYOND
INTRODUCTION ABOUT US CONTACT
IN 2020 IN 2020 IN 2020 CLIMATE INDICATORS THE REPORT THE ESOTC
Image: The Nioghalvfjerdsfjorden
Ice Shelf, also known as 79N, is the
floating front end of the Northeast
Sea ice Cold winter and record
Greenland Ice Stream. Credit:
contains modified Copernicus data
rctic sea ice extent in
A ozone depletion
(2020), processed by ESA.
September was the second
lowest on record. strong polar vortex led to
A
record stratospheric ozone
In September 2020, Arctic sea ice depletion in March.
reached its second lowest minimum
extent since 1979, behind the record The first three months of the year
minimum of 2012, with a monthly brought colder-than-average
mean extent 35% below the temperatures to most of the Arctic.
1981–2010 average. One notable exception was Arctic Siberia
which, along with the rest of Siberia
Arctic sea ice extent was the lowest on and most of Europe, experienced much
record for the time of year in July and warmer conditions than normal.
October, primarily due to record low sea
ice cover along the coast of Siberia. Both the colder Arctic and warmer
Eurasia in early 2020 can be linked to an
The unusually low cover along the exceptionally strong Arctic Oscillation and
Siberian coast resulted in part from rapid its influence on wind and temperature
sea ice retreat in early summer linked to patterns. In the stratosphere, a
record high air temperatures over Arctic persistently strong polar vortex led to
Siberia. record ozone depletion in March in the
Northern Hemisphere.
1981–2010
1981–2010
Copernicus Climate Change Service European State of the Climate 2020 12GLOBAL CONTEXT EUROPE THE ARCTIC TRENDS IN ABOUT BEYOND
INTRODUCTION ABOUT US CONTACT
IN 2020 IN 2020 IN 2020 CLIMATE INDICATORS THE REPORT THE ESOTC
Trends in climate
Between 1993
and 2020, a Sea level
mean increase
Between 1993 and 2020, the global
indicators
Globally, of around mean rise in sea level has been around
3.1 mm 3.1 mm ± 0.4 mm per year; a total
increase of around 8 cm. Regional trends
can deviate considerably from the global
In Europe, of around
—
mean. For example, across Europe, sea
2–4 mm level changes differ between the open
ocean and coastal areas due to various
Climate Indicators show the long-term evolution of geophysical processes.
Per year
several key variables which are used to assess the global
Sea level data record covering
and regional trends of a changing climate. These also
January 1993 to June 2020
provide the wider context in which to read the report.
Since 1850–1900, Global 60-month average temperature (°C) Relative to the 1850-1900 reference period
an increase Surface temperature ERA5 GISTEMPv4 NOAAGlobalTempv5
1.5
Globally, of around JRA-55 HadCRUT5 Berkeley Earth
For surface temperature, the aim of the Paris
1.2°C Agreement, adopted in 2015, is to hold the increase
in the global average temperature to well below
1.0
2°C above pre-industrial levels, and to pursue
Europe, of around efforts to limit the increase to 1.5°C. The latest
2.2°C five-year average global temperature is the highest 0.5
on record, and shows a warming of around 1.2°C
above 1850–1900 levels. Since the mid-1970s,
Arctic, estimate temperatures over land have, on average, been 0
of around rising about twice as quickly as those over the sea.
3°C Six
temperature datasets covering all or
Click here parts of 1850–2020. Values for Europe -0.5
1860 1900 1940 1980 2020
to find For five-year and the Arctic are over land only.
out more averages Estimated difference in global surface air temperature relative to the 1850–1900 reference
period, according to six datasets. Credit: C3S/ECMWF.
Copernicus Climate Change Service European State of the Climate 2020 13GLOBAL CONTEXT EUROPE THE ARCTIC TRENDS IN ABOUT BEYOND
INTRODUCTION ABOUT US CONTACT
IN 2020 IN 2020 IN 2020 CLIMATE INDICATORS THE REPORT THE ESOTC
Increase at
Greenhouse gases Greenhouse gas Greenhouse gas fluxes Earth’s surface
driving climate change concentrations The difference between the amount CO2 net fluxes,
of about
of a gas added to the atmosphere by
Greenhouse gases (GHGs) in the The amount of a gas contained in a
atmosphere trap heat close to Earth’s certain volume of air.
emissions from various ‘sources’ and
the amount taken up by various
5000 TgC
surface. Although they are essential ‘sinks’, which remove that gas from
for a habitable climate, their heat- The atmospheric concentrations of CO2
the atmosphere. CH4 net fluxes,
trapping capacity means that if their and CH4 continue to increase.
of about
levels rise, Earth’s temperature also Estimated net surface fluxes of CO2,
rises, with significant global impacts.
Increase since 2010
CH4 and N2O have been increasing during 420 TgC
CO2 of about recent decades. Anthropogenic emissions
Human activities lead to the emission of
GHGs in various ways, including the 0.6% of CO2 have been partly compensated
for by a natural uptake by oceans and
N2O net fluxes,
of about
combustion of fossil fuels for energy, vegetation. In some countries, the
deforestation, the use of fertilisers in
agriculture, livestock farming, and the
CH4 of about variation in these fluxes is mainly driven 18 TgN
by fossil fuel burning, while for others the
decomposition of organic material in 0.4% dominant process is the natural uptake by Per year
landfills. Of all the long-lived GHGs that vegetation through photosynthesis.
are emitted by human activities, the ones Per year in atmospheric
that have the largest impact on the concentrations O2: 1979–2019
C
Earth’s climate are carbon dioxide (CO2), CH4: 1990–2019
methane (CH4) and nitrous oxide (N2O). N2O: 1996–2018
Concentrations (column-averaged
mixing ratios) for CO2 and CH4
covering 2003–2020
Copernicus Climate Change Service European State of the Climate 2020 14GLOBAL CONTEXT EUROPE THE ARCTIC TRENDS IN ABOUT BEYOND
INTRODUCTION ABOUT US CONTACT
IN 2020 IN 2020 IN 2020 CLIMATE INDICATORS THE REPORT THE ESOTC
The cryosphere in a
changing climate
The cryosphere encompasses all
the parts of the Earth system where Glaciers
water is in solid form, including
ice sheets, glaciers, snow cover,
Glaciers
permafrost and sea ice. Ice sheet
The cryosphere exerts an important Sea ice Ice shelf
Icebergs
influence on Earth’s climate. Due to its
high reflectivity it impacts the amount Lake/river ice
of solar energy taken up by the planet’s Snow cover
surface, and consequently temperatures.
Due to the vast amounts of water stored
Permafrost
on land in glaciers and ice sheets, there is
a direct impact on global mean sea level.
As the climate changes, the cryosphere
changes with it, and these changes
themselves have an influence back
on the climate.
across the Arctic. In March, at the annual In the Arctic during
Sea ice maximum, long-term retreat is greatest in 1979–2020
the Barents Sea. In the Antarctic, sea ice
Arctic sea ice extent has declined March sea ice September sea ice
extent shows no clear long-term trend,
markedly in all months of the year, as extent, per decade extent, per decade
although more marked changes are seen
recorded by satellite observations since in parts of the Southern Ocean. -2.6% -12.2%
1979. The decline has been largest
around the annual minimum in Sea ice data record covering
±0.4% ±1.8%
September, with widespread retreat 1979–2020
In the Antarctic
No clear trend in total sea ice extent
Copernicus Climate Change Service European State of the Climate 2020 15GLOBAL CONTEXT EUROPE THE ARCTIC TRENDS IN ABOUT BEYOND
INTRODUCTION ABOUT US CONTACT
IN 2020 IN 2020 IN 2020 CLIMATE INDICATORS THE REPORT THE ESOTC
Image: The Pine Island Glacier,
Glaciers Ice sheets captured by the Copernicus
Sentinel-2 mission. Credit: contains
modified Copernicus Sentinel data
Both globally and in Europe, glaciers are Between 1992 and 2018, the Greenland
(2020), processed by ESA.
seeing a substantial and prolonged loss and Antarctic Ice Sheets lost over
of ice mass. 6520 Gt of ice, causing global sea levels
to rise by more than 18 millimetres. In
Globally, an average of about 30 m loss of Greenland, just over half of this ice loss
ice thickness has been observed since 1957. has been through reduced surface mass
Since 1997, glaciers in Europe have lost balance and the remainder from ice
between 8 m and 30 m of ice. However, discharge. In Antarctica, increased ice
over most of the 20th century, the rate losses have been driven by increased
of mass loss was lower, and there have glacier discharge.
been intermittent periods of mass gain. Between 1992
Since 1957 and 2018
Global loss of ice In Greenland
thickness of around
-3800
30 m ±340 Gt
Since 1960s Between 1992
European loss of ice and 2017
thickness In Antarctica
4–35 m -2720
Southwestern
Scandinavia and the
±1390 Gt
Alps, respectively
Satellite data from 11 missions
1992–2018
eference glacier network
R
of more than 30 years of
ongoing observations
Copernicus Climate Change Service European State of the Climate 2020 16GLOBAL CONTEXT EUROPE THE ARCTIC TRENDS IN ABOUT BEYOND
INTRODUCTION ABOUT US CONTACT
IN 2020 IN 2020 IN 2020 CLIMATE INDICATORS THE REPORT THE ESOTC
About the
The data behind the ESOTC The ESOTC 2020 sections rely more
2020 and the Climate Indicators extensively on the datasets provided
Climate Indicators provide the long-term operationally and in near real-time by the
Copernicus Services, to give an overview
report
context for the globe, Europe and the
Arctic, and build on datasets and of 2020 in the long-term context. The
estimates which are brought together to operational data are freely accessible via
provide a comprehensive multi-source data catalogues such as the C3S Climate
reference, based on data from Copernicus Data Store (CDS). These operational data
— and from other monitoring activities.
Where data do not yet fully cover the
services build on extensive research and
development undertaken by institutions
across Europe and the rest of the world.
Contributors European national and regional reporting period, the most up to date
meteorological and hydrological information is included.
The ESOTC’s findings are based on
expertise from across the C3S community, services: ARPA Piemonte (Italy), DMI
as well as other Copernicus services (Denmark), DWD (Germany), KNMI
and external partners. The sections are (Netherlands), Met Norway, Météo-France,
authored by the data providers from Met Office (United Kingdom), and indirect
institutions across Europe and edited by contributions from many others. By comparing 2020 against a reference period, we can see how the
the C3S team. This report is reviewed Universities and research year fits within a longer-term context. Generally, the reference period
by colleagues across the Copernicus organisations: AWI (Germany), used is 1981–2010, but where less extensive data records are
network. University of Bremen (Germany), CEA/ available, more recent and shorter periods are used.
The EU Copernicus services: LSCE (France), CLS (France), EODC
(Austria), JAXA (Japan), University of Satellites Reanalysis
C3S, CAMS, Copernicus EMS, CMEMS,
Leeds (United Kingdom), University of Providing information about Using a combination of
CLMS.
Leicester (United Kingdom), NASA (USA), Earth’s surface and its observations and computer
International organisations and NILU (Norway), NIES (Japan), SRON atmosphere from space. models to recreate historical
initiatives: ECMWF, EC JRC, EEA, ESA, (Netherlands), University of Reading climate conditions.
EUMETSAT SAF Network, GCOS and (United Kingdom), University of Zurich
WMO RA VI RCC Network. (Switzerland), TNO (Netherlands), TU Wien
(Austria), VanderSat (Netherlands), VITO In situ Model-based estimates
(Belgium), VU Amsterdam (Netherlands), Measurements from an Using the laws of physics and
WGMS (Switzerland). instrument located at the statistics to build large-scale
point of interest, such as a models of environmental
land station, at sea or in indicators.
an aeroplane.
Copernicus Climate Change Service European State of the Climate 2020 17GLOBAL CONTEXT EUROPE THE ARCTIC TRENDS IN ABOUT BEYOND
INTRODUCTION ABOUT US CONTACT
IN 2020 IN 2020 IN 2020 CLIMATE INDICATORS THE REPORT THE ESOTC
BEYOND THE ESOTC:
Data for assessing Could 2020’s exceptionally
warm winter have had an
Could the wet to dry transition
in 2020 have had an impact on
climate impacts impact on the energy sector? the agriculture industry?
—
Beyond the ESOTC, C3S offers a range of products and tools to
explore the impacts of climate change and variability.
The ESOTC provides monitoring of the C3S investigates how these sectors
past year, based on data available from respond to the interplay of different Impacts of temperature Potential impacts of unusually
the Copernicus Services and other climate variables by looking at, for variations on the net energy wet or dry conditions on
agencies. C3S extends this offer by example, extreme values, frequency of demands of buildings agriculture
providing a sectorally-focused service certain events, or cumulative climate
that delivers data, tools and example conditions over long periods. The data,
The net energy demands of buildings Throughout a crop’s lifetime, availability
workflows to support public and private tools and example workflows are
is dependent on the surrounding air of water is vital. Water availability
stakeholders in their climate-sensitive provided for the past and the present, as
temperatures. Information on the for crops can be estimated from data
decisions and solutions. This service helps well as for the future; the last based on
cumulative number of days that are on evaporation and transpiration.
identify the impacts of climate change climate projections.
above or below temperature thresholds Such information, together with crop
and variability on vulnerable sectors such
for specific regions allows users to productivity data, has been produced
as infrastructure, agriculture, food
estimate this demand. This information, by C3S and will soon become part of
security, water, energy, tourism and
as well as related variables, such as the global agriculture service.
health.
energy production, is part of the offer of
the C3S energy service.
Copernicus Climate Change Service European State of the Climate 2020 18GLOBAL CONTEXT EUROPE THE ARCTIC TRENDS IN ABOUT BEYOND
INTRODUCTION ABOUT US CONTACT
IN 2020 IN 2020 IN 2020 CLIMATE INDICATORS THE REPORT THE ESOTC
About us
Image: Copernicus Sentinel-3
mission shows us a rare, cloud-free
view of Iceland. Credit: contains
modified Copernicus Sentinel data
(2020), processed by ESA.
—
The Copernicus Climate Change
ECMWF Copernicus Service (C3S)
services The Copernicus Climate Change
Service adds value to environmental
Vital environmental information measurements and provides free access
for a changing world to quality-assured, traceable data and
applications, all day, every day. C3S offers
The European Centre for Medium-Range consistent information on the climate
Weather Forecasts (ECMWF) has been anywhere in the world, and supports
entrusted by the European Commission to policymakers, businesses and citizens
implement two of the six services of the to deal with the consequences of
Copernicus programme: the Copernicus climate change and help them prepare
Climate Change Service (C3S) and the for the future.
Copernicus Atmosphere Monitoring
Service (CAMS). In addition, ECMWF The Copernicus Atmosphere
provides support to the Copernicus Monitoring Service (CAMS)
Emergency Management Service
(Copernicus EMS). The Copernicus Atmosphere Monitoring
Service adds value to air quality and
To meet the challenge of global climate atmospheric composition measurements,
change, accurate, reliable and timely and provides free access to quality-
data are key. The Copernicus Services assured, traceable data and applications.
at ECMWF routinely monitor data on
a global scale, including surface air https://doi.org/10.24381/43nj-sb24
temperature, precipitation, sea ice area 20210421
and atmospheric greenhouse gases.
Copernicus Climate Change Service European State of the Climate 2020 19Find out more
Web Copernicus User Services
climate.copernicus.eu copernicus-support@ecmwf.int
atmosphere.copernicus.eu
copernicus.eu Copernicus communication
copernicus-communication@ecmwf.int
ecmwf.int
Media enquiries
Twitter
copernicus-press@ecmwf.int
@CopernicusECMWF
@CopernicusEU European Centre for Medium-Range Weather Forecasts
@ECMWF Shinfield Park
Reading
LinkedIn
RG2 9AX
company/copernicus-ecmwf United Kingdom
Facebook
@ECMWFcopernicus
Instagram
@copernicusecmwf
#ESOTC
IMPLEMENTED BYYou can also read