Why Are Gas Prices So High? - Oxford Institute for Energy ...
←
→
Page content transcription
If your browser does not render page correctly, please read the page content below
September 2021

                 Why Are Gas Prices So High?

OXFORD ENERGY COMMENT     Mike Fulwood, Senior Research Fellow, OIES and
                                    Jack Sharples, Research Fellow, OIES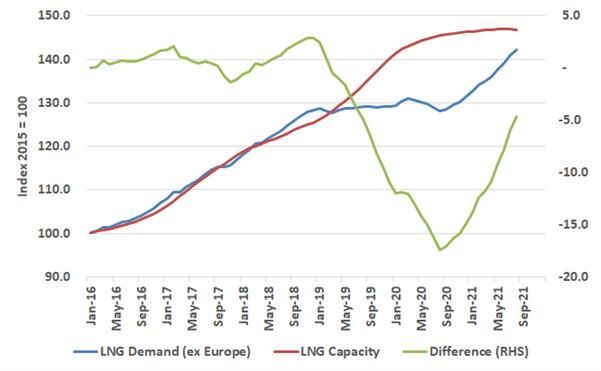
In October 2019, the OIES published a Comment entitled ‘$2 gas in Europe’, 1 which turned into a series
of papers with similar titles. 2, 3 The first paper suggested that 2020 could see gas prices in Europe
below $3 per MMBtu. Prices did actually dip below $3 on a month ahead basis for March 2020 – a price
that was set in February – before COVID-19 spread into Europe. As we now know, the TTF price fell
even further in 2020 to below $2 before some recovery towards the end of the year. In October 2020,
we published the final paper in the series entitled ‘$2 gas in Europe – Groundhog Day’, 4 which
postulated that 2021 could see a renewed weakness in gas prices with additional LNG supply coming
online and a weak recovery in global gas demand. But a very cold northern hemisphere winter combined
with a perfect storm of lower-than-expected supply additions, higher-than-expected demand growth
(including rapidly rising gas demand in China), and a limited storage buffer in Europe have converged
leading to record high prices.
In this Comment, we unpack the drivers of this perfect storm and discuss the outlook for the winter of
2021-2022. We analyse how global markets have gone from oversupply to severe undersupply by
focusing on what is happening this year, compared with the situation in 2019. By doing so, we hope to
avoid the baseline complications from the impact of COVID-19 on demand in 2020. 2019 was also a
year of oversupply as prices fell significantly during 2019 and we can review the swings between the
two years to understand how the global market moved from oversupply to severe undersupply.
Figure 1: TTF Front-Month gas prices since September 2017 (USD per MMBtu)
26.00
24.00
20 Sep 2021, 25.37
22.00
20.00
18.00
16.00
14.00
25 Sep 2018, 10.05
12.00
31 Mar 2021, 6.55
10.00
8.00 01 Nov 2019, 5.34
6.00 29 May 2020, 1.22
4.00
21 Sep 2020, 3.94
2.00
-
20 Nov 2017
20 Mar 2018
20 Jan 2021
20 May 2018
20 Sep 2018
20 Nov 2018
20 May 2019
20 Nov 2019
20 May 2020
20 Nov 2020
20 May 2021
20 Sep 2017
20 Jan 2018
20 Jan 2019
20 Mar 2019
20 Sep 2019
20 Jan 2020
20 Mar 2020
20 Jul 2020
20 Sep 2020
20 Mar 2021
20 Sep 2021
20 Jul 2018
20 Jul 2019
20 Jul 2021
Source: Data from Argus Media
1
Fulwood, M., 2019. Could we see $2 gas in Europe in 2020? Oxford Energy Comment, 22 October.
https://www.oxfordenergy.org/wpcms/wp-content/uploads/2019/10/Could-we-see-2-gas-in-Europe-in-2020.pdf
2
Fulwood, M., 2020. $2 gas in Europe is here: who will blink first? Oxford Energy Comment, 12 March.
https://www.oxfordenergy.org/publications/2-gas-in-europe-is-here-who-will-blink-first/
3
Fulwood, M. & Sharples, J., 2020. $2 Gas in Europe (Part III): Down, Down, Deeper and Down. Oxford Energy Comment, 16
June. https://www.oxfordenergy.org/publications/2-gas-in-europe-part-iii-down-down-deeper-and-down/
4
Fulwood, M. & Sharples, J., 2020. $2 Gas in Europe: Groundhog Day? Oxford Energy Comment, 16 October.
https://www.oxfordenergy.org/publications/2-gas-in-europe-groundhog-day/
The contents of this paper are the authors’ sole responsibility. They do not necessarily represent the views
of the Oxford Institute for Energy Studies or any of its Members.
2The global LNG market
Before turning to the LNG market, the first point to make is that Europe is effectively the swing or
balancing market for global gas. The amount of LNG that comes to Europe is effectively determined by
what is left over after everyone else has taken what they need and less about what Europe needs. All
the other countries and regions in the LNG market are largely demand-driven. They often have few
alternatives to LNG in the form of domestic production or pipeline imports, and limited gas storage
facilities – all of this is in sharp contrast to Europe. China is the only major country with production, pipe
imports and diverse LNG imports, but it lacks a liquid trading market and demand which responds to
price. China also has limited gas storage capacity.
One driver of the current tightness in the market is a strong increase in demand. Comparing the first 8
months of 2019 and 2021, excluding Europe, LNG imports were 28 bcm higher in 2021 – a rise of 12
per cent. Extrapolating to the end of 2021, the rise in LNG imports, outside Europe, is likely to reach 35
to 40 bcm above that reached for 2019 – a 10 percent rise.
Figure 2: Change in LNG imports by region
Total Non-Europe 27,964
Source: Data from Kpler, graph by the author
The key trends between 2019 and 2021 have been:
• Chinese LNG imports in the first 8 months of 2021 have been some 17 bcm (over 30 per cent)
higher than in 2019. This has been driven by a combination of strong gas demand in a cold winter,
restocking, an economic recovery which is driving industrial use, and surging demand in the power
sector, alongside an ongoing coal to gas switch in other sectors. The strong increases in domestic
production and rising pipeline imports, mainly from the Power of Siberia pipeline (ramping up from
0.3 bcm in 2019 to 4.1 bcm in 2020 and to 4.6 bcm in H1-2021) have not kept up with demand.
• Imports into Japan, South Korea, and Taiwan are also up almost 9 bcm over the comparison period
– a 7 percent rise – much of it in the last few months, again reflecting the cold winter but also the
desire on the part of importers to keep the regas tanks topped up in preparation for the coming
winter – something which they appear to have failed to do last winter.
• The third largest rise in LNG demand has been in Central and South America – with a 6 bcm (56
per cent) increase over the comparison period – largely as a result of demand in Brazil (low
The contents of this paper are the authors’ sole responsibility. They do not necessarily represent the views
of the Oxford Institute for Energy Studies or any of its Members. 3hydroelectricity production) and Argentina (low domestic gas production), but also more Caribbean
and Central America demand.
• The more price sensitive markets of India, Pakistan and Bangladesh have also seen small
increases, while the Middle East has been flat. In the ASEAN countries LNG imports were lower
and there was a sharp decline in imports into Mexico.
LNG imports into Europe and Turkey combined, however, have fallen by 9 bcm over the first 8 months
of 2021 compared to 2019, and for the full year this fall could be as much as 15 bcm, even if more LNG
comes to Europe in the last 4 months of this year than in 2019.
But while demand growth has been stronger than expected, available LNG export capacity in the first
eight months of 2021 is estimated to be 16 bcm higher in 2021 than in 2019 – a 5 per cent increase.
For 2021 as a whole, the rise in available capacity could be some 20 bcm. However, there have been
major differences between countries:
• US export capacity has doubled from 55 bcm to 97 bcm over the 2 years as trains in Sabine Pass,
Freeport, Corpus Christi, Cameron and Elba Island came on and ramped up to full capacity.
• Egyptian capacity has also doubled with Damietta coming back online and Idku increasing flows,
but outside small increases in Malaysia and Russia’s Yamal, capacity constraints have impacted
almost all other supply sources. For instance, a fire at the main Norwegian plant at Hammerfest
(September 2020) has taken some 6 bcm of annual capacity offline and feedgas issues in Trinidad
and Nigeria appear to have reduced capacity by around 12 bcm on an annual basis. Peru, Angola,
Equatorial Guinea, Indonesia, Papua New Guinea and some West Australian plants are also
suffering from temporary capacity issues, although these have been offset by increases in the
Queensland plants.
But for the capacity issues mentioned above, 2021 available capacity would have grown by 40 bcm
over 2019 – which would have matched the rise in LNG demand outside Europe. Instead, the increase
in available annual capacity has been limited to 20 bcm. The effect of this net loss of supply has been
to tighten the market considerably, leading to a likely 15 bcm decline in Europe LNG imports for 2021
as a whole over 2019. This is illustrated in the figure below, which charts, on a moving average basis,
the trend in LNG export capacity and the trend in LNG demand (excluding Europe).
LNG export capacity and LNG demand largely rose together from 2016 onwards as US Gulf Coast
plants started up. In 2018, demand began to outstrip supply, until the surge of supply in 2019 (mostly
from the US), and a flattening of non-Europe LNG imports, while declines in demand in Japan, Korea
and Taiwan offset growth elsewhere. This continued in 2020 as a result of the impact of COVID-19. In
2021, the global markets began their recovery from the impact of the pandemic and LNG demand rose
sharply, the growth in LNG export capacity stalled, and the market, therefore, tightened considerably.
In the whole-year 2019, Europe and Turkey accommodated the excess on the LNG market by absorbing
an additional 51 bcm of LNG imports (compared to 2018), but as demand in the rest of the world picked
up in the last quarter of 2020, European LNG imports fell. LNG imports into Europe in January-August
2021 (60 bcm) were lower than in the same period in both 2019 (68 bcm) and 2020 (73 bcm). As Europe
balanced the global LNG market in 2019 and 2020 by absorbing excess volumes, so it also balanced
the global LNG market in 2021 by reducing imports as the global market tightened.
The contents of this paper are the authors’ sole responsibility. They do not necessarily represent the views
of the Oxford Institute for Energy Studies or any of its Members. 4Figure 3: LNG demand relative to supply (12-month moving average)
Source: Kpler, Nexant WGM, OIES Analysis
The European gas market
For Europe,5 LNG is effectively the ‘marginal molecule’, to be called upon when European production
and pipeline imports have reached their maximum capacity. The extent to which Europe ‘needs’ LNG
is therefore determined by the gap between demand and these other forms of supply. In the year-to-
August, however, European gas production has been down while pipeline supplies from Russia and
Norway have also fallen. The increase in flows from Azerbaijan and North Africa have failed to offset
the declines, leading to a strong call on LNG.
European gas production (in the EU+UK) in January-August 2021 totalled 39.9 bcm, down from 52.4
bcm in the same period in 2019 (-12.5 bcm). Part of this decline is temporary, with UK gas production
particularly affected by planned maintenance that had been delayed from the summer of 2020. At a
smaller scale, the completion of offshore maintenance that has affected Danish production since
September 2019 has been pushed back from mid-2022 to 2023, also due to the impact of the COVID-
19 pandemic. Gas production in the Netherlands also continued its decline (down 2.8 bcm between
January-August 2019 and the same period in 2021). Most of that decline has been at the Groningen
field, where production of 3.9 bcm in the gas year 2021/22 will be followed by the complete cessation
of production. Therefore, not only was European production in 2021 down in comparison to 2019, but
in 2022 any rebound in the UK will be offset by a further decline in the Netherlands.
5
The analysis here covers the EU plus the UK, and therefore excludes Turkey
The contents of this paper are the authors’ sole responsibility. They do not necessarily represent the views
of the Oxford Institute for Energy Studies or any of its Members. 5Figure 4: Supply to the European market (excluding Turkey) from various sources: Change
between January-August 2019 and January-August 2021 (bcm)
Source: Data from Gas Infrastructure Europe (storage), ENTSOG Transparency Platform (pipeline imports and
production) and Kpler (LNG imports). Demand is implied by combination of production, pipeline/LNG imports, and
net storage withdrawals.
European pipeline supplies come from Norway, Russia, North Africa (Algeria & Libya), and Azerbaijan.
Imports from Azerbaijan in January-August 2021 were 4.5 bcm higher than in the same period in 2019,
due to the launch of the Trans-Adriatic Pipeline (TAP) on 31 December 2020. Imports from North Africa
to Spain and Italy rose from 17.3 bcm (2019) to 26.1 bcm (2021) – an increase of 8.8 bcm. Taken
together, pipeline imports from Azerbaijan and North Africa rose by 13.3 bcm. The potential impact on
these North African flows of the expiry of the transit contract for the delivery of gas from Algeria to Spain
via Morocco (on 1 October 2021) has been assessed by our colleague, Mostefa Ouki, in a recent OIES
Comment.6
By contrast, imports from Norway in January-August 2021 were 3.1 bcm lower than in the same period
in 2019. One-third of this decline was in Norwegian flows to the UK, which may have been impacted by
the UK North Sea maintenance work, particularly in June 2021. However, two-thirds of that decline
occurred in Norwegian flows to continental Europe (Germany, Netherlands, Belgium, and France).
Pipeline imports from Russia
The largest decline in European pipeline imports was from Russian flows. Russian pipeline flows to
Europe in January-August 2019 totalled 118.3 bcm. In the same period in 2021, they totalled 99.0 bcm
– a drop of 19.3 bcm. There are four delivery routes for Russian flows to Europe:
• The Nord Stream pipeline from Russia to Germany under the Baltic Sea;
6
Ouki, M., 2021. Gazoduc Maghreb Europe (GME): another gas transit headache for Europe? OIES Comment, September.
https://www.oxfordenergy.org/publications/gazoduc-maghreb-europe-gme-another-gas-transit-headache-for-europe/
The contents of this paper are the authors’ sole responsibility. They do not necessarily represent the views
of the Oxford Institute for Energy Studies or any of its Members. 6• the Yamal-Europe pipeline from Russia to Germany via Belarus (where it is owned by Gazprom)
and Poland (where Gazprom books capacity at auctions run by the Polish TSO, Gaz-System);
• transit via Ukraine; and
• deliveries to South-Eastern Europe via Turkish Stream and Turkey, to the Turkey-Bulgaria border.
In January-August 2019 and the same period in 2021, the Nord Stream pipeline operated at full
capacity, except for planned maintenance in July. In fact, flows on this route even increased marginally
(+0.26 bcm) between 2019 and 2021. The Turkish Stream pipeline, which was launched in January
2020, supplies the Turkish market, and delivers gas onward to the Turkey-Bulgaria border. From there,
Russian gas is supplied to Bulgaria, Greece, North Macedonia, and Serbia – markets that were
previously served via Ukraine. Russian gas deliveries to the four countries of South-Eastern Europe
(excluding Turkey), as measured on the Turkey-Bulgaria border, were 7.7 bcm in January-August 2021,
up from zero in 2019.7
On the Yamal-Europe route, flows fell marginally (-0.1 bcm) between January-August 2019 and
January-August 2021. The flow patterns were similar between 2019 and 2021, with maintenance in the
first half of April followed by a further dip in flows in the first half of July and again in the whole month
of August. However, in 2019, this summer double-dip was downward flexing by Gazprom faced with a
market that was becoming increasingly oversupplied. In 2021, flows in early August were already weak
before a fire at a gas condensate processing plant in North-Western Siberia impacted Gazprom’s
exports on this route. Flows on this route returned to full capacity on 14 September – two weeks later
than in 2019.
The majority of the decline in Russian flows to Europe in 2021 compared to 2019 occurred via Ukraine.
In January-August 2019, Russian transit to Europe (excluding Turkey) via Ukraine amounted to 53.2
bcm, and in the same period in 2021 it was 26.1 bcm – a drop of 27.1 bcm. Even when we consider
that the new flows via Turkish Stream to South-Eastern Europe were re-directed from the Ukrainian
route (7.7 bcm, as noted above), this still leaves a net decline of 19.4 bcm.
Therefore, with Russian gas deliveries to North-Western Europe via Nord Stream up 0.26 bcm and via
Yamal-Europe down 0.1 bcm, and deliveries to Central and South-Eastern Europe (excluding Turkey)
via Ukraine and Turkish Stream combined down by 19.4 bcm, this leaves a net decline of 19.3 bcm in
Russian gas deliveries to Europe (EU+UK), and the entirety of that decline was in volumes delivered
via Ukraine.
In 2019, gas transit via Ukraine was still governed by the 2009-2019 Russia-Ukraine transit contract
that had been signed in January 2009. It effectively provided Gazprom with the ability to ship as much
as it wanted via Ukraine. In December 2019, the two sides signed a new transit contract, under which
Gazprom pre-booked 178 mmcm/d (65 bcm annualised) of capacity in 2020 and 109.6 mmcm/d (40
bcm annualised) of capacity in 2021-2024. If Gazprom want any additional capacity beyond these daily
limits, it has to book it at capacity auctions. In the first eight months of 2021, Gazprom did so: It booked
a one-off 41.2 mmcm/d for January 2021, and then around 15 mmcm/d of additional capacity each
month from February to August. The actual physical flows from Russia into Ukraine fluctuated
significantly at the start of the year, but from mid-March to the end of August, they were stable at around
124 mmcm/d (equivalent of just over 45 bcma).
The question that has been asked repeatedly is why Gazprom did not book more capacity via Ukraine,
in order to flow substantial additional volumes to Europe. One reason is that gas flows on the Russia-
Ukraine border are governed by an interconnection agreement between the two transmission system
7
At the time of writing. data for Russian gas deliveries to the Turkish market is only available for the period January-June. That
data suggests that Turkish pipeline imports in H1-2021 were 8.1 bcm higher than in H1-2019, including a 6.4bcm increase in
pipeline imports from Russia. However, this was needed to meet the increase in overall Turkish demand (Data from Argus
Direct).
The contents of this paper are the authors’ sole responsibility. They do not necessarily represent the views
of the Oxford Institute for Energy Studies or any of its Members. 7operators (TSOs) that commits the two parties to provide 125 mmcm/d of firm capacity.8 Given that
Gazprom has already pre-booked 109.6 mmcm/d of transit via Ukraine, this is why the Ukrainian TSO
has been offering the difference (15 mmcm/d) on regular capacity auctions. However, if Gazprom (as
a shipper) genuinely wished to flow more gas to Europe via Ukraine, it would (in its role as Russian
TSO) likely have pressed the Ukrainian TSO, GTSOU, for an upward revision of that interconnection
agreement – something to which GTSOU (looking for additional transit revenues and affirmation of its
status as a valuable transit country) would likely have agreed.
It has been suggested that Gazprom has intentionally ‘held back’ volumes from the European market
in order to maintain the high prices that are proving so lucrative for its long-term contract portfolio in
Europe (Gazprom Export states that 87 per cent of its export sales are hub-linked, either to day-
ahead/month-ahead or to forward prices for quarter/season/year),9 and, in order to make a point to
Europe regarding Nord Stream 2, as the German regulator (BNetzA) prepares to make a decision on
the terms of its operation.
However, it is also possible that Gazprom simply did not have the spare volumes to send to Europe
and add to the spot market, over and above its long-term contract commitments.10 Priding itself on being
a ‘reliable supplier’, Gazprom would certainly not like to admit publicly that even while producing gas at
full capacity, it is struggling to balance domestic Russian demand, the need to replenish its Russian
storage stocks, the need to replenish its own downstream storage stocks in Europe, its European long-
term contract counterparty demand, and still find additional volumes for the European spot market.
Overall European supply
Alongside the decline in European production (-12.5 bcm) and pipeline imports (-9.1 bcm), as already
noted, Europe’s LNG imports also declined by 7.8 bcm in January-August 2021, compared to the same
period in 2019. This was primarily due to LNG cargoes being pulled away from Europe to the premium
Asian market, as the global LNG market tightened substantially. Taken together, this amounted to an
overall decline of 29.4 bcm in supply to the European market. However, calculated European gas
demand in January-August 2021 (316.8 bcm) was actually 1.0 bcm higher than in the same period in
2019. Therefore, the ‘gap’ between 2019 and 2021 that needed to be filled was 30.4 bcm.
This gap was met by the swing in storage injections and withdrawals. In January-August 2019, net
storage injections amounted to 23.1 bcm. In other words, the injections between April and August
amounted to 23.1 bcm more than the net withdrawals between January and March. The actual net
injections in April-August 2019 amounted to 53 bcm, and a further 7 bcm was injected in September-
October, taking total summer injections to 60 bcm. By contrast, in 2021, the net withdrawal in January-
August amounted to 7.4 bcm: 47.2 bcm of net withdrawals in January-April were followed by 39.8 bcm
of injections in May-August. Therefore, the swing in storage from a net injection of 23.1 bcm in 2019 to
a net withdrawal of 7.4 bcm in 2021 amounts to 30.5 bcm – pretty much the same as the decline in
production and imports, while demand remained relatively constant.
8
As mentioned earlier, an exception was made for January 2021, allowing Gazprom to book extra firm capacity
9
Gazprom, 2021. Investor Day Presentation. https://www.gazprom.com/f/posts/23/378358/invest-day-2021-presentation.pdf
(page 34)
10
Yermakov, V., 2021. Big Bounce: Russian gas amid market tightness. Oxford Energy Comment, September.
https://www.oxfordenergy.org/wpcms/wp-content/uploads/2021/09/Russian-gas-amid-market-tightness.pdf (page 17)
The contents of this paper are the authors’ sole responsibility. They do not necessarily represent the views
of the Oxford Institute for Energy Studies or any of its Members. 8Figure 3: Change in supply to the EU+UK market: January-August 2021 vs January-August
2019 (bcm)
Source: ENTSOG Transparency Platform and Eurostat (production & pipeline imports); Kpler (LNG imports); Gas
Infrastructure Europe (storage). Demand is implied based on combination of production, imports, and net storage
withdrawals
Therefore, if European LNG imports in 2019 was Europe ‘picking up leftovers no-one else wants’, then
in 2021 those LNG imports were attempts to feed rising demand, including the need to refill storage
from a low level. As such, the price of those LNG cargoes – as the ‘marginal molecule’ – had a definite
impact on European hub prices. As European hub prices rose in an attempt to attract those LNG
cargoes, spot buyers elsewhere in the world were obliged to pay an ever-greater premium in order to
secure their cargoes. As discussed earlier, for LNG importing markets without domestic production,
alternative pipeline supplies, and/or substantial storage, it became a case of ‘who wants it more’.
By extrapolating from the first eight months of 2021, it is possible to make an estimate of production
and pipeline imports, which provides an illustration of the gap that ought to be filled by LNG. With
production down by 24 per cent in January-August 2021 compared to 2019, a continuation of that
decline in the final quarter – with the exception of a rebound in UK production – would leave whole-year
2021 production around 15 bcm lower than whole-year production in 2019. Applying the same logic to
pipeline imports, a whole-year decline of 4 per cent in 2021 versus 2019 would produce an absolute
decline of 13 bcm. If demand in 2021 remained constant with demand in 2019, this would mean that
LNG imports would need to be 28 bcm higher in 2021 than in 2019. However, with LNG imports in
January-August 2021 already 8 bcm (11 per cent) lower than in the same period in 2019, a decline of
12 bcm looks more likely. When added to the decline in production and pipeline imports, this decline in
LNG imports would result in total supply to Europe in the whole-year 2021 being 40 bcm lower than in
2019, against a similar level of gas demand. Given that net storage withdrawals in January-August are
already 31 bcm higher than in the same period in 2019, meeting the whole-year demand at the level of
2019 would require an extra 9 bcm of net storage withdrawals in Q4-2021, either through lower
injections in September & October, or higher withdrawals in November-December.
The contents of this paper are the authors’ sole responsibility. They do not necessarily represent the views
of the Oxford Institute for Energy Studies or any of its Members. 9One of the responses to the surge in gas prices, and shortage of gas, in Europe has apparently come
from the Spanish. It has been reported11 EU leaders will discuss proposals from Spain that the EU
negotiates gas purchases on behalf of all European countries: “We have done it quite successfully for
vaccines” and “we could use our increased bargaining power to constitute strategic reserves that allow
us to mitigate our exposure to market fluctuations”. This seems to beg a number of questions:
• Which suppliers would sell gas at anything other than the market price?
• Does the EU stop existing buyers of gas in the EU buying gas while they buy it instead?
• What experience does the EU have in negotiating gas purchases?
• What time period would they negotiate them for?
• How would the purchased gas be shared between the EU member countries?
• Where would the strategic reserves be stored (Europe has plenty of gas storage infrastructure and
it was largely full in October 2020 so would the EU build any more, which would take time anyway)?
• Who decides if and when the strategic reserves are utilised and for which countries?
This proposal is clearly an ill-judged response to the current price environment – certainly, no-one was
interested in ‘regional gas purchases’ 12 months ago, when prices were at historic lows.
Conclusions
We began this Comment with the reminder that Europe is, in effect the balancing market for global
LNG. As we have demonstrated, the global LNG market tightened substantially in 2021 due to the rise
in demand outstripping the rise in supply. Asian demand has been driven by the need for space heating
in the cold Q1, continued rapid growth in China, and the desire to keep LNG storage tanks topped up
throughout the summer thereafter. In South America, low hydroelectricity output and a slump in
domestic gas production have generated strong LNG demand. On the supply side, the anticipated 5
per cent increase in available LNG export capacity was offset by outages and feedgas issues at
numerous plants. As a result, the global LNG market tightened considerably and less was left available
for import into Europe.
This contraction of available LNG volumes combined with other supply restriction in Europe, as
European production declined along with total pipeline imports, resulting in a decline of total supply to
the European market. However, given that European gas demand remained robust at 2019 levels –
primarily due to increased gas demand for space heating in the first four months of the year and gas
demand for power generation in the summer – the gap had to be met by a swing in storage. Not only
were storage stocks substantially depleted in Q1 2021, but stock replenishment in Q2 and Q3 was
slower than in recent years, leaving Europe with lower-than-average stocks as we move toward the
start of winter. This collection of fundamental factors caused a rise in both global LNG and European
prices throughout 2021, with European prices reaching record highs in late September.
Extrapolating to a whole-year comparison, the tightening of the market between 2019 and 2021 was a
consequence of a fall of 20 bcm in available LNG supply relative to non-European LNG demand, a fall
of 15 bcm in European production and a decline of maybe 13 bcm in pipeline imports.12 This adds up
to a 50 bcm “supply loss”, which led to the need to effectively withdraw so much from European storage.
50 bcm is just under 10 percent of European gas demand – no wonder prices have risen so much!
11
The Times, Thursday September 23rd 2021
12
This does not include increased Russia pipeline imports into Turkey which broadly matched the rise in Turkish demand
The contents of this paper are the authors’ sole responsibility. They do not necessarily represent the views
of the Oxford Institute for Energy Studies or any of its Members. 10Looking forward to the coming winter, at a global scale the demand side will be strongly influenced by
seasonal weather factors, especially in Q1-2022. On the supply side, there is hope that at least some
of the LNG supply that has been ‘temporarily lost’ to outages will start to come back on stream, with the
possibility of additional volumes from new US LNG trains coming on – Sabine Pass Train 6 and
Calcasieu Pass, with Corpus Christi Train 3 finishing its commissioning. If one were to seek comfort, it
could be posited that the coming Q1-2022 is hardly likely to be colder than Q1-2021 and that LNG
supply is unlikely to be lower than in Q1-2021. So, a pessimistic view may be that LNG supply and
demand (outside Europe) could be flat at worst, and with supply slightly higher and demand slightly
lower at best. To this may be added the possibility that Asian LNG buyers will have larger stocks in their
LNG tanks, which will further ease the market.
To that cautious optimism, we may refer again to the potential for supply disruptions from Algeria to
Spain in relation to transit via Morocco – If Sonatrach were obliged to deliver additional LNG cargoes
to its Spanish or Portuguese customers to make up for any shortfall, this would have a knock-on effect
on the availability of Algerian LNG cargoes elsewhere in Europe. 13
A slightly less supply constrained global LNG market (at least in Q1-2022 compared to Q1-2021) could
open up additional supplies for Europe, which may help offset the lower storage stocks and ongoing
decline in production. However, if European storage is still drawn down substantially from levels that
are already lower than usual at the start of winter, any additional LNG cargoes available in Q2 are likely
to be absorbed by efforts to replenish those storage stocks, providing support for prices into the Spring.
A key factor to watch in the coming winter will be pipeline imports into Europe, in particular supplies
from Russia and North Africa. However, like the global LNG market, Europe will remain vulnerable to
demand surges linked to weather factors, whether that is a cold spell that prompts gas demand for
space heating, or any declines in other forms of power generation that prompt a higher call on gas-fired
power plants.
To conclude, the price rally in 2021 was driven by a collection of fundamental supply and demand
factors at the level of the global LNG market and the European regional gas market. The role of
European storage in balancing not only the European market but also – as we saw in Q1 2021 – the
global LNG market cannot be understated, and the lower-than-usual stock levels remain of concern.
However, the combination of a relatively mild winter, reasonable performance by non-gas power
generation units, the return to higher levels of output of several currently underperforming LNG export
plants, and perhaps even a rebound in Russian pipeline supplies to Europe, could result in both the
global LNG market and the regional European gas market loosening and bringing prices back down
from their current extraordinary levels.
13
Ouki, M., 2021. Gazoduc Maghreb Europe (GME): another gas transit headache for Europe? OIES Comment, September.
https://www.oxfordenergy.org/publications/gazoduc-maghreb-europe-gme-another-gas-transit-headache-for-europe/
The contents of this paper are the authors’ sole responsibility. They do not necessarily represent the views
of the Oxford Institute for Energy Studies or any of its Members. 11You can also read