Evaluating Point-of-Care Nucleic Acid Tests in Adult Human Immunodeficiency Virus Diagnostic Strategies: A Côte d'Ivoire Modeling Analysis
←
→
Page content transcription
If your browser does not render page correctly, please read the page content below
Open Forum Infectious Diseases
   MAJOR ARTICLE

Evaluating Point-of-Care Nucleic Acid Tests in Adult
Human Immunodeficiency Virus Diagnostic Strategies:
A Côte d’Ivoire Modeling Analysis
Anne M. Neilan,1,2,3,4, Jennifer Cohn,5 Emma Sacks,5,6 Aditya R. Gandhi,2, Patricia Fassinou,7 Rochelle P. Walensky,2,3,4, Marc N. Kouadio,7
Kenneth A. Freedberg,2,3,4,8, and Andrea L. Ciaranello2,3,4,
1
 Division of General Academic Pediatrics, Department of Pediatrics, Massachusetts General Hospital for Children, Boston, Massachusetts, USA, 2Medical Practice Evaluation Center,
Massachusetts General Hospital, Boston, Massachusetts, USA, 3Division of Infectious Diseases, Massachusetts General Hospital, Boston, Massachusetts, USA, 4Harvard Medical School, Boston,

                                                                                                                                                                                             Downloaded from https://academic.oup.com/ofid/article/8/6/ofab225/6275256 by guest on 11 September 2021
Massachusetts, USA, 5Elizabeth Glaser Pediatric AIDS Foundation, Geneva, Switzerland, 6Johns Hopkins School of Public Health, Baltimore, Maryland, USA, 7Elizabeth Glaser Pediatric AIDS
Foundation, Abidjan, Côte d’Ivoire, and 8Division of General Internal Medicine, Massachusetts General Hospital, Boston, Massachusetts, USA

   Background. The World Health Organization (WHO) human immunodeficiency virus (HIV) diagnostic strategy requires 6
rapid diagnostic tests (RDTs). Point-of-care nucleic acid tests (POC NATs) are costlier, less sensitive, but more specific than RDTs.
   Methods. We simulated a 1-time screening process in Côte d’Ivoire (CI; undiagnosed prevalence: 1.8%), comparing WHO- and
CI-recommended RDT-based strategies (RDT-WHO, RDT-CI) and an alternative: POC NAT to resolve RDT discordancy (NAT-
Resolve). Costs included assays (RDT: $1.47; POC NAT: $27.92), antiretroviral therapy ($6–$22/month), and HIV care ($27–$38/
month). We modeled 2 sensitivity/specificity scenarios: high-performing (RDT: 99.9%/99.1%; POC NAT: 95.0%/100.0%) and low-
performing (RDT: 91.1%/82.9%; POC NAT: 93.3%/99.5%). Outcomes included true-positive (TP), false-positive (FP), true-negative
(TN), or false-negative (FN) results; life expectancy; costs; and incremental cost-effectiveness ratios (ICERs: $/year of life saved
[YLS]; threshold ≤$1720/YLS [per-capita gross domestic product]).
   Results. Model-projected impacts of misdiagnoses were 4.4 years lost (FN vs TP; range, 3.0–13.0 years) and a $5800 lifetime cost
increase (FP vs TN; range, $590–$14 680). In the high-performing scenario, misdiagnoses/10 000 000 tested were lowest for NAT-
Resolve vs RDT-based strategies (FN: 409 vs 413–429; FP: 14 vs 21–28). Strategies had similar life expectancy (228 months) and
lifetime costs ($220/person) among all tested; ICERs were $3450/YLS (RDT-CI vs RDT-WHO) and $120 910/YLS (NAT-Resolve vs
RDT-CI). In the low-performing scenario, misdiagnoses were higher (FN: 22 845–30 357; FP: 83 724–112 702) and NAT-Resolve
was cost-saving.
   Conclusions. We projected substantial clinical and economic impacts of misdiagnoses. Using POC NAT to resolve RDT discor-
dancy generated the fewest misdiagnoses and was not cost-effective in high-performing scenarios, but may be an important adjunct
to existing RDT-based strategies in low-performing scenarios.
   Keywords. cost-effectiveness; diagnostics; LMIC; modeling; point-of-care.

KEY POINTS                                                                                       With improved diagnostics and expanded human immunodefi-
We used a spreadsheet tool and the Cost-Effectiveness of                                         ciency virus (HIV) testing services over the past decade, 79% of
Preventing AIDS Complications (CEPAC)–International model                                        people with HIV (PWH) globally were aware of their status in
to simulate alternative HIV diagnostic testing strategies in Côte                                2018 [1]. The World Health Organization (WHO) recommends
d’Ivoire. Point-of-care nucleic acid tests could be an important                                 a sequence of rapid diagnostic tests (RDTs) for HIV diagnosis
adjunct to rapid diagnostic test–based strategies.                                               [2]. Before 2019, this sequence depended on a country’s HIV
                                                                                                 prevalence. In response to declines in HIV testing positivity, the
                                                                                                 WHO now recommends all countries use 3 consecutive RDTs
   Received 16 April 2021; editorial decision 27 April 2021; accepted 29 April 2021.             in order to minimize misdiagnoses [3]. This strategy requires
   Correspondence: Anne M. Neilan, MD, MPH, Medical Practice Evaluation Center,                  a total of 6 RDTs for diagnosis and confirmation testing before
Massachusetts General Hospital, 100 Cambridge St, Suite 1600, Boston, MA 02114, USA
(aneilan@mgh.harvard.edu).                                                                       antiretroviral therapy (ART) initiation.
Open Forum Infectious Diseases®2021                                                                 RDTs are used widely for HIV diagnosis due to their high
© The Author(s) 2021. Published by Oxford University Press on behalf of Infectious Diseases      sensitivity (>99%) and specificity (>99%) and low cost [4].
Society of America. This is an Open Access article distributed under the terms of the Creative
Commons Attribution-NonCommercial-NoDerivs licence (http://creativecommons.org/licenses/         However, RDT sensitivity and specificity may differ between
by-nc-nd/4.0/), which permits non-commercial reproduction and distribution of the work, in any   laboratory and field settings [5, 6]. Program audits evaluating
medium, provided the original work is not altered or transformed in any way, and that the
work is properly cited. For commercial re-use, please contact journals.permissions@oup.com
                                                                                                 RDT-based testing strategies report substantial false-negative
DOI: 10.1093/ofid/ofab225                                                                        (FN, up to 9%) and false-positive (FP, up to 10%) results [5, 6].

                                                                                                                              POC NATs for Adult HIV Diagnosis • ofid • 1
Additionally, RDT sensitivity is diminished in acute HIV infec- We previously found that despite greater testing costs, POC
tion, when anti-HIV antibodies are still developing. With mul- NAT–based testing strategies may require fewer assays than
tiple RDTs required for diagnosis and limited capacity at HIV RDT-based strategies and improve diagnostic accuracy [16].
clinics, RDT-based testing strategies are prone to attrition and However, the long-term clinical and economic outcomes and
result delays [7]. cost-effectiveness of such strategies remain undetermined. In
Emerging point-of-care nucleic acid tests (POC NATs) the present analysis, our objective was to determine the clin-
may improve the accuracy of current testing strategies when ical and economic impact of misdiagnoses and the potential
implemented in combination with RDTs. NATs detect HIV cost-effectiveness of a universal 1-time adult HIV screening
RNA or DNA rather than HIV antibodies, which could im- process (ie, a 1-time universal screen) in Côte d’Ivoire (CI), a
prove diagnosis for individuals with acute HIV infection setting with a low prevalence of undiagnosed HIV, using ex-
in whom antibodies have not yet developed. Compared isting RDT-based testing strategies and an alternative strategy
to RDTs, POC NATs have lower sensitivity (95%), except incorporating POC NAT in combination with RDTs.
during acute HIV infection, and greater specificity (100%)
Downloaded from https://academic.oup.com/ofid/article/8/6/ofab225/6275256 by guest on 11 September 2021
[4]. POC NATs have also been demonstrated to reduce time
METHODS
to diagnosis in adult populations receiving discordant RDT
results [8]. Although POC NATs may require electric supply Analytic Overview
and may have longer run times compared to RDTs, they uti- Using a previously published spreadsheet-based tool and
lize single-use cartridges, minimize cross-reactivity between the Cost-Effectiveness of Preventing AIDS Complications
samples, and are automated (reducing human intervention (CEPAC)–International model [16–18], we simulated alter-
and/or error) and digital (eliminating the user interpreta- native HIV testing strategies for a universal 1-time screening
tion that is needed with RDT) (Table 1). They require only process of all adults without a reported HIV diagnosis in CI
a few hours of training and may be run by nurses and/or (ie, excluding PWH already diagnosed), performed in addition
nonlaboratory technicians [9]. However, concerns have also to current Ivoirian HIV testing practices (ie, status quo). We
been raised about FN diagnoses if POC NATs are used for chose to model this population rather than a subset of testers
PWH on ART who present for testing without disclosing in order to evaluate alternative testing strategies on a national
a known HIV diagnosis (ie, individuals who participate in level. We projected the clinical and economic outcomes for
community screening programs without disclosing previ- true-positive (TP), FP, true-negative (TN), and FN results from
ously identified HIV status) [10]. the 1-time screen. We considered the negative impact of false
Table 1. Technical and Implementation Comparisons Between Rapid Diagnostic Tests and Point-of-Care Nucleic Acid Tests for Human Immunodeficiency
Virus Diagnosis
Characteristics Rapid Diagnostic Testa Point-of-Care Nucleic Acid Testb
Technical characteristics
Temperature constraints Ambient (2°C–30°C) [4] Ambient (2°C–40°C) [4]
Reagents Test cassette, assay diluent, specimen transfer device [4] Single-use cartridge [4]
Reagent shelf-life 18 mo [4] 9–12 mo [4]
Capacity for additional testing None Tuberculosis, HCV, early infant HIV diagnosis, HIV viral
load monitoring [11–13]
Electric supply None [4] Required; some use battery power [4, 14]
Implementation characteristics
Assay mechanism User prepares specimen and places on to colloid containing User adds specimen to cartridge and instrument
immobilized antigen (immunochromatography) [4] automates HIV RNA extraction, amplification, and
detection via RT-PCR [4]
Training required Minimal Minimal, can be task shifted to nurses and/or
nonlaboratory technicians [9, 12, 14]
Cross-reactivity Immunochromatography poses risk for cross-reactivity Negligible
Interpretation User interprets the presence or absence of a reactive sample Digital [4]
relative to control [4]
Instrument run time 10–20 min [4] 52–90 min [4]
Time to result Must be readresults received from the HIV screen: clinical for an FN result CD4 cell count and HIV RNA. In the absence of effective ART, (life expectancy lost compared to a TP diagnosis) and economic PWH experience a monthly CD4 decline and age- and CD4- for an FP result (increase in HIV-related care costs compared to dependent risks of opportunistic infection and mortality. For a TN diagnosis). We estimated misdiagnoses, CD4 cell count at those carrying an FN diagnosis or who acquire HIV after an diagnosis, primary transmissions averted, life expectancy, and initial TN result, subsequent TP diagnosis can occur via rou- costs for each strategy. We reported incremental cost-effective- tine HIV testing or upon seeking care for a severe opportunistic ness ratios (ICERs: the difference in lifetime costs divided by infection. PWH linking to care are prescribed ART and expe- the difference in life expectancy, discounted 3%/year) for each rience an initial probability of virologic suppression and subse- strategy compared to the next least costly alternative from the quent increase in CD4. Those with virologic suppression face health care payer perspective. We defined a strategy as “cost-ef- risks of later failure. PWH who become lost to follow-up expe- fective” if its ICER was
Table 2. Model Input Parameters for a Simulated 1-Time Human Immunodeficiency Virus Screen of Adults in Côte d’Ivoire
Variable Base Case Value Range Examined Source
Scenario-specific testing characteristics
High-performing scenario
RDT sensitivity, specificitya, %
Acute HIV 88.5, 99.1 66.0–88.5, 82.9–100.0 [4, 21]
Chronic HIV 99.9, 99.1 91.1–99.9, 82.9–100.0 [4]
POC NAT sensitivity, specificitya, % 95.0, 100.0 93.3–95.0, 99.5–100.0 [4]
Low-performing scenario
RDT sensitivity, specificitya, %
Acute HIV 66.0, 82.9 66.0–88.5, 82.9–100.0 [22]
Chronic HIV 91.1, 82.9 91.1–99.9, 82.9–100.0 [5, 23]
POC NAT sensitivity, specificitya, % 93.3, 99.5 93.3–95.0, 99.5–100.0 [14]
Downloaded from https://academic.oup.com/ofid/article/8/6/ofab225/6275256 by guest on 11 September 2021
Attrition after repeat RDTs, % 29 … [14]
Attrition after laboratory RDTs, % 32 … [14]
Result delay after laboratory RDT 1 mo … [14]
Cohort characteristics
Initial age, y, mean (SD)
Undiagnosed, acute HIV 30 (9) 30–40 [18]
Undiagnosed, chronic HIV 32 (9) 32–42 [24]
Without HIV at model start 36 (15) … [25]
Male sex, PWH, % 29 20–50 [26]
Undiagnosed HIV prevalence, % 1.8 0.1–5.0 [26]
Acute HIV 0.9 0–100 [1, 26]
Chronic HIV 99.1 0–100 [1, 26]
HIV incidence, infections/1000 PY 1.1 … [1]
Initial CD4 count, mean (SD), cells/µL
Acute HIV 667 (134) … [24]
Chronic HIV 550 (205) 100–550 [27]
Current Ivoirian HIV detection characteristics
Via routine testing, monthly probabilityb 0.003 0.0015–0.0060 [24]
Upon presentation with severe OIb, % 90 50–100 [24]
Linkage to care, probability 0.88 50–100 [26]
HIV treatment
ART efficacy: 48-wk virologic suppression, %
First-line: TDF + 3TC + DTG 98 … [28]
Second-line: TDF + FTC + EFV 86 … [28]
Third-line: ZDV + 3TC + LPV/r 75 … [28]
LTFU, range by adherence to ART, monthly probability 0.005–0.030 0.5–2.0× [29]
Costs (2018 USD)
Assay, per testc
RDT 1.47 0.74–2.94 [15]
POC NAT 27.92 13.96–55.84 [15]
Laboratory monitoring, per test
CD4 cell count test 11.88 5.94–23.76 [17]
HIV RNA test 37.11 18.56–74.22 [17]
ART, monthly, range by ART regimen 6–22 0.5–2.0× [30]
HIV care costs, monthly, range by CD4 cell count 27–38 0.5–2.0× [31]
Abbreviations: 3TC, lamivudine; ART, antiretroviral therapy; DTG, dolutegravir; EFV, efavirenz; FTC, emtricitabine; HIV, human immunodeficiency virus; LPV/r, lopinavir/ritonavir; LTFU, loss to
follow-up; OI, opportunistic infection; POC NAT, point-of-care nucleic acid test; PWH, people with human immunodeficiency virus; PY, person-years; RDT, rapid diagnostic test; SD, standard
deviation; TDF, tenofovir disoproxil; USD, United States dollars; ZDV, zidovudine.
a
Sensitivity and specificity estimates are averages of multiple testing platforms that had overlapping 95% confidence intervals.
b
Inputs estimated from published data regarding age and CD4 cell count at HIV acquisition and detection (Supplementary Methods). Severe OIs include World Health Organization stage 3
and 4 clinical events and tuberculosis.
c
Cost estimates are averages of multiple testing platforms.
and Joint United Nations Programme on HIV/AIDS reports [1, [24, 27]. We applied results to the population eligible for testing
26]. CD4 counts at model start were 667 cells/µL (SD, 134) and in CI (24.5 million) [1, 19], and reported in units per 10 million
550 cells/µL (SD, 205) for acute and chronic HIV, respectively people to demonstrate small differences between strategies.
4 • ofid • Neilan et alHIV Testing, Natural History, and Treatment. Additional Scenario Analyses
We derived current Ivoirian practices of HIV detection We modeled “intermediate” scenario analyses with assay param-
(0.003 monthly probability via routine testing and 90% HIV eters lying between high-performing and low-performing
detection after developing a severe opportunistic infection) by scenarios. We also varied the proportion of FP diagnoses re-
calibrating to published age (38 years) and CD4 count at de- solved by pre-ART retesting in the low-performing scenario.
tection (254 cells/µL) (Supplementary Methods) [24]. From In a “test-again” scenario, we varied the proportion of PWH in
published data, we derived CD4 decline for PWH not on ef- the high-performing scenario who presented for testing with
fective ART and AIDS-related and non-AIDS-related mortality a previous, unreported HIV diagnosis (0% [high-performing
(Supplementary Table A). We modeled HIV care based on 2019 scenario] to 39% of all PWH who receive the 1-time screen)
CI guidelines, including 3 ART lines, opportunistic infection [10]. Of PWH previously diagnosed, we assumed that 53% were
prophylaxis, and annual CD4 and HIV RNA monitoring (Table on ART, and among these, 76% were virologically suppressed
2, Supplementary Table A). (Supplementary Table A). In this test-again scenario, we mod-
eled lowered assay sensitivity with ART and/or virologic sup-
Downloaded from https://academic.oup.com/ofid/article/8/6/ofab225/6275256 by guest on 11 September 2021
HIV Transmission. pression (RDT sensitivity on/off ART: 95.2%/99.9%; POC NAT
Transmission rates (0–65.5/100 person-years) varied by HIV sensitivity on ART and virologically suppressed/not virologi-
RNA level, with the highest rates for those with acute infection cally suppressed: 0%/95.0%) (Supplementary Table A).
and not on ART (Supplementary Table A).
RESULTS
Costs.
RDT ($1.47) and POC NAT ($27.92) assay costs were derived Clinical Outcomes: High-Performing and Low-Performing Scenarios
from the United Nations Children’s Fund, including device cost, In the high-performing scenario, NAT-Resolve generated
service-level agreements, personnel time, and training [15]. the fewest misdiagnoses per 10 000 000 adults tested (409
For all PWH (including primary transmissions), HIV-related FN and 14 FP), followed by RDT-CI (413 FN and 28 FP) and
costs included laboratory monitoring, opportunistic infec- RDT-WHO (429 FN and 21 FP) (Table 3). Any of the 1-time
tion prophylaxis and treatment, ART, and HIV care (Table 2, screening strategies compared with current Ivoirian testing
Supplementary Table A). practices increased mean CD4 count at diagnosis: 500 vs
225 cells/µL. Discounted life expectancy for the tested pop-
Clinical and Economic Impact of HIV Misdiagnoses. ulation (including PWH and those without HIV) was similar,
The clinical impact of FN diagnoses was based on current within rounding, across strategies: 228.60 months (Table 3,
Ivoirian HIV testing parameters: receiving an FN vs a TP di- Supplementary Table B).
agnosis at the time of the screen led to 4.4 mean undiscounted Compared to the high-performing scenario, in the low-
life-years lost. The clinical impact of FP diagnoses was based performing scenario, FN diagnoses increased by 2 orders of
on loss to follow-up input parameters: mean time spent with magnitude for all strategies (22 845–30 357) and FP diagnoses
an FP diagnosis was 10.3 years (SD, 0.01 years); the median was increased even more (83 724–112 702) (Table 3). Among PWH,
7.2 years (interquartile range, 2.3–18.5 years). Compared to re- life expectancy was highest for NAT-Resolve (351.59 months),
ceiving a TN diagnosis, an FP diagnosis increased discounted followed by RDT-WHO (349.88 months) and RDT-CI
lifetime costs by $5800. (349.35 months). Among all tested, discounted life expectancy
was similar across strategies (228.49–228.52 months) due to low
Sensitivity Analyses HIV prevalence.
We varied RDT and POC NAT sensitivity and specificity to de- In the high-performing scenario, compared to current
termine their impact on projected misdiagnoses generated by Ivoirian testing practices, all testing strategies averted sim-
each strategy. We next varied individual parameters (Table 2, ilar numbers of transmissions (53% reduction); in the low-
range examined) in the high-performing scenario to examine performing scenario, NAT-Resolve averted the most (46%
when NAT-Resolve was preferred. Independent of testing reduction compared to 45% with RDT-WHO and 44% with
strategy or scenario, we varied Ivorian HIV detection param- RDT-CI, Supplementary Table C).
eters (affecting life-years lost from an FN vs TP diagnosis), loss
to follow-up parameters (affecting the time spent with an FP Cost and Cost-Effectiveness Outcomes: High-Performing and Low-
diagnosis), and both cost and loss to follow-up parameters (af- Performing Scenarios.
fecting the costs of an FP vs TN diagnosis). In multiway sensi- In the high-performing scenario, discounted lifetime costs
tivity analyses, we varied the clinical and economic harms of were similar across all strategies ($222.89–$223.11) (Table 3,
HIV misdiagnoses to examine their impact on cost-effective- Supplementary Table B). Compared to RDT-WHO, RDT-CI
ness outcomes. had slightly higher life expectancy and costs, leading to an ICER
POC NATs for Adult HIV Diagnosis • ofid • 5Table 3. Clinical and Cost-Effectiveness Outcomes of a Simulated 1-Time Screen in Côte d’Ivoire: High-Performing and Low-Performing Scenarios
Misdiagnosesb Life Expectancyc Per-Person Lifetime Costsc ICERd
FN FP PWH Tested Population Tested Population Tested Population Tested Population Tested Population
Months, Months, Months, USD 2018, USD 2018,
Strategya No. No. Undiscounted Undiscounted Discountede Undiscounted Discountede $/YLS
High-performing
RDT-WHO 429 21 358.16 388.29 228.60 458.16 222.89 Comparator
RDT-CI 413 28 358.16 388.29 228.60 458.19 222.90 3450
NAT-Resolve 409 14 358.16 388.29 228.60 458.40 223.11 120 910
Low-performing
NAT-Resolve 22 845 83 724 351.59 388.17 228.52 517.53 271.56 Cost-saving
RDT-WHO 28 479 104 439 349.88 388.14 228.49 527.11 278.62 Dominated
RDT-CI 30 357 112 702 349.35 388.13 228.49 532.69 283.03 Dominated
Downloaded from https://academic.oup.com/ofid/article/8/6/ofab225/6275256 by guest on 11 September 2021
Abbreviations: CI, Côte d’Ivoire; FN, false-negative; FP, false-positive; ICER, incremental cost-effectiveness ratio; NAT, nucleic acid test; PWH, people with human immunodeficiency virus;
RDT, rapid diagnostic test; USD, United States dollars; WHO, World Health Organization; YLS, year of life saved.
a
Strategies are listed in order of increasing lifetime costs, per cost-effectiveness convention.
b
Outcomes are reported for a tested population of 10 000 000.
c
Life expectancy is rounded to 2 decimals. Costs are rounded to the nearest cent.
d
ICERs (rounded to the nearest $10) are used to summarize the cost-effectiveness of an intervention: the degree to which the intervention provides benefit relative to its cost. An ICER
is the difference in cost divided by the difference in life expectancy for each strategy compared with the next least costly strategy. If a strategy is less effective and more expensive com-
pared to another strategy, then it is said to be “strongly dominated.” A strategy is “cost-effective” if it is not dominated by any other strategy and it has the largest ICER not exceeding the
willingness-to-pay threshold. The willingness-to-pay-threshold is a normative value that varies widely by setting and decision-maker; for interpretability, we have chosen the per-capita GDP
in CI ($1720/YLS).
e
Results are discounted 3%/year.
of $3450/YLS. NAT-Resolve had slightly higher life expectancy (ICER: $1680/YLS). When RDT specificity was ≤93.3%, NAT-
and costs than RDT-CI, with an ICER of $120 910/YLS. Resolve was cost-saving.
Compared to the high-performing scenario, in the low-
performing scenario, discounted lifetime costs increased due to Sensitivity Analyses: Clinical and Economic Impact of Misdiagnoses.
more FP diagnoses (ie, more people accruing HIV care costs): With base-case inputs, the life-years lost due to an FN vs TP
$271.56 (NAT-Resolve), $278.62 (RDT-WHO), and $283.03 diagnosis was 4.4 years. Projected life-years lost never dropped
(RDT-CI). NAT-Resolve led to higher life expectancy and lower below 3.0 life-years but ranged up to 13.0 life-years when
lifetime costs compared to RDT-WHO and RDT-CI, and thus varying current Ivoirian HIV detection practices (Figure 2A).
was cost-saving. The increase in lifetime costs due to an FP vs TN diagnosis
was $5800 and was most sensitive to the time spent with an
Sensitivity Analyses: Misdiagnoses. FP diagnosis. One year spent misdiagnosed with HIV cor-
Numbers of FN diagnoses were most impacted by RDT sensi- responded to an increase of HIV-related costs of $590; a life-
tivity (Figure 1A). POC NAT sensitivity was minimally influ- time spent misdiagnosed with HIV corresponded to a $14 680
ential in NAT-Resolve due to the small number of PWH who increase (Figure 2B, Supplementary Table E). The time spent
receive discordant RDTs and subsequently receive POC NAT. with an FP diagnosis was sensitive to loss to follow-up rates
Numbers of FP diagnoses were most sensitive to RDT speci- (mean range, 6.0–15.4 years; median range, 3.6–14.3 years)
ficity (Figure 1B). With the lowest average reported specificity (Supplementary Table F). Using combinations of the lowest
for POC NAT (99.5%), FP diagnoses generated in NAT-Resolve and greatest impact of FN and FP diagnoses, NAT-Resolve
increased from 14 to 452; with the lowest average reported spec- never became cost-effective in the high-performing scenario
ificity for RDT (82.9%), FP diagnoses generated increased by (Supplementary Table G).
nearly 4 orders of magnitude (14–28 to 90 000–160 000).
Additional Scenario Analyses.
Sensitivity Analyses: High-Performing Scenario. In intermediate scenario analyses, with combinations of test
In 1-way sensitivity analyses for the high-performing scenario characteristics falling between the high-performing and low-
(Supplementary Table D), the ICER of NAT-Resolve was always performing scenarios, RDT-WHO was the preferred strategy
above the CI per-capita GDP ($1720/YLS; ie, not cost-effective) when test characteristics were all 60% worse
ICER: $1230/YLS), or >35% of PWH were acutely infected than the high-performing scenario. NAT-Resolve was the
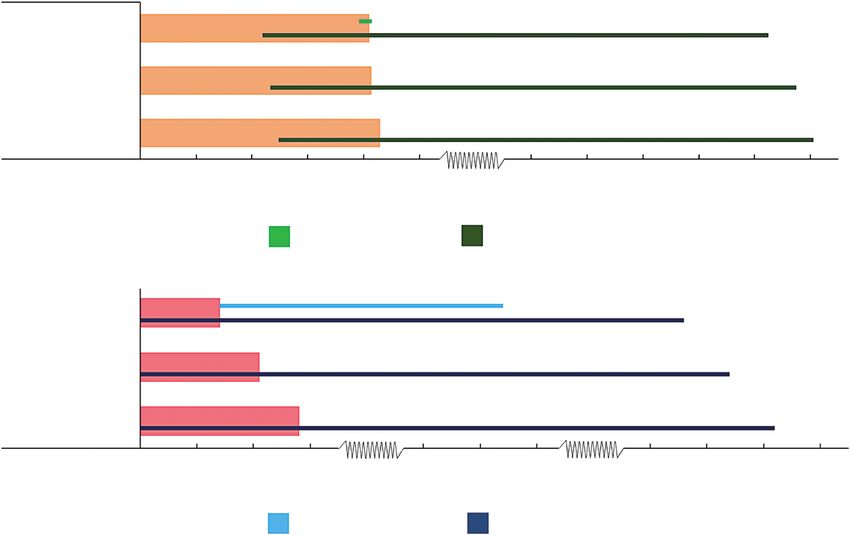
6 • ofid • Neilan et alA. Impact of RDT and POC NAT sensitivity on the number of projected false-negative diagnoses
NAT-resolve
Testing strategy
RDT-CI
RDT-WHO
0 100 200 300 400 500 10 000 12 000 14 000 16 000 18 000 20 000
False-negative diagnoses per 10 000 000 tested (No.)
POC NAT sensitivity RDT sensitivity
(100%–93.3%; 95.0%) (best-worst combination)a
Downloaded from https://academic.oup.com/ofid/article/8/6/ofab225/6275256 by guest on 11 September 2021
B. Impact of RDT and POC NAT specificity on the number of projected false-negative diagnoses
NAT-resolve
Testing strategy
RDT-WHO
RDT-CI
0 10 20 30 300 400 500 50 000 100 000 150 000 200 000
False-positive diagnoses per 10 000 000 tested (No.)
POC NAT specificity RDT specificity
(100%–99.5%; 100.0%) (100%–82.9%; 99.1%)
Figure 1. A, Impact of varying rapid diagnostic test (RDT) and point-of-care nucleic acid test (POC NAT) sensitivity on projected false-negative diagnoses generated by each
testing strategy. The thick orange bars represent projected false-negative diagnoses generated by each testing strategy in the high-performing scenario. aBest (acute 88.5%;
chronic: 100.0%) and worst (acute: 66.0%; chronic: 91.1%) combinations of RDT sensitivity. B, Impact of varying RDT and POC NAT specificity on projected false-positive
diagnoses generated by each testing strategy. The thick red bars represent projected false-positive diagnoses in the high-performing scenario. In both panels, the vertical
axis lists testing strategies in order of increasing impact of varying RDT and POC NAT sensitivity and specificity, and the horizontal axis shows the number of misdiagnoses
per 10 000 000 tested. Longer thin lines indicate the parameters to which the numbers of misdiagnoses were more sensitive. Parameters are varied through plausible ranges,
shown in parentheses, to illustrate their individual impact on the number of misdiagnoses generated. Ranges are followed by a semicolon and the high-performing scenario
input parameter. Abbreviations: CI, Côte d’Ivoire; POC NAT, point-of-care nucleic acid test; RDT, rapid diagnostic test; WHO, World Health Organization.
preferred strategy when pre-ART retesting resolved 0.1% of PWH retested, and always generated the fewest infant diagnosis), the relatively high individual POC NAT test
FP diagnoses; RDT-WHO was then the preferred strategy cost compared to RDT ($27.92 vs $1.47) should not necessarily
(Supplementary Table J). preclude its use to resolve discordant RDTs [32]. Moreover,
setting-specific RDT test characteristics are greatly needed to
DISCUSSION
better understand the need and utility of more robust testing
We simulated a 1-time HIV screening process for adults in platforms like POC NAT. Importantly, programs have reported
Côte d’Ivoire, a setting with a low undiagnosed HIV preva- that a substantial proportion (up to 39%) of PWH presenting
lence, to estimate the clinical and economic impact of HIV for HIV screening may already be on ART with suppressed HIV
misdiagnoses and evaluate the potential cost-effectiveness of RNA, which would lower the sensitivity of POC NAT [10, 33].
employing POC NAT in combination with RDTs compared This reduction in POC NAT sensitivity is dependent on the rate
POC NATs for Adult HIV Diagnosis • ofid • 7A. Life-years lost due to a false-negative versus true-positive HIV diagnosis
HIV detection upon presentation with severe OI (100–0; 90%)
HIV detection via routine testing (0.01–0.001; 0.003 monthly probability)
0 5 10 15
Life-years lost, mean
B. Increase in lifetime costs due to a false-positive versus true-negative HIV diagnosis
Downloaded from https://academic.oup.com/ofid/article/8/6/ofab225/6275256 by guest on 11 September 2021
Mean time spent FP (1 year–lifetime; 10.3 years)
HIV care costs (0.5–2.0×; range by age, CD4 cell count, and OI)
ART costs (0.5–2.0×; range by ART regimen)
0 3000 6000 9000 12 000 15 000
Lifetime costs (2018 USD)
Figure 2. A, One-way sensitivity analysis of the projected undiscounted life-years lost due to receiving a false-negative human immunodeficiency virus (HIV) diagnosis com-
pared to a true-positive HIV diagnosis. The horizontal axis shows the undiscounted life-years lost and the vertical axis lists key input parameters. The vertical black line rep-
resents the mean life-years lost projected in the base case analysis (4.4 years). B, One-way sensitivity analysis on the projected increase in discounted lifetime costs due to
receiving a false-positive HIV diagnosis compared to a true-negative HIV diagnosis. The horizontal axis shows the increase in lifetime costs and the vertical axis lists key input
parameters. The vertical black line represents the increase in lifetime costs projected in the base-case analysis ($5800). Parameters are varied through wide ranges, shown in
parentheses, to illustrate their individual impact on the life-years lost due to a false-negative diagnosis or the increase in costs due to false-positive diagnosis (shown in the
blue horizontal bars). Longer blue horizontal bars indicate parameters to which the model results were more sensitive. Ranges are followed by a semicolon and the base-case
input parameter. Abbreviations: ART, antiretroviral therapy; FP, false-positive; HIV, human immunodeficiency virus; OI, opportunistic infection; USD, United States dollars.
of retesting among already diagnosed PWH and the proportion RDTs for performance and interpretation—are anticipated to
virologically suppressed among this population (Supplementary have reproducible results in field settings [35], which could sub-
Table J). Further studies are needed to understand the charac- stantially mitigate poor RDT field performance, as observed in
teristics and motivations of retesting among already diagnosed NAT-Resolve [5, 6]. These findings highlight the importance of
PWH. Providers that use POC NAT to resolve discordant RDT expanded access to HIV diagnostic testing with reproducible
results should be aware of the risk of misdiagnosis among PWH test characteristics that can minimize misdiagnoses [36].
that do not disclose their HIV status; improved counseling and Third, this analysis underscores that early HIV testing
privacy at testing sites could mitigate this risk. markedly improves clinical outcomes. The projected life-years
Second, using POC NAT to resolve discordant RDTs gener- lost due to an FN diagnosis depended on the frequency of cur-
ally led to the fewest misdiagnoses. Small variations in the sen- rent HIV testing. To our knowledge, there are no published
sitivity and specificity of diagnostic assays translated to large estimates of life-years lost due to an FN diagnosis in similar
changes in estimated misdiagnoses when applied to large popu- settings. FP diagnoses are costly, increasing HIV-related life-
lations. In the high-performing scenario, the projected misdiag- time costs by $5800. This modeled cost depended on assump-
noses were consistent with the positive and negative predictive tions about the duration of an FP diagnosis (based on Ivoirian
values estimated by WHO testing guidelines [2, 3, 34]. RDT loss to follow-up rates) [29], and was consistent with other
sensitivity and specificity were most influential on misdiagnoses published estimates in low-income settings ($3770–$4655)
generated because RDT is the first test administered in each [34, 37]. Notably, these estimates do not capture additional in-
strategy. In the low-performing scenario, FN and FP diagnoses dividual and societal costs, such as the psychological burden
increased >50-fold and >4000-fold, respectively. Automated and the erosion of trust in health care systems resulting from
POC NAT platforms—which are less reliant on humans than misdiagnoses [38].
8 • ofid • Neilan et alThis model-based analysis had several limitations that may C.). Additional support for this research included the Eunice Kennedy
Shriver National Institute for Child Health and Human Development (grant
have over- or underestimated the benefits of NAT-Resolve.
numbers K08 HD094638 to A. M. N. and R01 HD079214 to A. L. C.); the
First, we assume that the results of sequential testing are con- National Institute of Allergy and Infectious Diseases (grant numbers R37
ditionally independent. In practice, potential cross-reactivity AI058736 to K. A. F. and R37 AI093269 to R. P. W.); and the Steve and
between assays may lead to poorer RDT performance, thereby Deborah Gorlin MGH Research Scholars Award (to R. P. W.).
Potential conflicts of interest. All authors: No reported conflicts of
increasing the value of POC NAT [6]. Second, we assume that interest.
WHO-recommended pre-ART retesting is concordant with the All authors have submitted the ICMJE Form for Disclosure of Potential
final result of the testing strategy. Although pre-ART retesting Conflicts of Interest. Conflicts that the editors consider relevant to the con-
tent of the manuscript have been disclosed.
may serve as a barrier to rapid ART initiation, it could avert
FP diagnoses in the low-performing scenario for RDT-based REFERENCES
testing strategies [39], thereby decreasing the value of NAT- 1. Joint United Nations Programme on HIV/AIDS. AIDSinfo. People living with
Resolve. Third, the duration and cost of an FP diagnosis were HIV receiving ART. 2018. Available at: http://aidsinfo.unaids.org/. Accessed 23
October 2018.
based on estimated Ivoirian loss to follow-up parameters for
Downloaded from https://academic.oup.com/ofid/article/8/6/ofab225/6275256 by guest on 11 September 2021
2. World Health Organization. Consolidated guidelines on HIV testing services:
PWH. People without HIV who receive an FP diagnosis may 5Cs: consent, confidentiality, counselling, correct results and connection 2015.
Geneva, Switzerland: WHO, 2015. Available at: https://www.ncbi.nlm.nih.gov/
engage differently in HIV care than PWH, so these results may books/NBK316021. Accessed 27 April 2020.
vary between settings. However, our findings show that plau- 3. World Health Organization. WHO encourages countries to adapt HIV testing
strategies in response to changing epidemic. 2019. Available at: https://www.
sible variation in the cost of an FP diagnosis ($590–$14 680)
who.int/publications-detail/who-encourages-countries-to-adapt-hiv-strategies.
does not affect cost-effectiveness results in the high-performing Accessed 23 January 2020.
scenario (Supplementary Table G). 4. World Health Organization. In vitro diagnostics and laboratory technology. 2020.
Available at: https://www.who.int/diagnostics_laboratory/evaluations/PQ_list/
With a simulated 1-time HIV screening process in Côte en/. Accessed 20 March 2021.
d’Ivoire, we found that using POC NAT in combination with 5. Kufa T, Lane T, Manyuchi A, et al. The accuracy of HIV rapid testing in integrated
bio-behavioral surveys of men who have sex with men across 5 Provinces in South
RDTs led to the fewest misdiagnoses for people with previ- Africa. Medicine (Baltimore) 2017; 96:e7391.
ously undiagnosed HIV. We projected substantial life-years lost 6. Shanks L, Klarkowski D, O’Brien DP. False positive HIV diagnoses in resource
limited settings: operational lessons learned for HIV programmes. PLoS One
and increases in lifetime costs due to misdiagnoses. In settings 2013; 8:e59906.
where RDTs perform poorly and testing strategies are prone to 7. Ngangue P, Bedard E, Ngueta G, et al. Failure to return for posttest counseling and
HIV test results at the prevention and voluntary testing and counseling centers of
attrition and result delays, the number and impact of misdiag-
Douala, Cameroon: an evaluation of a routine five-year program. AIDS Res Ther
noses are large. In these settings, POC NAT can be an important 2016; 2016:1–7.
adjunct to existing RDT-based testing strategies. 8. Macneal K, Tukei V, Sacks E, et al. Use of point-of-care nucleic acid tests beyond
early infant diagnosis of HIV: a retrospective case review in Lesotho. J Acquir
Immune Defic Syndr 2020; 84:S78–S83.
9. Simmonds FM, Cohn JE, Mafaune HW, et al. Task shifting for point-of-care early
Supplementary Data
infant diagnosis: a comparison of the quality of testing between nurses and labo-
Supplementary materials are available at Open Forum Infectious Diseases ratory personnel in Zimbabwe. Hum Resour Health 2020; 18:4.
online. Consisting of data provided by the authors to benefit the reader, 10. Fuente-Soro L, Lopez-Varela E, Augusto O, et al. Monitoring progress towards the
the posted materials are not copyedited and are the sole responsibility first UNAIDS target: understanding the impact of people living with HIV who
of the authors, so questions or comments should be addressed to the re-test during HIV-testing campaigns in rural Mozambique. J Int AIDS Soc 2018;
corresponding author. 21:e25095.
11. The Global Fund. HIV viral load and early infant diagnosis selection and pro-
curement information tool. 2017. Available at: https://www.theglobalfund.org/
en/sourcing-management/health-products/viral-load-early-infant-diagnosis/.
Notes
Accessed 20 March 2021.
This study was approved by the Partners Human Research Committee. 12. World Health Organization. Point-of-care tests for diagnosing HIV infection
No patient-level data were included in this modeling study; only published among children younger than 18 months. Geneva, Switzerland: WHO, 2020.
data were included, so no consent was required. Available at: https://www.who.int/publications/i/item/point-of-care-tests-for-
Author contributions. All authors contributed significantly to this work diagnosing-hiv-infection-among-children-younger-than-18-months. Accessed
and reviewed and approved this manuscript for publication. A. M. N. and 20 March 2021.
13. World Health Organization. Updated recommendations on HIV prevention, in-
A. L. C. developed the initial conceptualization, design, and analysis plan for
fant diagnosis, antiretroviral initiation and monitoring. 2021. Available at: https://
this study. A. M. N. and A. R. G. led the execution of this model-based anal-
www.who.int/publications/i/item/9789240022232. Accessed 20 March 2021.
ysis, interpretation of model results, and manuscript writing efforts. J. C., 14. Bianchi F, Cohn J, Sacks E, et al; EGPAF POC EID Study Team. Evaluation of a
E. S., P. F., and M. N. K. contributed to the initial conceptualization of this routine point-of-care intervention for early infant diagnosis of HIV: an observa-
analysis, procured data for model inputs, and contributed to manuscript tional study in eight African countries. Lancet HIV 2019; 6:e373–81.
preparation. R. P. W., K. A. F., and A. L. C. provided significant input on the 15. United Nations Children’s Fund. UNICEF supply catalogue. 2018. Available at:
analysis plan, interpretation of model results, and manuscript preparation. https://supply.unicef.org/all-materials.html. Accessed 23 October 2018.
Disclaimer. The content of this manuscript is solely the responsibility of 16. Neilan AM, Cohn JE, Lemaire JF, et al. HIV testing after a first positive rapid
the authors and does not necessarily represent the views of the Elizabeth diagnostic test: a role for nucleic acid testing? Open Forum Infect Dis 2018;
5:ofy170.
Glaser Pediatric AIDS Foundation, Unitaid, the National Institutes of
17. Ouattara EN, MacLean RL, Danel C, et al. Cost-effectiveness and budget impact
Health, the Massachusetts General Hospital (MGH) Executive Committee
of immediate antiretroviral therapy initiation for treatment of HIV infection in
on Research, the US Centers for Disease Control and Prevention, or the US Côte d’Ivoire: a model-based analysis. PLoS One 2019; 14:e0219068.
government. 18. Walensky RP, Borre ED, Bekker LG, et al. Do less harm: evaluating HIV program-
Financial support. This work was supported by the Elizabeth Glaser matic alternatives in response to cutbacks in foreign aid. Ann Intern Med 2017;
Pediatric AIDS Foundation and Unitaid (to A. M. N., A. R. G., and A. L. 167:618–29.
POC NATs for Adult HIV Diagnosis • ofid • 919. The World Bank. Incidence of HIV—Côte d’Ivoire. 2018. Available at: https:// 29. Messou E, Kouakou M, Gabillard D, et al. Medication possession ratio: predicting
data.worldbank.org/indicator/SH.HIV.INCD.TL.P3?locations=CI. Accessed 23 and decreasing loss to follow-up in antiretroviral treatment programs in Côte
October 2018. d’Ivoire. J Acquir Immune Defic Syndr 2011; 57:S34–9.
20. Hutubessy R, Chisholm D, Edejer TT. Generalized cost-effectiveness analysis for 30. Clinton Health Access Initiative. 2017 antiretroviral (ARV) CHAI reference price
national-level priority-setting in the health sector. Cost Eff Resour Alloc 2003; 1:8. list. 2017. Available at: https://clintonhealthaccess.org/2017-chai-arv-reference-
21. Smallwood M, Vijh R, Nauche B, et al. Evaluation of a rapid point of care test price-list/. Accessed 21 December 2018.
for detecting acute and established HIV infection, and examining the role of 31. Anglaret X, Chêne G, Attia A, et al. Early chemoprophylaxis with
study quality on diagnostic accuracy: a Bayesian meta-analysis. PLoS One 2016; trimethoprim-sulphamethoxazole for HIV-1-infected adults in Abidjan,
11:e0149592. Côte d’Ivoire: a randomised trial. Cotrimo-CI Study Group. Lancet 1999;
22. Parker MM, Bennett SB, Sullivan TJ, et al. Performance of the Alere Determine 353:1463–8.
HIV-1/2 Ag/Ab Combo Rapid Test with algorithm-defined acute HIV-1 infection 32. Nichols BE, Girdwood SJ, Crompton T, et al; EQUIP Health. Monitoring viral
specimens. J Clin Virol 2018; 104:89–91. load for the last mile: what will it cost? J Int AIDS Soc 2019; 22:e25337.
23. Boadu R, Darko G, Nortey P, et al. Assessing the sensitivity and specificity of First 33. Manne-Goehler J, Rohr J, Montana L, et al. ART denial: results of a home-based
Response HIV-1-2 test kit with whole blood and serum samples: a cross-sectional study to validate self-reported antiretroviral use in rural South Africa. AIDS
study. AIDS Res Ther 2016; 13:9. Behav 2019; 23:2072–8.
24. Inghels M, Niangoran S, Minga A, et al. Missed opportunities for HIV testing 34. Eaton JW, Terris-Prestholt F, Cambiano V, et al. Optimizing HIV testing services
among newly diagnosed HIV-infected adults in Abidjan, Côte d’Ivoire. PLoS One in sub-Saharan Africa: cost and performance of verification testing with HIV self-
2017; 12:e0185117. tests and tests for triage. J Int AIDS Soc 2019; 22:e25237.
Downloaded from https://academic.oup.com/ofid/article/8/6/ofab225/6275256 by guest on 11 September 2021
25. US Central Intelligence Agency. The World Factbook: Côte d’Ivoire. 2020. 35. Agutu CA, Ngetsa CJ, Price MA, et al. Systematic review of the performance and
Available at: https://www.cia.gov/library/publications/the-world-factbook/geos/ clinical utility of point of care HIV-1 RNA testing for diagnosis and care. PLoS
print_iv.html. Accessed 7 November 2019. One 2019; 14:e0218369.
26. ICAP at Columbia University. Côte d’Ivoire population-based HIV impact 36. Johnson CC, Fonner V, Sands A, et al. To err is human, to correct is public health:
assessment (2017–2018). 2018. Available at: https://phia.icap.columbia.edu/ a systematic review examining poor quality testing and misdiagnosis of HIV
wp-content/uploads/2018/08/CIPHIA_Cote-DIvoire-SS_FINAL.pdf. Accessed status. J Int AIDS Soc 2017; 20:21755.
21 January 2020. 37. Lasry A, Kalou MB, Young PR, et al. Cost implications of HIV retesting for verifi-
27. Lundgren JD, Babiker AG, Gordin F, et al; INSIGHT START Study Group. cation in Africa. PLoS One 2019; 14:e0218936.
Initiation of antiretroviral therapy in early asymptomatic HIV infection. N Engl J 38. Sacks E, Cohn J, Penazzato M. HIV misdiagnosis in paediatrics: unpacking the
Med 2015; 373:795–807. complexity. J Int AIDS Soc 2017; 20:21959.
28. Walmsley SL, Antela A, Clumeck N, et al; SINGLE Investigators. Dolutegravir 39. Eaton JW, Johnson CC, Gregson S. The cost of not retesting: human immunode-
plus abacavir-lamivudine for the treatment of HIV-1 infection. N Engl J Med ficiency virus misdiagnosis in the antiretroviral therapy “test-and-offer” era. Clin
2013; 369:1807–18. Infect Dis 2017; 65:522–5.
10 • ofid • Neilan et alYou can also read


