EVALUATING PUBLIC TRANSPORT SOCIAL EXCLUSION IN GUADALAJARA, MEXICO
←
→
Page content transcription
If your browser does not render page correctly, please read the page content below
Urban Transport XXVI         195

            EVALUATING PUBLIC TRANSPORT SOCIAL
             EXCLUSION IN GUADALAJARA, MEXICO
    CARMEN LIZÁRRAGA1*, ALEJANDRO L. GRINDLAY2† & GABRIELA OCHOA-COVARRUBIAS3‡
      1
        Applied Economics Department, Faculty of Business and Economics, University of Granada, Spain
                    2
                      Department of Urban and Regional Planning, University of Granada, Spain
         3
           Habitat and Urban Development Department, ITESO, Jesuit University of Guadalajara, Mexico

                                               ABSTRACT
The role of the public transport system as promoter of social inclusion is gaining increasing attention
in the fields of transport policy and planning. This is especially relevant in areas traditionally
characterized by high levels of poverty and structural inequalities where it can be a decisive element in
the reduction of social exclusion. This paper evaluates the topic through an innovative methodology
based on index comparison. Firstly, a traditional accessibility index is used which considers the access
time to public transport stops, and secondly an Index of Transport Social Disadvantage is proposed. It
includes the transport disadvantage factors of the populations, such as disability, old age, low income,
unemployment and pre-school children. These transport disadvantage characteristics have been divided
into two groups: the first includes the disadvantage characteristics distributed equally. In the second
group, the disadvantaged groups in transport with an unequal territorial distribution are taken into
account. The Gini index is used to ascertain the differences in these groups. This method facilitates the
identification of the unequal distribution of transport disadvantage and therefore, social exclusion. The
consideration of the two indexes, access time and transport social disadvantages, will find the areas not
only with low accessibility levels, but also with high levels of population with transport disadvantages,
thereby assessing social exclusion linked with public transport. This methodology is applied to the
public operated transport system of the Guadalajara Metropolitan Area, Mexico. Its development
reveals which areas are affected by the under provision of public transport as well as the population
characterized by transport social disadvantage, which together give a clear indicator of the situation of
social exclusion linked to the public transport system.
Keywords: social exclusion, access time disadvantage, transport social disadvantage, Guadalajara.

                                     1 INTRODUCTION
It is well recognized that the ability to travel is a basic need which allows access to other
elementary and auxiliary necessities [1]–[3]. Mobility-related social exclusion is a situation
where the transport system is inadequate or even non-existent. In these cases, people are
limited in access to economic or social activities, resulting in fewer opportunities [4]–[8].
An unsatisfactory transport system is thus an important factor in triggering social exclusion
[9]–[11].
    The role of the public transport system as promoter of social inclusion is gaining
increasing attention in the fields of transport policy and planning [12]. This is especially
relevant in a context traditionally characterized by high levels of poverty and structural
inequalities. The provision of transport is directly related to the access time to reach the
stations/stops. Moreover, some socioeconomic characteristics affect the intensity of the
disadvantage of transport, even more so if the spatial distribution is uneven. Hence, to avoid
social exclusion, a transportation system should be satisfactory for users with these kind of
socioeconomic characteristics [13].

*
  ORCID: http://orcid.org/0000-0002-3221-6178
†
  ORCID: http://orcid.org/0000-0001-5176-0550
‡
  ORCID: http://orcid.org/0000-0002-2864-6634

     WIT Transactions on The Built Environment, Vol 200, © 2020 A. L. Grindlay published by WIT Press under CCBY4.0
     www.witpress.com, ISSN 1743-3509 (on-line)
     doi:10.2495/UT200161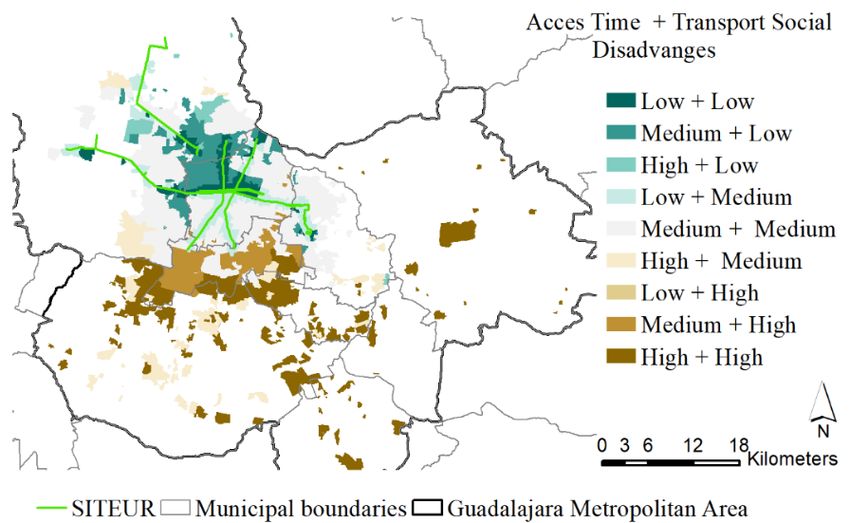
196 Urban Transport XXVI

    Most of the empirical evidence of transport exclusion in Latin America is concentrated in
South America [13]. There are few published papers or reports regarding this topic in the
Guadalajara Metropolitan Area (GMA) [14]–[17]. To fill this gap, this paper describes the
evaluation of social exclusion through an innovative methodology based on dual index
comparison, i.e. Index of Access Time Disadvantage (IATD) and Index of Transport Social
Disadvantage (ITSD).
    This paper is structured as follows. In this section we describe the problem, the lack of
empirical analysis from case study and how we fill this gap. In Section 2 we describe the
methodological approach and the study area. Next, in Section 3 we discuss the spatial patterns
of the relationship between social and transport disadvantages in the urbanized area of GMA.
Finally, we derive our conclusions from this research in Section 4.

                                    2 METHODOLOGY
Based on previous research [3], [18]–[22], this study uses index comparison to examine
social exclusion in relation to transport. Scrutiny of the IATD and the ITSD identifies not
only the areas with low accessibility levels, but also with high levels of transport social
disadvantages, and thereby allows the assessment of social exclusion linked with public
transport. The study was carried out in the Guadalajara Metropolitan Area (GMA), Mexico,
and was focused on the public operated transport system.
   As shown in Fig. 1, the GMA is an area of nine municipalities with 4.8 million inhabitants
[23]. More than half of them live only in two municipalities, that is, Guadalajara and
Zapopan, with 30% and 27% of the GMA population, respectively. The peripheral area is
mainly rural with low population density, except for the municipal capitals. The metropolitan
mobility investments have traditionally favored the automobile infrastructure over the mass
transport system [24]. The public operated mass transport system is known as SITEUR. It
includes four modes of transport, i.e. light rail transit (LRT), bus rapid transit (BRT), trolley
and bus. It mainly serves the central area of the metropolis with nearly half a million daily

                Figure 1: Urbanized area of the Guadalajara Metropolitan Area.

     WIT Transactions on The Built Environment, Vol 200, © 2020 A. L. Grindlay published by WIT Press under CCBY4.0
     www.witpress.com, ISSN 1743-3509 (on-line)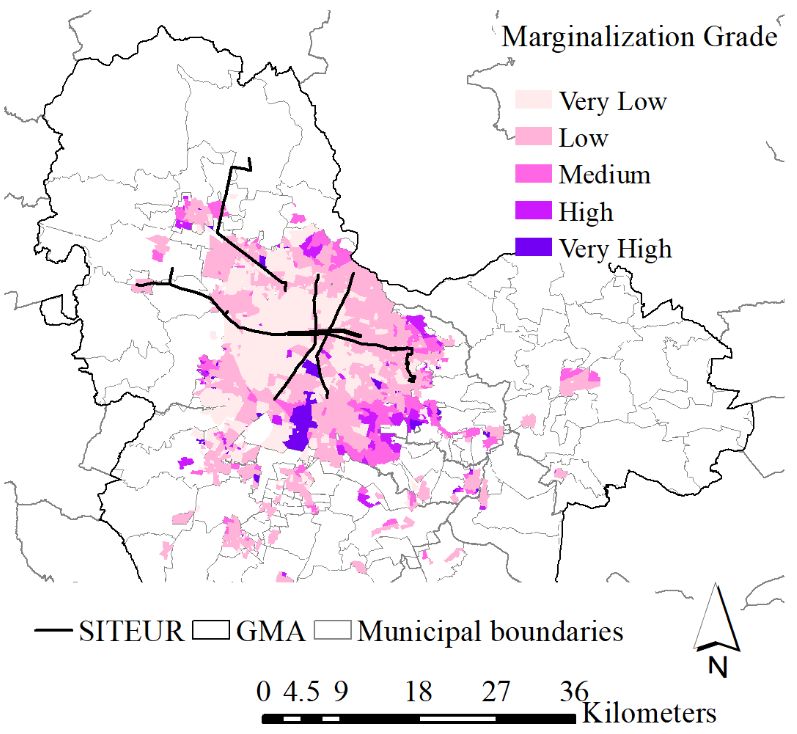
Urban Transport XXVI 197
journeys [25], while other areas are served by low quality privately-operated buses,
microbuses and other flexibly structured transit systems [16], [24]. Since transportation is a
metropolitan issue [26], this study includes the nine municipalities, despite the enormous
differences in the coverage by the SITEUR service and in their socioeconomic
characteristics.
The IATD was calculated based on distance between the stops/stations and the basic
spatial unit of analysis, i.e. the Geoelectoral Section (GS). ArcGis® was the geographic
information system used for this network analysis. Two assumptions were made. First, the
centroid of the GS was used for the service area calculations. Second, if a GS had several
transport mode options at a distance of less than 5 minutes, the mode with the highest
hierarchy was chosen, i.e. first the LRT, followed by the BRT, then the trolley and finally
the bus.
The ITSD was designed and calculated with social factors in relation with transport [13].
The characteristics of disadvantage in transport were divided into two groups with the Gini
Index. In the first group, the students, elderly and non-social security population were equally
distributed in the territory. The second group takes into consideration the transport
disadvantage factors of, disability, unemployment, non-private-owned car, pre-school
children (0–5), lack of refrigerator and illiteracy [27], which are unequally distributed in the
territory.
The ITSD was calculated with the second group of characteristics by the means of
eqn (1)
ITSD ∑ ITDij. (1)
The ITDij represents the transport handicap index in section i for the handicap condition j.
The data were ordered according to the condition of disadvantage j from lowest to highest
and divided by quintiles according to population. The ITDij could take three values. It took
the value 0, low disadvantage, when the population of district i was in the lowest 20% of
disadvantage. It took the value 2 when the population of district i was in the top 20% of
disadvantage. And took a value of 1 for the rest. Each district i took a value for each of the
six unequally distributed transport disadvantage conditions. Thus, the index ITD represents
the sum of ITDi from j=1 to 6. And it can take values from 0: low disadvantage in all
conditions; to 12 with high disadvantage in all indicators of transport disadvantage. Finally,
the IATD was overlapped with the ITSD and the temporary disadvantage in access to
transport supply. As a result, areas of social and public transport exclusion were identified.
3 ITSD ∑ ITDIJ. RESULTS AND DISCUSSION
The indexes assessment was mapped and spatial patterns were identified. In accordance with
previous studies [3], [16], [28], results highlight higher access time and transport social
disadvantages in the non-central areas of the GMA, especially the southeast.
Fig. 2 maps the sum of social factors used to calculate the ITSD. Average values cover
almost the entire city, except for three areas: the northwest of the city center of Guadalajara,
where some of the residential areas with the highest real estate value are located, has lower
transport social disadvantages; the eastern area dissected with the metropolis core; and
finally, a red small red area within the yellow which is an irregular settlement known as
“Cerro del Cuatro” with high socioeconomic disadvantages.
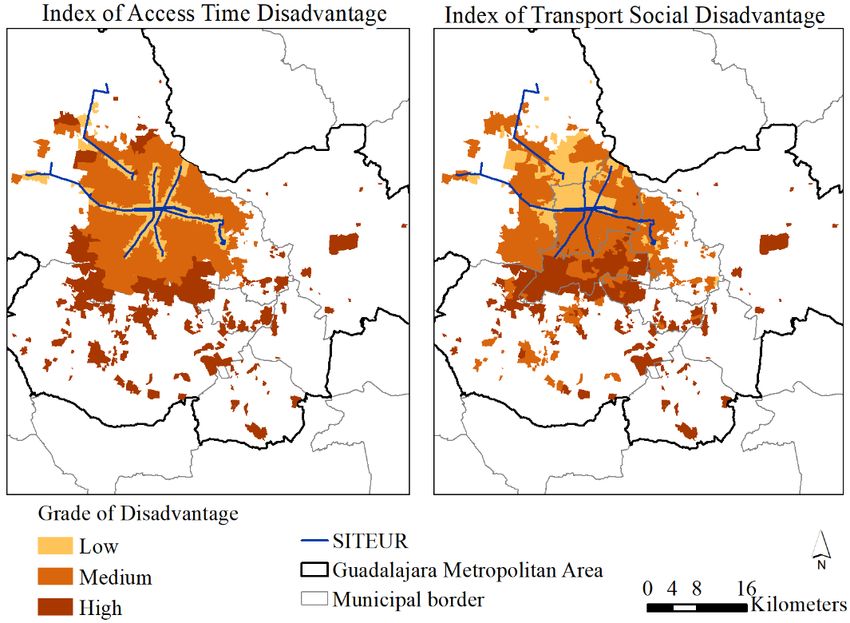
Fig. 3 shows the normalization and both indexes. On the one hand, it can be seen that
around SITEUR the IATD is low and it is distributed over 14% of the developed area, with
an average degree of disadvantage occupying 51% of the area and the high IATD occupying
WIT Transactions on The Built Environment, Vol 200, © 2020 A. L. Grindlay published by WIT Press under CCBY4.0
www.witpress.com, ISSN 1743-3509 (on-line)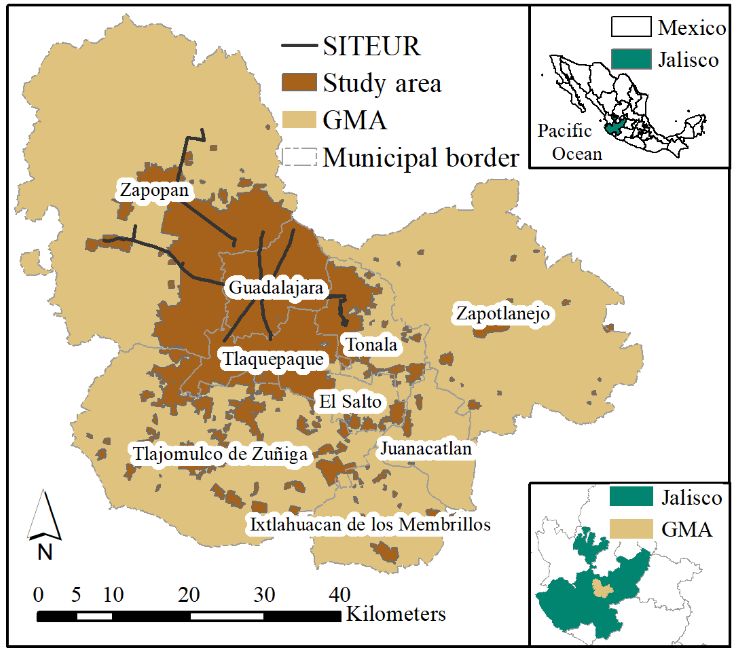
198 Urban Transport XXVI

        Figure 2: Number of social factor disadvantages in relation with transport.

     Figure 3: Indexes of access time disadvantage and transport social disadvantage.

    WIT Transactions on The Built Environment, Vol 200, © 2020 A. L. Grindlay published by WIT Press under CCBY4.0
    www.witpress.com, ISSN 1743-3509 (on-line)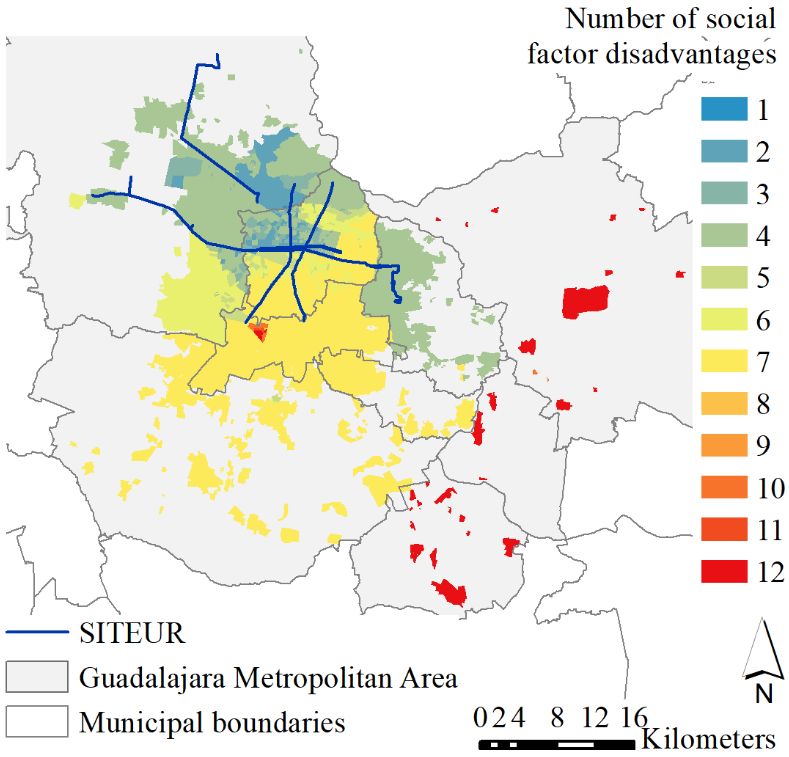
Urban Transport XXVI         199

                                    Table 1: Surface per index grade.

                Grade of             Time                     Transport
              disadvantage       disadvantage Surface (%)   disadvantage   Surface (%)
                 (80/20)         surface (m2)                surface (m2)
                    0            106,876,144     14%       599,807,878.56     18%
                    1            391,091,989     51%      1,190,489,183.75    35%
                    2            268,680,443     35%      1,592,670,988.82    47%
                  Total          766,648,577              3,382,968,051.13

a dispersed area of 35% of the territory. On the other hand, the lowest value of the ITSD
occupies 18% of the surface and is located in the northwest, those of medium disadvantage
occupy 35% of the territory and are in the center, while the high social disadvantage of
transport occupies 47% of the surface and is dispersed in the southeast (Table 1). The system
does not reach these areas as it is no feasible to serve such dispersed urbanized areas [29].
   As shown in Fig. 4, almost all the urban areas of the municipalities of El Salto, Ixtlahuacán
de los Membrillos, Juanacatlán, Tajomulco de Zúñica and Zapotlanejo were evaluated as
highly disadvantaged in both indexes. This coincides with the perception that, although these
municipalities formally belong to the metropolitan area, there are still structural differences
that exclude them from the transportation benefits offered in the other four municipalities
[30]. Even if SITEUR does not serve the southern areas of the GMA, the proximity of the
LRT and the BRT helps to reduce social exclusion in this area. According to Ríos [24], results
highlight the need to build an orderly network and integrate mass transport in the GMA.
Fig. 4 also shows that the edge of the Periférico (a 12-lane avenue) is a barrier to both the
time of access to transport and the social disadvantage of transport. It highlights that SITEUR
improves access to the population in the south with transport disadvantages, since it balances
out time those with greater social disadvantages. Therefore, the SITEUR bus network should
be expanded and the quality of the privately-operated bus network should be improved,
and another structured flexible transit system could be advisable for low demand for these
areas [31].

Figure 4:     Overlap of indexes of access time disadvantage and transport social
              disadvantage.

     WIT Transactions on The Built Environment, Vol 200, © 2020 A. L. Grindlay published by WIT Press under CCBY4.0
     www.witpress.com, ISSN 1743-3509 (on-line)
200 Urban Transport XXVI
Figure 5: Marginalization grade at neighborhood scale.
These results are consistent with the general socioeconomic reality of GMA as it can be
seen with respect to the mapped official marginalization grades [32] (Fig. 5).
On one hand, the strength of this study is its capacity to explain of a complex phenomenon
with a relatively simple methodology. Moreover, this methodology can be transferred to
other cities and be used for comparative studies over time. On the other hand, the study lacks
updated data, due to their availability. Consequently, future research will recalculate the
indices after the next population and housing census. Likewise, it is expected that social
exclusion will be reduced with new mass transportation lines under construction, as well as
the improvement of the quality of privately-operated bus and flexible transit systems in non-
central areas.
4 CONCLUSIONS
The link between public transport systems and social inclusion is well recognized.
Nevertheless, there is little empirical evidence of this relationship in Mexico, a country
characterized by structural inequalities. Thus, the innovative methodology developed and
applied to the GMA, Mexico is an advance in the empirical demonstration of this relationship.
This study has made it possible to identify that the most socially disadvantaged inhabitants
are not adequately served by the public transport system SITEUR. This is clearly revealed
with the calculated indicator of social exclusion related with SITEUR.
The analysis was carried out through the design and calculation of two indexes. First, the
IATD, a temporal disadvantage based on walking time to the SITEUR’s station/stop nearest
to the dwelling and, second, a multivariate ITDI based on socioeconomic factors unequally
distributed in the territory. Official open access data were introduced to basic statistical and
WIT Transactions on The Built Environment, Vol 200, © 2020 A. L. Grindlay published by WIT Press under CCBY4.0
www.witpress.com, ISSN 1743-3509 (on-line)Urban Transport XXVI 201
Geographic Information Systems tools. The results match with previous academic studies
obtained with qualitative methods showing that the non-central areas of the Latin-American
cities are the most socially excluded.
It can be concluded that SITEUR improves the time of access to public transport, but it is
insufficient to serve the Southeast which has a high transport social disadvantage. This is
understood by the difficulty of serving fragmented areas with mass transport. Thus, it is
suggested to increase the SITEUR quality bus network, to improve the quality of the
privately-operated bus network and other structured flexible transit systems for low demand
for these areas. In addition, the mass transportation line planned to connect the international
airport (at the south east of the GMA) will reduce the disadvantages in that area in the future.
ACKNOWLEDGEMENTS
With thanks to the National Council of Science and Technology (CONACYT), Mexico, the
Development Trust of Mexico (FIIDEM) and of ITESO, the Jesuit University of Guadalajara
for partially funding this research.
REFERENCES
[1] Cass, N., Shove, E. & Urry, J., Social exclusion, mobility and access. The Sociological
Review, 53(3), pp. 539–555, 2005. https://doi.org/10.1111/j.1467-954X.2005.00565.x.
[2] Sager, T., Freedom as mobility: Implications of the distinction between actual and
potential travelling. Mobilities, 1(3), pp. 465–488, 2006.
https://rsa.tandfonline.com/doi/abs/10.1080/17450100600902420.
[3] Jaramillo, C., Lizárraga, C. & Grindlay, A.L., Spatial disparity in transport social needs
and public transport provision in Santiago de Cali (Colombia). Journal of Transport
Geography, 24, pp. 340–357, 2012. https://doi.org/10.1016/j.jtrangeo.2012.04.014.
[4] Kenyon, S., Tackling transport-related social exclusion: Considering virtual access to
opportunities, services and social networks. New Technology in the Human Services,
14(3/4), pp. 10–22, 2002.
[5] Kenyon, S., Lyons, G. & Rafferty, J., Transport and social exclusion: investigating the
possibility of promoting inclusion through virtual mobility. Journal of Transport
Geography, 10(3), pp. 207–219, 2002.
[6] Preston, J. & Rajé, F., Accessibility, mobility and transport-related social exclusion.
Journal of Transport Geography, 15(3), pp. 151–160, 2007.
[7] Hine, J. & Mitchell, F., Transport Disadvantage and Social Exclusion: Exclusionary
Mechanisms in Transport in Urban Scotland, Routledge: London, 2016.
[8] Kamruzzaman, M., Yigitcanlar, T., Yang, J. & Mohamed, M.A., Measures of
transport-related social exclusion: A critical review of the literature. Sustainability,
8(7), p. 696, 2016.
[9] Lizárraga, C., Metropolitan expansion and mobility: The case of Caracas. Eure-Revista
Latinoamericana de Estudios Urbano Regionales, 38(113), pp. 99–125, 2012.
[10] Özkazanç, S. & Özdemir Sönmez, F.N., Spatial analysis of social exclusion from a
transportation perspective: A case study of Ankara metropolitan area. Cities, 67, pp.
74–84, 2017.
[11] Quevedo García, F., Asprilla Lara, Y. & González Pérez, M.G., Entropías de la
movilidad urbana en el espacio metropolitano de Guadalajara: Transporte privado y
calidad del aire. Tecnura: Tecnología y Cultura Afirmando el Conocimiento, 21(53),
pp. 138–140, 2017.
[12] Davoudi, S. & Bell, D. (eds), Justice and Fairness in the City: A Multi-Disciplinary
Approach to “Ordinary” Cities, Policy Press: Bristol, 2016.
WIT Transactions on The Built Environment, Vol 200, © 2020 A. L. Grindlay published by WIT Press under CCBY4.0
www.witpress.com, ISSN 1743-3509 (on-line)202 Urban Transport XXVI
[13] Vecchio, G., Tiznado-Aitken, I. & Hurtubia, R., Transport and equity in Latin
America: A critical review of socially oriented accessibility assessments. Transport
Reviews, 40(3), pp. 1–28, 2020. https://doi.org/10.1080/01441647.2020.1711828.
[14] Córdova España, M., Movilidad urbana sustentable para la zona conurbada de
Guadalajara. Guadalajara, Universidad de Guadalajara: México, pp. 393–429, 2007.
[15] Observatorio de Movilidad Urbana, Banco de Desarrollo de América Latina, CAF.
omu-caf-guadalajara-2015.xlsx, 2015. https://scioteca.caf.com/handle/123456789/
420. Accessed on: 1 Apr. 2020.
[16] Calonge Reillo, F. & Aceves Arce, R.H., Viajando por sectores no centrales del área
metropolitana de Guadalajara, México. La escasez de recursos y de alternativas de
transporte como condicionantes de la exclusión social. Sociológica, 34(96), pp. 137–
168, 2019.
[17] Jalisco Cómo Vamos, Moverse en GDL. Jalisco Cómo Vamos, 2019.
www.jaliscocomovamos.org/moverse-en-gdl. Accessed on: 15 Apr. 2020.
[18] Xia, J., Nesbitt, J., Daley, R., Najnin, A., Litman, T. & Tiwari, S.P., A multi-
dimensional view of transport-related social exclusion: A comparative study of Greater
Perth and Sydney. Transportation Research Part A: Policy and Practice, 94, pp. 205–
221, 2016.
[19] Grindlay, A.L., Jaramillo, C. & Lizárraga, C., Spatial relationships between mobility
opportunities and constraints of transport disadvantages: The case of Santiago de Cali,
Colombia. WIT Transactions on the Built Environment, vol. 176, WIT Press:
Southampton and Boston, pp. 119–129, 2017. http://dx.doi.org/10.2495/UT170111.
[20] Vicuña, M., Orellana, A., Truffello, R. & Moreno, D., Integración urbana y calidad de
vida: disyuntivas en contextos metropolitanos. Revista INVI, 34(97), pp. 17–47, 2019.
[21] Su, S., Zhou, H., Xu, M., Ru, H., Wang, W. & Weng, M., Auditing street walkability
and associated social inequalities for planning implications. Journal of Transport
Geography, 74, pp. 62–76, 2019.
[22] Humberto, M., Laboissière, R., Giannotti, M., Marte, C.L., Cruz, D.A. & Primon, H.,
Walking and walkability: Do built environment measures correspond with pedestrian
activity? Ambient Construído, 19(4), pp. 23–36, 2019.
[23] INEGI (National Institute of Statistics and Geography Mexico), Número de habitantes,
Jalisco. http://cuentame.inegi.org.mx/monografias/informacion/jal/poblacion/.
Accessed on: 14 Apr. 2020.
[24] Ríos, A.A., El transporte público en el área metropolitana de Guadalajara: agenda,
proyectos y “gatopardismo”. Revista Mexicana de Análisis Político y Administración
Pública, 7(1), pp. 11–32, 2018.
www.remap.ugto.mx/index.php/remap/article/view/241.
[25] Saavedra, V., Los 275 mil viajes por día del Tren ligero, representan un mínimo aporte
para la movilidad. El Occidental, 8 Feb., 2020. www.eloccidental.com.mx/local/los-
275-mil-viajes-por-dia-del-tren-ligero-representan-un-minimo-aporte-para-la-
movilidad-4810557.html.
[26] Castañón Reyes, H.E., Caracterizacion_del_ciudadano_metropolit.pdf. Guadalajara,
México: UN-Habitat – Gobierno del Estado de Jalisco, 2016.
[27] INEGI (National Institute of Statistics and Geography Mexico), SCINCE 2010
website. http://gaia.inegi.org.mx/scince2/viewer.html. Accessed on:24 Mar. 2020.
[28] Barranco-Ruiz, Y., León, C.C., Villa-González, E., Leal, X.P., Chillón, P. &
Rodríguez-Rodríguez, F., Active commuting to university and its association with
sociodemographic factors and physical activity levels in Chilean students. Medicina
(Lithuania) 55(5), 2019.
WIT Transactions on The Built Environment, Vol 200, © 2020 A. L. Grindlay published by WIT Press under CCBY4.0
www.witpress.com, ISSN 1743-3509 (on-line)Urban Transport XXVI 203
[29] Vuchic, V.R., Urban Transit: Operations, Planning, and Economics, John Wiley &
Sons: New Jersey, 2005.
[30] IMEPLAN (Metropolitan Planning Institute, Guadalajara, Mexico), Plan de
Ordenamiento Territorial Metropolitana del AMG, 2016.
http://imeplan.mx/sites/default/files/IMEPLAN/POTmet_IIIFB-BajaRes.pdf.
Accessed on: 15 Apr. 2020.
[31] Nourbakhsh, S.M. & Ouyang, Y., A structured flexible transit system for low demand
areas. Transportation Research Part B: Methodological, 46(1), pp. 204–216, 2012.
[32] IIEGJal (Institute of Statistical and Geographic Information of the State of Jalisco,
Mexico), Grado de marginación por colonia, 2010.
https://datos.jalisco.gob.mx/dataset/grado-de-marginacion-por-colonia. Accessed on:
29 Apr. 2020.
WIT Transactions on The Built Environment, Vol 200, © 2020 A. L. Grindlay published by WIT Press under CCBY4.0
www.witpress.com, ISSN 1743-3509 (on-line)You can also read