Examining Canadian Municipal Police Budgets: Implications for Defunding the Police - School of ...
←
→
Page content transcription
If your browser does not render page correctly, please read the page content below
Examining Canadian Municipal
Police Budgets: Implications for
Defunding the Police
Mélanie Seabrook
PI: Andrew Pinto, Upstream Lab, Unity Health Toronto
Co-investigators: Nicole Balian, Aisha Lofters, Flora Matheson,
Braden O’Neill, Akwasi Owusu-Bempah, Nav Persaud

School of Cities Urban Leadership Symposium - June 26th, 2021
Outline
  Background
  Rationale
  Research Question
  Methods
  Results
  Implications
Background
                                                                                               7.4 Indigenous individuals
                                                                                               killed
    Indigenous and Black populations
   are disproportionately impacted by
             police violence

        68% of fatal encounters                                                                5.6 Black individuals
                                                                                               killed
     involve someone with mental
           illness or addiction

                                                                                               1 White individual killed

                     Flanagan, Ryan. 2020. “What We Know about the Last 100 People Shot and Killed by Police in Canada.” CTV News. 2020.
                     Singh, Inayat. 2020. “2020 Already a Particularly Deadly Year for People Killed in Police Encounters, CBC Research Shows.” CBC News, 2020.
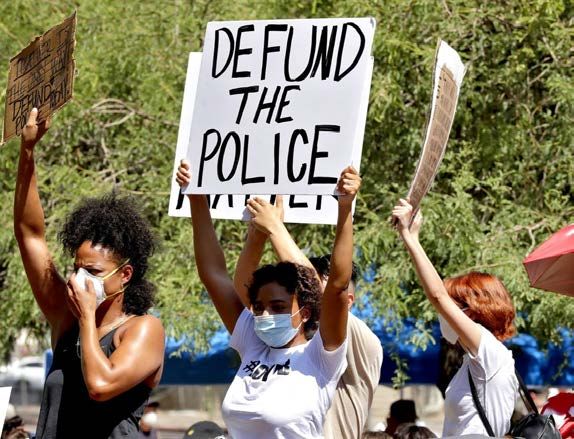
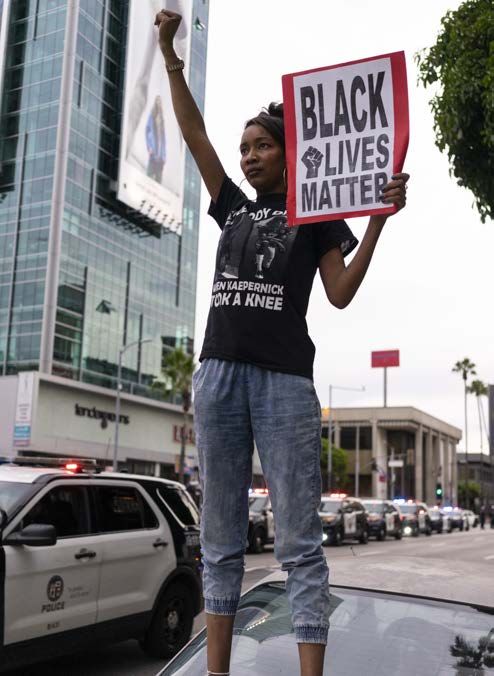
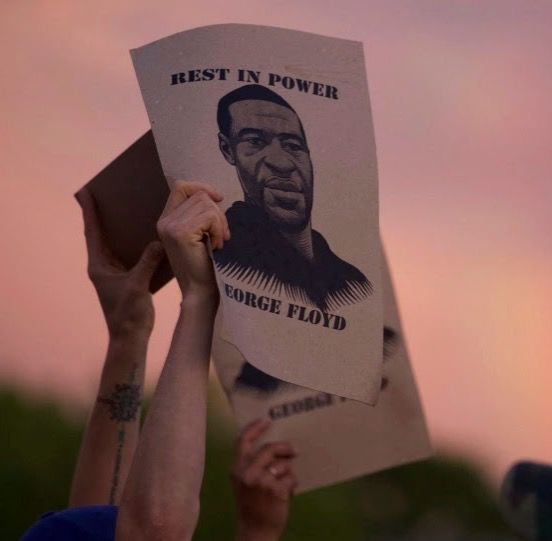
Rationale

Photos by Aaron Guy Leroux/ Sipa USA,
Christine T. Nguyen/Minnesota Public Radio via AP
How do different municipalities
                                        fund police services?

Research Question
How is law enforcement funded in   How does police funding compare
            Canada?                     with other services?

                                   Is police funding related to crime
                                                 rates?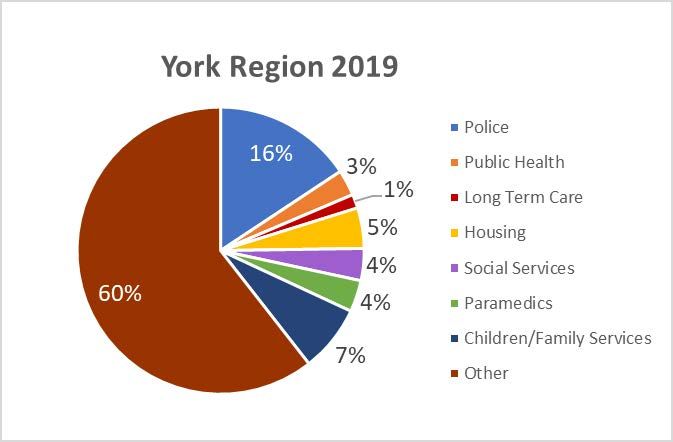
Methods

 Inclusion:                 Data collection:               Analysis:
 20 most populous           o Operational budgets          Proportion, per capita, $
 municipalities in Canada   o Police budgets               and % change from
                            o Other public service         previous year
 Operational budgets from
                              budgets
 2010-2021                                                 Converted to 2020 CAD
                            o Population estimates
                                                           (Bank of Canada)
 Actual expenditures        o Crime Severity Index (CSI)
                                                           Correlation between police
                                                           funding and crime rates
Results
Police Services are the biggest 2019 operating budget line item in 14 out of 20
municipalities:
Toronto, Montreal, Peel Region, Calgary, York Region (net budget only), Edmonton, Ottawa,
Winnipeg, Vancouver, Waterloo Region, Surrey, Quebec City, Hamilton, and Saskatoon
All gross police budgets have increased since 2010 except Montreal
Largest increase: Edmonton ($207M)
All spending per capita has increased since 2010 except Toronto, Montreal, Calgary,
and Halifax
*All results are adjusted for inflationLargest Proportions of 2019 Gross Budgets Allocated to
proportion
Winnipeg Surrey Police
Saskatoon Vancouver Peel
21% 20% 19%
26% 23%
74% 77%
79% 80% 81%
Waterloo York Region Edmonton Longueuil Calgary & Halifax
18% 16% 15% 14% 13%
82% 84%
85% 86% 87%
Montreal, Gatineau,
Laval & Burnaby Toronto & Hamilton London Ottawa & Quebec City
1… 11% 10% 8%
Smallest
89% proportion
88% 90% 92%Spending Per Capita in 2019
Results $500
$450
$400
Highest per capita:
$350
Vancouver ($495.84)
$300
Lowest per capita: $250
Quebec City ($217.05)
$200
$150
$100
$50
$0
eb ab y
W ont o
W awa
Lo a l
Ha n
Su x
To on
Ga d on
m il
sk g
el
ty
ng r
Bu au
M gary
o
y
Ha ork
Ca n
Ot al
Lo uve
rre
a
Ed ueu
Sa ipe
lo
oo
o
tre
v
Pe
Ci
lif
e
ilt
t
La
er
Y
on
Qu rn
tin
at
n
t
n
l
o
ec
m
on
r
at
in
nc
Va
*All results are adjusted for inflationResults Ontario 2019 gross budgets
Peel Waterloo York Region
Police
19% 18% 16%
3% 3%
3% 1%
41% 46%
4% 4% 5%
9% 7% 4%
60% 4%
11% 12% 7%
9% 7%
4% 3%
Hamilton Toronto London Ottawa
2% 1… 2%
3… 11% 10% 2% 8% 2%
12% 2%
3% 5…
5%
6% 9% 6%
2%
14%
57% 10% 10% 4%
58% 61%
71%
5% 2%
6… 3% 6% 2%Results Per capita spending on public services
Toronto
$600
Social
Assistance
$500
Police
$400
$300
Housing Children/
Family
$200
$100
$0
2010 2011 2012 2013 2014 2015 2016 2017 2018 2019 2020
*All results are adjusted for inflationImplications
Higher average per capita spending on police services was not
associated with larger decrease in crime rates
(Correlation = 0.22)
Understanding how resources are allocated to police is critical:
à Should be evidence-based to ensure well-being of communities
à May be time for a re-evaluation of public resource allocationConclusion
Goals for this research: Next steps:
• Increase public and academic understanding Ø Publication
of municipal resource allocation Ø Knowledge translation
• Lay the groundwork for future research:
Ø Context and rationales behind police
funding decisions
Ø Evaluation of capacity for
reallocation of resources
Ø Case studies of resource reallocation
processQuestions?
Thank you!
Mélanie Seabrook
melanie.seabrook@mail.utoronto.ca
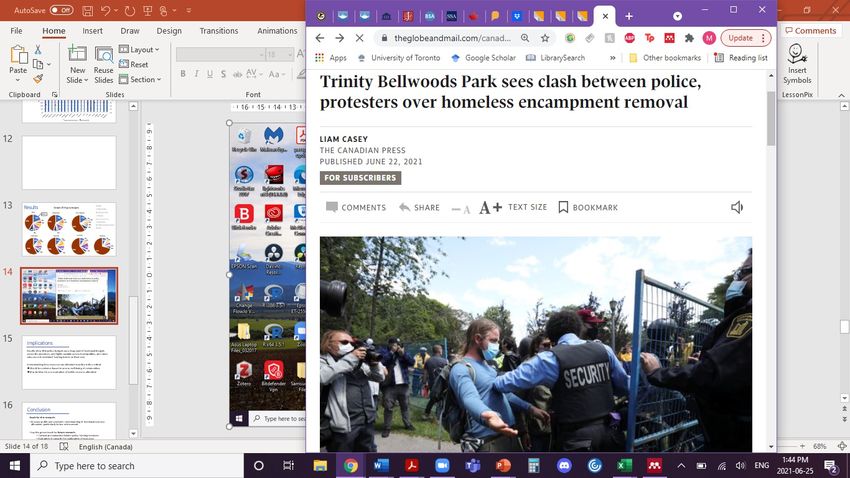
Upstream Lab: upstreamlab@smh.caReferences Bump, Philip. 2020. “Over the Past 60 Years, More Spending on Police Hasn’t Necessarily Meant Less Crime.” The Washington Post, June 7, 2020. https://www.washingtonpost.com/politics/2020/06/07/over-past-60-years-more- spending-police-hasnt-necessarily-meant-less-crime/. Flanagan, Ryan. 2020. “What We Know about the Last 100 People Shot and Killed by Police in Canada.” CTV News. 2020. Micallef, Shawn. 2021. “Toronto Shows Its Ugly, Brutish Side in Clearing of Trinity Bellwoods Encampment.” Toronto Star, 2021. https://www.thestar.com/opinion/contributors/2021/06/23/toronto-shows-its-ugly-brutish- side-in-clearing-of-trinity-bellwoods-encampment.html Singh, Inayat. 2020. “2020 Already a Particularly Deadly Year for People Killed in Police Encounters, CBC Research Shows.” CBC News, 2020.
You can also read