Market Volatility and COVID-19 - March 15, 2020 Prepared by: Jim Steel, CFA, CFP President & Portfolio Manager - Twenty Over Ten
←
→
Page content transcription
If your browser does not render page correctly, please read the page content below
Market Volatility and COVID-19
March 15, 2020
Prepared by:
Jim Steel, CFA, CFP
President & Portfolio Manager

The outbreak of the COVID-19 virus pandemic has caused us all to quickly change our daily routines and
cancel or postpone plans. Markets have reacted quite predictably and we are in the midst of a period of
extreme market volatility, although some optimism returned with Friday’s market rebound. Nobody
knows how long the current pandemic will last but I am confident that at some point, things will return to
normal. In the meantime, as investors, it is important to keep things in perspective (and to wash your
hands).

Some history
The Dow Jones Industrial Average is a basket of only 30 large US stocks but is the accepted gauge for
the performance of the US stock market. The largest single-day correction ever was on October 19, 1987
(Black Monday), when it fell more than 22%.
At that time, I was a part-time university student working at Dominion Securities. The reaction of most
brokers in the office that day was mostly fear and panic. The end of the world had arrived and no one was
prepared.
Most brokers sold off all their clients’ stocks and parked what was left in cash, essentially guaranteeing
permanent losses. Fortunately, the broker I worked with did not panic and responded in a more
reasoned and measured way. Instead, she took any un-invested cash and started buying, adding equity
to her clients’ existing high-quality investments. In a few short months by the end of 1987, the TSX
generated a +2.7% return for the year. The lesson here is that staying the course is usually the correct
course of action.
Recent events
Similar to the Dow, the S&P/TSX Composite Index (TSX) is the primary gauge for the performance of the
Canadian stock market. Chart 1 below shows the TSX over the last six weeks:

Polaris Wealth • Carling Executive Park • 1545 Carling Avenue • Suite 408 • Ottawa • Ontario • K1Z 8P9
(613) 755-4004 • (877) 755-4004 • info@polariswealth.ca • www.polariswealth.ca
Polaris Wealth is a division of Polaris Financial Inc. • www.polarisfinancial.ca
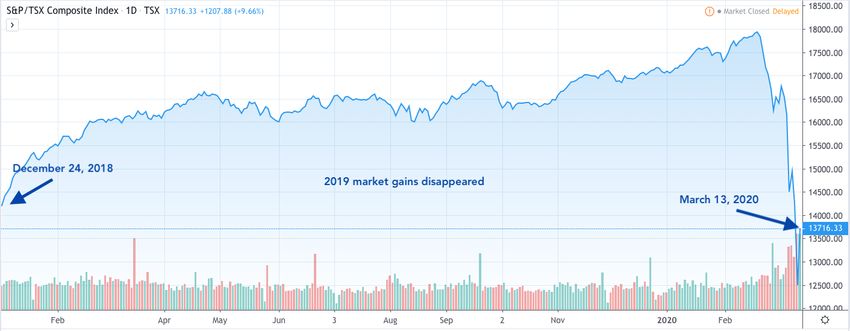
Chart 1:

                                                                    Source: TradingView, Yahoo Canada Finance

As of Friday (March 13, 2020), the TSX closed at 13,716, down from its all-time high of 17,944. This
represents a decline of 23.5%. Although it may feel like a long time since we have experienced a loss of
this magnitude, Chart 2 below shows it has not.

Chart 2:

                                                                    Source: TradingView, Yahoo Canada Finance

Chart 2 shows the TSX reaching a high of 16,567 in July 2018 before falling to 13,780 in December 2018 -
a significant drop of 17%. No one panicked and in fact, many people didn’t even realize it had
happened. The recovery was swift, as Chart 3 shows:

Polaris Wealth • Carling Executive Park • 1545 Carling Avenue • Suite 408 • Ottawa • Ontario • K1Z 8P9
(613) 755-4004 • (877) 755-4004 • info@polariswealth.ca • www.polariswealth.ca
Polaris Wealth is a division of Polaris Financial Inc. • www.polarisfinancial.ca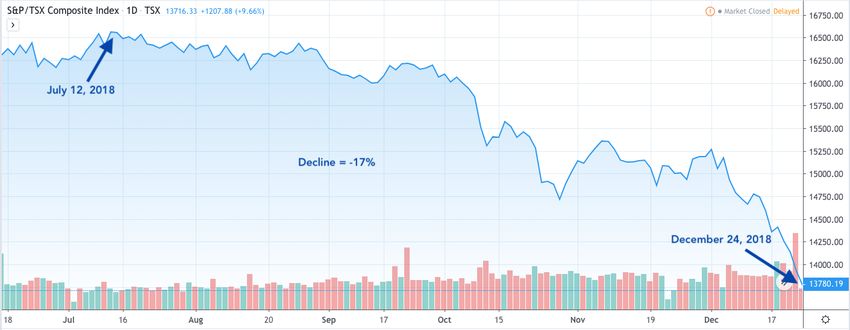
Chart 3:
Source: TradingView, Yahoo Canada Finance
Fast forward to today. After the recent volatility, markets have returned to where they were about 14
months ago, essentially taking back the 2019 market gains.
Longer term
The following are six of the largest corrections experienced by the TSX:
Year High Low Decline % Decline
2015-2016 15,540 11,843 (3,697) -23.79%
2011-2012 14,315 11,280 (3,035) -21.20%
2008-2009 15,073 7,557 (7,516) -49.86%
2000-2003 11,400 5,909 (5,491) -48.17%
Fall 1998 7,785 5,482 (2,303) -29.58%
Source: TradingView, Yahoo Canada Finance
Market corrections are both normal and to be expected. If there was no risk, there would be no return.
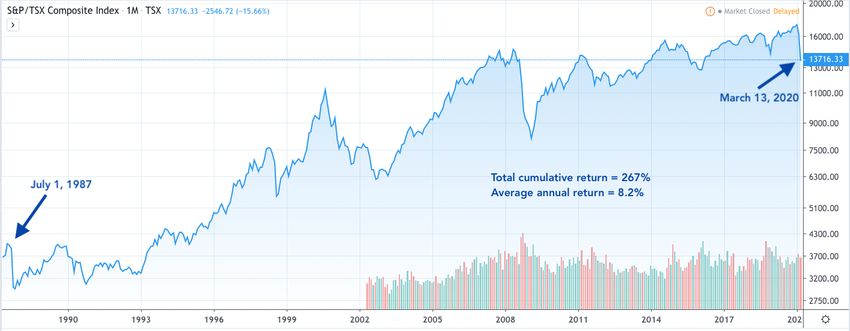
To put this into a broader perspective, the Chart 4 below shows how markets performed since July 1987.
Polaris Wealth • Carling Executive Park • 1545 Carling Avenue • Suite 408 • Ottawa • Ontario • K1Z 8P9
(613) 755-4004 • (877) 755-4004 • info@polariswealth.ca • www.polariswealth.ca
Polaris Wealth is a division of Polaris Financial Inc. • www.polarisfinancial.ca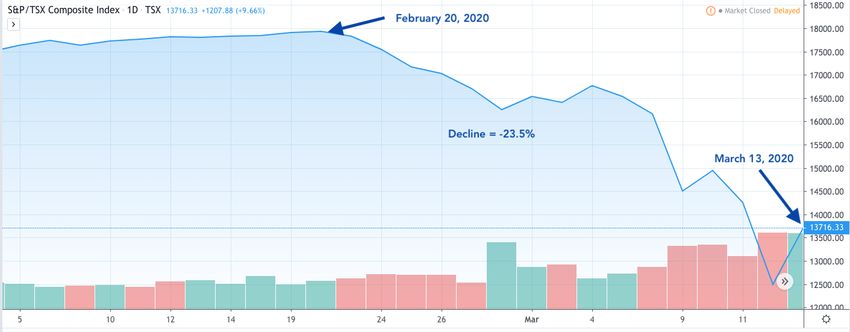
Chart 4:

                                                                                        Source: TradingView, Yahoo Canada Finance

The total cumulative return since the market peaked on July 1, 1987, up to and including the recent
correction, was 267%. This amounts to an average annual return of 8.2%. Investors who did not panic and
sell their assets were rewarded.
Although each period of extreme market volatility may feel different, it isn’t. No one knows how long this
volatility will continue. However, like the broker I worked with years ago, reacting in a reasonable and
measured way is the best approach during periods of uncertainty.
Reacting in a manner based on instinct and fear is never a good idea.
The key is to stay the course and of course, wash your hands.

This material is not to be construed as investment advice or a recommendation to buy or sell any security or currency. Investing
involves risks including possible loss of principal. Stocks are subject to market fluctuation and other risks. Bonds are subject to
increased risk of loss of principal during periods of rising interest rates and other risks. There is no assurance that any investment
strategy will be successful. Diversification does not assure a profit or protect against loss.

Polaris Wealth • Carling Executive Park • 1545 Carling Avenue • Suite 408 • Ottawa • Ontario • K1Z 8P9
(613) 755-4004 • (877) 755-4004 • info@polariswealth.ca • www.polariswealth.ca
Polaris Wealth is a division of Polaris Financial Inc. • www.polarisfinancial.ca
You can also read