Experimental evidence of the multiple microclimatic impacts of bushfires in affected urban areas: the case of Sydney during the 2019/2020 ...
←
→
Page content transcription
If your browser does not render page correctly, please read the page content below
PAPER • OPEN ACCESS

Experimental evidence of the multiple microclimatic impacts of bushfires
in affected urban areas: the case of Sydney during the 2019/2020
Australian season
To cite this article: Giulia Ulpiani et al 2020 Environ. Res. Commun. 2 065005

View the article online for updates and enhancements.

                               This content was downloaded from IP address 46.4.80.155 on 31/08/2021 at 02:01
Environ. Res. Commun. 2 (2020) 065005                                                       https://doi.org/10.1088/2515-7620/ab9e1a

                              PAPER

                              Experimental evidence of the multiple microclimatic impacts of
OPEN ACCESS
                              bushfires in affected urban areas: the case of Sydney during the
RECEIVED
16 March 2020                 2019/2020 Australian season
REVISED
15 June 2020
                              Giulia Ulpiani1        , Gianluca Ranzi1 and Mat Santamouris2
ACCEPTED FOR PUBLICATION      1
18 June 2020
                                  School of Civil Engineering, The University of Sydney, Sydney, New South Wales, Australia
                              2
                                  Faculty of Built Environment, University of New South Wales, Sydney, New South Wales, Australia
PUBLISHED
10 July 2020                  E-mail: giulia.ulpiani@sydney.edu.au

                              Keywords: experimental monitoring, bushfires, urban climate, particulate matter, precipitation, UV index, urban heat island
Original content from this
work may be used under
the terms of the Creative
Commons Attribution 4.0
licence.
                              Abstract
Any further distribution of   This paper presents the results of a monitoring campaign conducted in the inner west of the city of
this work must maintain       Sydney during the 2019/2020 bushfire season. The combined effects of extreme pollution, heat waves
attribution to the
author(s) and the title of    and droughts are analyzed in terms of microclimatic perturbation. A compact meteorological station
the work, journal citation
and DOI.                      measured air temperature, relative humidity, barometric pressure, precipitation, wind (speed and
                              direction), solar radiation, UV radiation, UV index, PM1, PM2.5 and PM10, at the one site. The
                              monitoring campaign lasted from the 20th of December 2019 to the 13th of January 2020, when
                              hundreds of bushfires were ravaging the bordering areas. A suite of dependencies emerged between
                              PM concentration and air temperature, relative humidity, wind speed and rain. PM concentration was
                              higher during the night and in the morning, especially after daytime overheating events (temperature
                              above 35 °C). Raindrops triggered the highest and most persistent dust levels. Dense layers of PMs, in
                              turn, strongly attenuated the UV radiation. Collected data also indicated anomalies in the intensity of
                              the urban heat island compared to historical trends. This study is a first attempt to link together several
                              different parameters on a local scale under weather anomalies. Future efforts will be directed to
                              strengthening the validity of the above results and approach to broader boundary conditions.

                              Acronyms
                              CIE                Commission Internationale de l’Eclairage
                              CRC                Cooperative Research Centre
                              CSIRO              Commonwealth Scientific and Industrial Research Organisation
                              E                  East
                              EAS                Erythemal Action Spectrum
                              FFDI               Forest Fire Danger Index
                              FIRMS              Fire Information for Resource Management System
                              IPCC               International Panel on Climate Change
                              Irr                Solar radiation [W m−2]
                              LGA                Local Government Area
                              MAE                Mean Absolute Error
                              MSE                Mean Squared Error
                              N                  North
                              NASA               National Aeronautics and Space Administration
                              NE                 North-east

                              © 2020 The Author(s). Published by IOP Publishing Ltd
Environ. Res. Commun. 2 (2020) 065005                                                                   G Ulpiani et al

NSW              New South Wales
NW               North-west
P                Barometric pressure [hPa]
PM1              Particulate matter (1 μm size) [μg m−3]
PM10             Particulate matter (10 μm size) [μg m−3]
PM2.5            Particulate matter (2.5 μm size) [μg m−3]
POM              Particulate Organic Matter
RH               Relative Humidity [%]
S                South
SE               South-east
SOM              Soil Organic Matter
SVF              Sky View Factor
SW               South-west
T                Temperature [°C]
UV               Ultraviolet (followed by A, B or C to define wavelength subranges)
UVI              Ultraviolet index
VIIRS            Visible Infrared Imaging Radiometer Suite
W                West
wd               Wind direction [°]
ws               Wind speed [m s−1]
λ                Wavelength [nm]

1. Introduction

The size and destructive potential of the 2019–20 Australian bushfires shocked the world. A recent global-scale
analysis on remotely-sensed burned areas during the last 20 years indicates that such fire episodes have burned
an unprecedented percentage of continental forest biome [1]. According to the Australian Government, from
September 2019 to the 14th January 2020, about 186 000 km2 (almost the size of England) have been burnt [2].
The fires claimed the lives of at least 34 people [3] and destroyed nearly 5900 buildings [4]. Moreover, an
estimated one billion native animals perished [5], with some species now facing the serious risk of extinction.
     According to a 2007 scientific report by the Bushfire CRC, the Australian Bureau of Meteorology, and
CSIRO Marine and Atmospheric Research [6], the number of ‘extreme’ fire danger days was expected to increase
by 5%–65% by 2020, depending on different global warming scenarios. Furthermore, the fire seasons were
projected to start earlier in the year and last longer, with potential repercussions on local air temperature trends
[7]. Recent events have confirmed most of these results and anticipated trends. An alarm bell is sounding
worldwide as 2019 was also the year when massive fires destroyed vast areas in the Amazon, Siberia and
California [8].
     It is crucial to have a better understanding of the potential consequences of an increased rate and extension
of bushfires, especially to improve the risk preparedness and subsequent coping strategies [9].
     Numerous studies have investigated and confirmed the deleterious health implications of bushfires [10–14]
as biomass burning is a major source of ambient particulate matter (PM). Comparatively underexplored is the
impact on local urban microclimates, concerning not just temperature, but key parameters including solar and
UV radiation, relative humidity, wind patterns and gusts, and all potential mechanisms such as urban heat
islands, that impact on outdoor livability.
     The Black Saturday bushfire event of February 2009 devastated the state of Victoria, Australia, and resulted
in 173 deaths. In their investigation of this calamity, Jacobs et al [15] focused on the relative importance of the
net energy flux terms and their consequences on the risk of dehydration and hyperthermia. The authors also
warned against the dangerous synergy between heat stress and air pollution, but without establishing any link.
On the other hand, Aleksandropoulou et al investigated the effect of biogenic volatile organic compounds and
windblown dust over urban areas emitted by large forest fires (Athens, 2008 fires) and found that the
contribution of these factors was rather small compared to that of anthropogenic emissions [16]. Sapkota et al
[17] examined the impact of the 2002 Canadian forest fires on the air quality in Baltimore City, revealing the
significant threat to densely populated urban areas, even thousands of kilometers away from the fires. Through a

                                               2
Environ. Res. Commun. 2 (2020) 065005 G Ulpiani et al
combination of satellite images, back-trajectory models and LIDAR data, the authors illustrated the local effects
on ambient and indoor levels of PM due to long-range transport. PMs penetrated indoors largely unimpeded,
with a median indoor-to-outdoor ratio of 0.91. 2002 was also the year of Lithuanian fires. Ovadnevaitė et al [18]
discussed the air quality and health-related implications in the city of Vilnius. Based on the measurements of
ambient air pollutants and meteorological parameters, they found that the correlation coefficient between PM10
and CO, NO, NO2, NOx increased during the fire period in comparison to the after-fire period, due to the
higher concentration of ozone precursors and the greater proclivity to photochemical reactions. Documented
respiratory diseases increased by up to 20 times during the fires. Indeed, when urban heat combines with intense
air pollution, the health risk is exacerbated and the corresponding disease etiology varies, thus impacting a larger
basin of vulnerable population [19, 20].
A novel framework that integrates social and health science is needed to better predict and react to such
escalating emergencies. Precondition involves the identification of how particulate matter and other pollutants
might influence not just the air quality but also the irradiative landscape and the environmental trends in
affected areas.
In this paper, a holistic approach based on multi-parameter measurements is proposed to study the
connection between bushfires and repercussions on the microclimate of urban areas of interest. The area being
investigated is discussed in the next paragraph, followed by a detailed description of the monitoring equipment
and experimental analyses. The results indicate the interdependency of PMs and temperature, relative humidity,
wind, time of the day, rain, UV radiation and urban heat island (UHI).
2. The investigated area
The monitoring campaign was undertaken in Sydney, the capital of New South Wales (NSW), from the 20th of
December 2019 to the 13th of January 2020. During this time, the city experienced a range of significant weather
extremes including heat waves, intense droughts and wind gusts of more than 100 km h−1 resulting in
unpredictable fire paths and extremely poor air quality in the nearby areas. To put the emergency into
perspective, an area larger than the Netherlands was burnt in the NSW, alone. This triggers an especially health-
threatening vicious circle of complex self-reinforcing feedbacks: extreme pollution suppresses rain, which
prolongs drought, which sustains heat waves and bushfires persistence [21, 22].
Figure 1 shows a satellite view of the bushfires in Australia and a close-up of regions in the outskirts of the city
of Sydney. Displayed data represents a 24-day temporal horizon of observation.
From September 2019, fires heavily impacted the regions in and around the Blue Mountains, such as
Hawkesbury and Wollondilly in Sydney’s far west, as well as Illawarra in the near south side. On the 12th of
November, a ‘catastrophic’ fire danger warning was issued for the Greater Sydney region for the first time since
its introduction. Meanwhile, the lack of precipitation triggered an intense heat wave that peaked on the 4th of
January: the western suburb of Penrith hit a high of 48.9 °C, setting a new record in the Greater Sydney area
(previously 47.8 °C in Richmond in 1939) [24].
The measurements were taken in the suburb of Petersham (Sydney’s Inner West), in a spot located
approximately 50 kms away from the Blue Mountains National Park and 2 kms away from both the city center
and the nearest coastline.
The monitoring station was placed in the green backyard of a suite of one-storey buildings, with an
unobstructed view of the sky (SVF=1 as visible in figure 2(c)) and subject to wind from any direction.
3. Monitoring equipment and post-processing
In this study, a holistic investigation was undertaken to determine the interplays between extreme weather
events (bushfires, droughts, heat waves) and a local urban microenvironment. Therefore, multi-parameter
monitoring was conducted simultaneously and at the same site, aimed at both climatological and air quality
characterization. A compact unit comprising different sensors was mounted on a tripod at a height of about
1.1 m. The list of measured/derived parameters is given in table 1, along with their technical specifications.
The station (figures 2(d) and (e)) retrieved data every second, and saved the output every minute. Derived
parameters were calculated based on an internal scrolling register that stored 600 s of historical wind data which
was used to calculate maximum, minimum and average wind speeds and wind direction over 2 min and 10 min.
Gust was calculated as maximum value of 3s-average wind speed at 10 min intervals, as recommended by the
World Meteorological Organization [25]. Solar and UV radiation were measured to establish whether any
attenuation occurred under the thick layer of bushfire smoke that frequently blanketed the city during the period
of observation. Ultraviolet radiation can damage the skin in a number of ways, causing erythema, premature
aging, skin cancer, burning etc [26, 27]. It can also harm the body’s immunological system [28] and the eyes
3
Environ. Res. Commun. 2 (2020) 065005                                                                                       G Ulpiani et al

  Figure 1. NASA Fire Information for Resource Management System (FIRMS) satellite data between 20-12-2019 and 13-01-2020
  (monitoring duration in this study): on the left side, fire count all over Australia (top) and breakdown into day and night fires in the
  area of Sydney (bottom); right side same information with VIIRS Corrected Reflectance imagery (Visible Infrared Imaging Radiometer
  Suite) to track the smoke plumes. The white-bordered rectangles in the top maps show the location and coverage of the bottom maps,
  while the white pointers in the bottom maps identify the monitoring site. Reproduced with permission from [23].

(cataracts and other ophthalmohelioses) [29]). It can be manipulated to obtain a unitless measure of its effects on
the human skin, known as the UV index (UVI). The UVI is calculated by means of a standard reference spectrum
that represents the average skin response to UVB and UVA, termed Erythemal Action Spectrum (EAS), first
defined by McKinlay and Diffey [30] and then implemented by the Commission Internationale de l’Eclairage
(CIE) [31]. UVI ranges from 0 to 15, categorized as minimal (0–2), low (5–6), high (7–9) and very high ( 10).
Particulate matter was also monitored. Three sizes were considered (PM1, PM2.5 and PM10), since particle size
is linked to: (i) the level of toxicity [32], (ii) the mortality rate and hospital admissions [33], (iii) the oxidative
damages and carcinogenic mechanisms [34], and (iv) the site of deposition in human lungs [35].
     The collected datasets were used to uncover and quantify synergistic/antagonistic links between
environmental and air quality parameters under the concerted action of bushfires, drought and heat wave. As
such, statistical analyses were carried out to relate PMs’ distribution to air temperature, relative humidity, wind
speed, wind direction, precipitation and UV index, making use of a supervised learning approach to deepen the
investigation, where appropriate. From a temporal perspective, the likelihood of higher/lower pollutants
concentration was associated to the different times of the day, by binning. The temperature distribution
alteration due to the intense bushfires was also inferred by comparison with historical multi-point temperature
measurements. Notably, temperature data from the BoM (Bureau of Meteorology) meteorological station
located at Observatory Hill were retrieved during the monitoring campaign. Observatory Hill was selected as the
reference station in order to assess the urban heat island intensity (UHII) at the monitoring site, in line with
several other UHI studies for the city of Sydney [36–38]. Seventeen years of historical temperature series
obtained from the reference station, as well as from another six BoM stations located in the Greater Sydney area
(Canterbury, Olympic Park, Bankstown, Richmond, Penrith and Camden), were used to identify potential UHI
anomalies.

                                                       4
Environ. Res. Commun. 2 (2020) 065005 G Ulpiani et al
Figure 2. Monitoring setup: (a) satellite view of the monitoring site with respect to the downtown area; (b) close-up on the monitoring
site at neighborhood scale; (c) fish-eye photo of the sky at the station location; (d) compact weather station; (e) the red sun during
Sydney bushfires (photo taken on the 21th of December). Parts (a) & (b) were reproduced with permission from ©2020 Google,
CNES/Airbus, Maxar Technologies.
Table 1. List of sensors and corresponding technical information. Refer to the acronyms section for the interpretation of coded names.
Variable Principle Range Accuracya Resolution
T MEMS sensor −40 °C÷80 °C ±0.5 °C 0.1 °C
RH MEMS sensor 0÷100% ±2% 0.1%
P MEMS sensor 150÷1100 hPa ±1 hPa 0.1 hPa
Precipitation (Type: rain/hail/snow+rain intensity) Radar 0÷100 mm h−1 ±10% 0.01 mm
Derived parameters: Accumulated precipitation
ws Ultrasonic 0÷40 m s−1 ±5% 0.1 m s−1
Derived parameters: Gust; Average, Maximum and Minimum in previous 2 and 10 min
wd Ultrasonic 0÷359°
Environ. Res. Commun. 2 (2020) 065005 G Ulpiani et al
Figure 3. Time series of some representative parameters during the 24 days of the monitoring campaign.
Figure 4. PM10, PM2.5 and PM1 content against air temperature (left side) and relative humidity (right side). Greyed area denotes
high concentration, while the green areas denote specific thresholds over which the content distribution changes radically.
PM1 with respect to the different values of air temperature and relative humidity, recorded during the campaign.
Statistically higher contents were recorded when the temperature was in the 19–29 °C range and the relative
humidity was 60%–87% (greyed areas). Conversely:
1. for T29 °C and especially above 33 °C (green areas), PMs’ volumetric densities fell into specific bands
(approximately between 20 and 60 μg m−3 as for PM10 and PM2.5, between 20 and 40 μg m−3 as for PM1).
Wind speed was also investigated due to the prominent role of transport mechanisms in the advection and
dilution of biomass burning plumes. A sensitivity analysis demonstrated that the average wind direction and
speed in the previous 10 min had a stronger influence on PMs compared to both the instantaneous readings and
the 2-min averages. The 10-min data were clustered to extract information related to wind patterns and
prevalence (figure 5).
During the monitoring campaign, PM10, PM2.5 and PM1 levels were all higher under local winds blowing
from the south and south-east, corresponding to the prevailing conditions. The maximum 90th percentile was
also related to southerly winds, regardless of the particle size. PMs tended to be sparser (lower P90) when the
wind was blowing from the west.
On another note, biomass-burning aerosols interact with the incoming radiation through scattering,
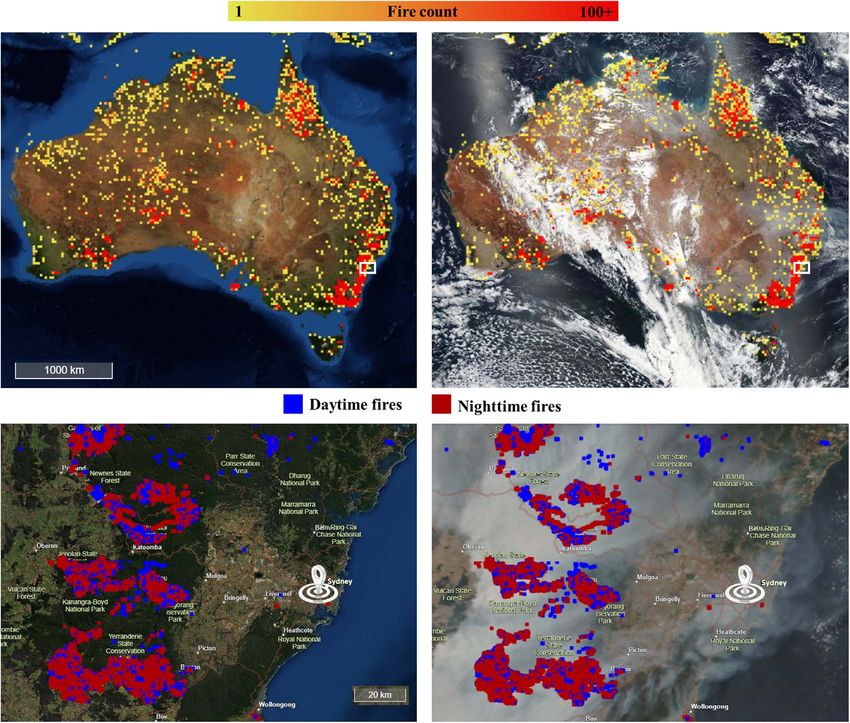
absorption and cloud condensation [41]. Direct measurement of the UV index indicated that the UVI tended to
decline with PMs densification (figure 6). Notably, several thresholds could be identified:
• if PMs
Environ. Res. Commun. 2 (2020) 065005 G Ulpiani et al
Figure 5. Relatability between PMs and 10-min averaged wind: wind rose (top left corner), dominant wind directions (bottom left
corner) and tabulated statistical analysis of PM content dependency on wind speed and direction (right side).
Figure 6. UVI dependency on particulate size and concentration.
• if PM10>140 μg m−3 or PM2.5>110 μg m−3 or PM1>60 μg m−3 approximately, then the UVI could
go as down as zero.
An AI-based approach based on evolutionary algorithms was utilized to verify those parameters, among all
the recorded/derived ones (table 1), that had greater impact on the UVI. Interestingly, the final Pareto-optimal
equations showed how UVI could be accurately predicted (R2 equal to 0.91) by knowing only the concomitant
solar radiation and PM content.
Figure 7 overlaps the modelled and measured UVI, showing a very good agreement.
7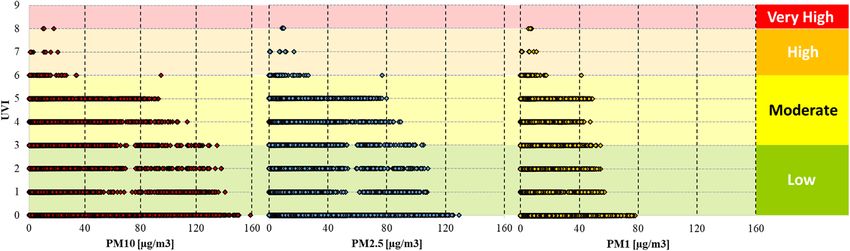
Environ. Res. Commun. 2 (2020) 065005                                                                   G Ulpiani et al

  Figure 7. UVI measured during the campaign compared to the results of the AI-built model.

    Under close scrutiny, the collected data suggest that other than very high daily temperatures, rain was also a
precursor to accentuated pollution (see figure 3). On the 7th and 8th of January, 3 mm of rain were recorded
after a prolonged persistence of dry conditions. Despite this, on the 8th of January at around 8am, the PMs
reached the highest levels with 10 μm particles exceeding 150 μg m−3. Pollution remained extremely high over
the whole day.

4.2. On the relationship between particulate matter and time of the day
To investigate whether the contents of PMs increased or decreased according to the time of day, all of the ranges
of PM10, PM2.5 and PM1 were binned into eight groups and distributed among four time slots (morning,
afternoon, evening and night) as shown in figure 8. Bin 1 and bin 8 collect the lowest (magnitude equal to the bin
width in figure 6) and the highest pollution levels (80, 130 and 160 μg m−3), respectively.
    Between 5 and 8 pm, all PMs tended to be lower. There was no reading for bin 8 during the afternoon and the
evening. After 8 pm, the volumetric density of particulate matter tended to increase significantly for bin 2, bin 3
and bin 4 (18%, 15% and 15% for PM1, PM2.5 and PM10, respectively).
    In terms of PM size, PM2.5 and PM10 followed a similar time-dependency. However, the PM1 had lower
content during the night compared to other times of the day (about 90% of night-time occurrences for bins 1
and 2), while tended to reach higher values over the morning and the afternoon. No PM1 was recorded during
the evening in bins 5–8.

4.3. On the relationship between particulate matter and urban heat island
The afore-mentioned perturbations caused by the smoky plume altered the thermal balance and the radiative
forcing in affected urban areas. Therefore, it was anticipated that the urban heat island pattern could be
responsive. In order to discover any anomalies, the UHII at the monitoring site during the 2019/2020 bushfires
was compared to the historical data at six different locations in the Greater Sydney Area. Figure 9 shows the
statistical distribution of the recorded UHII in the form of boxplots. Interestingly, the UHII assumed a purely
positive character during the bushfire only. The interquartile range was amply skewed towards the 3rd quartile,
meaning that higher values than the median were much more frequent than lower values. Such a pronounced
asymmetry is rarely observed in historical trends all over the considered area.

5. Discussion

In the above paragraphs, a suite of experimental observations is presented and hereinafter discussed. Figure 4
demonstrates how particulate matter tended to accumulate when specific thermohygrometric conditions were
met. Indeed, at a lower temperature and/or higher RH, deliquescence was more likely to occur. PMs absorbed
moisture from the atmosphere, undergoing gradual dissolution and liquefaction [42]. This is in line with [43], in
which PM10 were measured in Switzerland at more than ten sites simultaneously during a full year period. An
increase in relative humidity was found to decrease the PM10 (negative regression coefficient). In [44], it was
demonstrated that relative humidity also has a similar bearing on atmospheric dust. The authors found that

                                                      8
Environ. Res. Commun. 2 (2020) 065005 G Ulpiani et al
Figure 8. Progressively severer pollution events (from bin 1 to bin 8) and their frequency of occurrence in different time slots of the
day. The width of the bins and of the time slots is defined in the top-left corner tables.
higher relative humidity triggers the cohesion of soil particle; hence, the minimum friction velocity required for
the mobilization of particles from the ground into the atmosphere (saltation) increases.
On another note, over a certain temperature threshold, the volumetric densities of PMs fell into size-specific
maximum probability bands. This is not the result of intensified bushfire activity only, but also of pronounced
convective processes that, on the one hand, could have impeded the deposition of airborne particles, and on the
other, could have increased the inflow of dust. A similar condition is detected also for RHEnviron. Res. Commun. 2 (2020) 065005 G Ulpiani et al
Figure 9. Map of the eight locations considered for the UHI evaluation followed by UHII boxplots. The top-left single boxplot represents
the UHII statistical distribution during the bushfires at the monitoring site while the following charts represent the historical trends
between 2000/2017 at six locations within the Greater Sydney area. Colors in the map match the colors in the boxplots. Map data:
Reproduced with permission from ©2020 Google Earth, SIO, NOAA, U.S. Navy, NGA, GEBCO, Image Landsat/Copernicus.
transport is especially attributable to the finer fraction of particles (less than 2.5 μm for thousand km distance
[17], less than 5 μm for 500 km distance [52]), namely those too small to settle by gravity and too large to
coagulate [53]. Suspended particles might have been propelled towards the city by the stronger and longer lasting
local sea breeze. Furthermore, it is widely acknowledged that in the case of dense maritime conurbations, such as
Sydney, the sea breeze strongly interacts with the air circulation within the urban heat island [38], being attracted
by convergence zones over the city center and stalling for a longer time at a decelerated rate [54, 55]. Indeed, sea
breeze has been frequently identified as a major cause of pollutant advection over coastal cities [56, 57].
Biomass-burning aerosols have a strong and direct impact on surface-level radiation exposure through
scattering and absorption while also having a secondary indirect effect as cloud condensation nuclei [41]. This
scenario has been well documented worldwide regardless of the specific setting: from Amazonia [58–60] to
Zambian Savanna [60], from Northwestern Spain [61] to Russian peatbogs [62, 63], from Polar regions [64] to
10Environ. Res. Commun. 2 (2020) 065005 G Ulpiani et al
eastern United States [65], from South Asia [66] to southwestern British Columbia in Canada [67]. However, few
studies report specifically on ultraviolet (UV) radiation [68–70]. Kalashnikova et al [69] suggest that estimates of
the radiative impacts of Australian aerosols would be valuable inputs to UV Index forecasts. They compared the
measured UV irradiances during several episodes of relatively high aerosol activity against clear-sky conditions.
By using satellite and ground-based sunphotometer measurements, they proved that smoke aerosols over the
city of Darwin attenuated the surface UV irradiance by as much as 40%–50% at 290–300 nm and 20%–25% at
320–400 nm near active fires and by 15%–25% at 290–300 nm and ∼10% at 320–350 nm, downwind of fires.
Similarly, Chubarova et al [62] report that during the intensive fires sweeping across Central Russia in 2010, the
high aerosol optical thickness and small single scattering albedo caused a maximum irradiance loss of 64% for
global shortwave irradiance, of 91% for UV radiation and of 97% for erythemally-weighted UV irradiance. The
maximum losses occurred after the solar noon at a solar elevation of 47°. In a geophysical research study on
zooplankton distribution, carried out in the United States (Lake Tahoe, CA), it was found that wildfire smoke
selectively reduced the incident ultraviolet solar radiation [71]. Irradiance was recorded in three UV wavelengths
(305, 320, and 380 nm). The maximum daytime decrease of UV radiation occurred at 305 nm and reached 8%
when smoke haze was present. The impact was milder at longer UV wavelengths (4% and 1% respectively).
Furthermore, this study found a link between particulate matter concentration and UV, especially in terms of
erythemally-weighted irradiance. Notably, it was observed that above a certain content (PMs>20 μg m−3), the
UVI could not reach high levels, thereby reducing the health risk. Further, from the upper bounds defined above
for each particle size, the smoke haze was so dense that it acted as a perfect barrier to UV radiation, bringing the
UVI down to zero.
Aggravated pollution was also linked to rain events. This evidence contradicts the well acknowledged
aftereffect of rain that is, that it cleanses the air of pollutants and dust, unless cascading rain splash is considered
in all its potential ramifications. Sulphate, nitrate, ammonium, elemental carbon and particulate organic
material (POM) are major components of totally fire-driven PM2.5 and PM10, as demonstrated in urban site
sampling [72]. The mechanisms governing the formation of these particles are still a grey area [73] and tend to be
neglected in atmospheric models [74]. Raindrop impacts have been recently identified as an unexpected and
underexplored source of fine soil particles in the atmosphere. In 2015, Joung and Buie advocated that rainfall
could be responsible for soil-generated sub-micrometre aerosol [75]. The results of their lab experiments were
further supported by Wang et al in a 2016 study published in Nature Geoscience [73]. The authors investigated
the generation of soil organic matter after rain events. By means of chemical imaging and micro-spectroscopy of
particles collected right after natural precipitation, as well as experimental irrigation, they demonstrated that
raindrop impaction caused the ejection of sub-micrometre SOMs (soil organic matters) from the soil surface
into the air, contributing to up to 60% of atmospheric particles. The authors also claimed that the impact was
more pronounced when soils were exposed to strong, episodic precipitation events [76]. The inner mechanism
relies on the intense generation of bubbles within a layer of the impinging droplets: the dislodgement of fine
particles occurred upon the bursting of the bubbles on the air–water interface. This is especially likely during
bushfires since plant-derived products are labile in the soil matrix and thus, soluble components may be prone
to raindrop-associated aerosolization [73]. Therefore, the strongly acknowledged cleansing effect of rainfall can
be actually attenuated by organic particles spattering up from the soil into the atmosphere. Our data supports the
aforementioned results with further evidence, based on heavy rainfall events. Weak precipitation as well as water
sprinkling or misting are still expected to have a positive impact on urban pollution [77–79].
From a temporal perspective, the lowest levels of PMs occurred between 5 and 8 pm, due to the onset of
deliquescence processes. Conversely, the highest levels were recorded overnight and in the morning. Apparently,
as the Sun’s rays diminished, the air was able to settle closer to the ground and stagnate, allowing the
accumulation of pollutants. This mechanism extended to the early morning. Daily patterns of sea breeze might
have played a key role as well: in the late morning and afternoon, the high-pressure zone on the land drew fresh
air from the sea and, with it, the entrained smoke. This was particularly evident on heat wave days, when the
pressure difference was exacerbated, which explains why the worst pollution events systematically followed days
of extreme urban overheating (refer to figure 3). Conversely, in the evening, the pressure tended to equalize and
therefore this mechanism’s effect decreased or ceased.
Analysis of the UHII patterns showed a distinct anomaly during the bushfires that had never occurred in the
previous 20 years over the same calendar days: the UHII was always positive, with a statistical distribution
strongly leaning towards UHII higher than the median. The change in radiative forcing and thermal balance
emphasized the typical heat entrapment caused by built features, thereby preventing the occurrence of cool
island events. Hence, it is expected that during days of high pollution, rich in particulate matter, the UHI might
be exacerbated.
11Environ. Res. Commun. 2 (2020) 065005 G Ulpiani et al
6. Conclusions and outlook
This paper presents the results of an environmental and air quality monitoring campaign conducted in the city
of Sydney, during the massive bushfires that afflicted Australia between December and January 2020. A compact
sensor network recorded air temperature, relative humidity, barometric pressure, precipitation, wind (speed
and direction), solar radiation, UV radiation, UVI, PM1, PM2.5 and PM10.
The monitoring campaign lasted from the 20th of December 2019 to the 13th of January 2020, right in the
midst of the most ferocious blazes in the area. During this time, the PM10 content reached a maximum of
160 μg m−3, the temperature peaked at 46.2 °C, while the accumulated rain was 13.6 mm. Therefore, extreme
pollution, heat wave and drought were recorded simultaneously.
It was demonstrated that specific combinations of air temperature and relative humidity were conducive to
higher/lower levels of pollutant accumulation, in agreement with findings from previous scientific studies. In
general, higher PM concentration was recorded for night-time and early morning, especially after daytime
overheating events (temperature above 35 °C). It was also observed that long-transport mechanisms and
complex interactions between prevailing and local winds could have played a major role, making it difficult to
establish definite correlations between PMs and single environmental parameters.
Intense rain splashing was also associated with the most intense concentration of dust. Scientific literature
reports on the potential of airborne soil organic particles to be generated by precipitation. Our data confirm that,
despite their acknowledged air-cleansing properties, heavy raindrops also trigger a mechanism that produces
solid particles from soil, which can substantially raise the local pollution levels.
Another link was established between UVI and PM concentration. Several PM thresholds could be identified
above which UV radiation was strongly blocked and below which the UVI was likely to surpass moderate levels.
This relationship was further demonstrated by using evolutionary algorithms, and supports previous scientific
evidence of the attenuating effects of smoke aerosols on UV irradiance.
Additionally, the urban heat island intensity during the bushfire event was compared to that recorded during
the same period over the previous 20 years. Data from several BoM meteorological stations indicated an
additional effect of the microclimatic perturbation induced by the bushfires: the disappearance of cool island
events and the exacerbation of UHI events over the median.
This study provides insights on the multiple interplays between local meteorological and air quality
parameters when a combination of weather extremes interacts with the urban microclimate. It offers a new
holistic approach to environmental monitoring. However, the lack of multi-point measurements significantly
reduces the scope of this analysis; hence, quantitative evaluations should be interpreted with caution. This
notwithstanding, the discovered associations would be extremely valuable in building up a cohesive national
health protection strategy and encouraging better responsiveness from governments and city planners. In
future, other experimental activities will be carried out to extract general laws and climate dependencies.
ORCID iDs
Giulia Ulpiani https://orcid.org/0000-0002-1728-6442
References
[1] Boer M M, Resco de Dios V and Bradstock R A 2020 Unprecedented burn area of Australian mega forest fires Nat. Clim. Chang. 10
171–2
[2] Noble F 2020 Government set to revise total number of hectares destroyed during bushfire season to 17 million, 9NEWS. Aust.
Retrieved Febr. 2. (https://9news.com.au/national/australian-bushfires-17-million-hectares-burnt-more-than-previously-thought/
b8249781-5c86-4167-b191-b9f628bdd164)
[3] Henriques-Gomes L 2020 Bushfires death toll rises to 33 after body found in burnt out house near Moruya, Guard. ISSN 0261-3077
Retrieved January 30. (https://theguardian.com/australia-news/2020/jan/24/bushfires-death-toll-rises-to-33-after-body-found-
in-burnt-out-house-near-moruya)
[4] Tiernan E 2020 Finbar; O’Mallon, Australia’s 2019-20 bushfire season, Canberra Times. Retrieved Febraury 2. (https://canberratimes.
com.au/story/6574563/australias-2019-20-bushfire-season/)
[5] Dickman C 2020 More than one billion animals impacted in Australian bushfires, Univ. Sydney. Retrieved January 28. (https://sydney.
edu.au/news-opinion/news/2020/01/08/australian-bushfires-more-than-one-billion-animals-impacted.html)
[6] Lucas J, Hennedssy C, Mills K and Bathols G 2007 Bushfire Weather in Southeast Australia: Recent Trends and Projected Climate
Change Impacts http://cmar.csiro.au/e-print/open/2007/hennesseykj_c.pdf
[7] Livada I, Synnefa A, Haddad S, Paolini R, Garshasbi S, Ulpiani G, Fiorito F, Vassilakopoulou K, Osmond P and Santamouris M 2019
Time series analysis of ambient air-temperature during the period 1970–2016 over Sydney, Australia Sci. Total Environ. 648 1627–38
[8] Bose S 2020 Facebook, From Siberia To Australia, Wildfires That Ravaged The World In 2019, Repub. World. Retrieved 21 May 2020
(https://republicworld.com/world-news/rest-of-the-world-news/from-siberia-to-australia-wildfires-that-ravaged-the-world-in-
2019.html)
12Environ. Res. Commun. 2 (2020) 065005 G Ulpiani et al
[9] Vardoulakis S, Jalaludin B B, Morgan G G, Hanigan I C and Johnston F H 2020 Bushfire smoke: urgent need for a national health
protection strategy Med. J. Aust. 212 349–53
[10] Analitis A, Georgiadis I and Katsouyanni K 2012 Forest fires are associated with elevated mortality in a dense urban setting Occup.
Environ. Med. 69 158–62
[11] Faustini A et al 2015 Short-term effects of particulate matter on mortality during forest fires in Southern Europe: results of the MED-
PARTICLES project Occup. Environ. Med. 72 323–9
[12] Emmanuel S C 2000 Impact to lung health of haze from forest fires: the Singapore experience Respirology. 5 175–82
[13] Tham R, Erbas B, Akram M, Dennekamp M and Abramson M J 2009 The impact of smoke on respiratory hospital outcomes during the
2002–2003 bushfire season, Victoria, Australia Respirology. 14 69–75
[14] Rittmaster R, Adamowicz W L, Amiro B and Pelletier R T 2006 Economic analysis of health effects from forest fires Can. J. For. Res. 36
868–77
[15] Jacobs S J, Vihma T and Pezza A B 2015 Heat stress during the Black Saturday event in Melbourne, Australia Int. J. Biometeorol. 59
759–70
[16] Aleksandropoulou V, Torseth K and Lazaridis M 2013 The Effect of Forest Fires in Emissions of Biogenic Volatile Organic Compounds and
Windblown Dust Over Urban Areas 6 277–94
[17] Sapkota A, Symons J M, Kleissl J A N, Wang L U, Parlange M B, Ondov J, Breysse P N and Diette G B 2005 Impact of the 2002 Canadian
Forest Fires on Particulate Matter Air Quality in Baltimore City 39 24–32
[18] Ovadnevaitė J, Kvietkus K and Maršalka A 2006 2002 summer fires in Lithuania: impact on the Vilnius city air quality and the
inhabitants health Sci. Total Environ. 356 11–21
[19] O’Lenick C R, Wilhelmi O V, Michael R, Hayden M H, Baniassadi A, Wiedinmyer C, Monaghan A J, Crank P J and Sailor D J 2019
Urban heat and air pollution: a framework for integrating population vulnerability and indoor exposure in health risk analyses Sci.
Total Environ. 660 715–23
[20] Stone B 2005 Urban heat and air pollution: an emerging role for planners in the climate change debate J. Am. Plan. Assoc. 71 13–25
[21] Rosenfeld D 2000 Suppression of rain and snow by urban and industrial air pollution Science (80-.) 287 1793–6
[22] Gouveia C M, Bistinas I, Liberato M L R, Bastos A, Koutsias N and Trigo R 2016 The outstanding synergy between drought, heatwaves
and fuel on the 2007 Southern Greece exceptional fire season Agric. For. Meteorol. 218–219 135–45
[23] NASA, Fire Information for Resource Management System (FIRMS), (n.d.). (https://firms.modaps.eosdis.nasa.gov/map/)
[24] BoM A G 2020 (Bureau of Metereology, Greater Sydney in January 2020: record heat, severe storms, smoke and dust, Mon. Clim.
Summ. Gt. Sydney (http://bom.gov.au/climate/current/month/nsw/sydney.shtml)
[25] Harper B A, Kepert J D and Ginger J D 2010 Guidelines for Converting Between Various Wind Averaging Periods in Tropical Cyclone
Conditions—WMO (Switzerland: WMO Geneva)
[26] Matsumura Y and Ananthaswamy H N 2004 Toxic effects of ultraviolet radiation on the skin Toxicol. Appl. Pharmacol. 195 298–308
[27] Narayanan D L, Saladi R N and Fox J L 2010 Ultraviolet radiation and skin cancer Int. J. Dermatol. 49 978–86
[28] Kripke M L 1984 Immunological unresponsiveness induced by ultraviolet radiation Immunol. Rev. 80 87–102
[29] Taylor H R 1989 Ultraviolet radiation and the eye: an epidemiologic study Trans. Am. Ophthalmol. Soc. 87 802–53 American
Ophthalmological Society
[30] McKinlay A F, Diffey B L and Passchier W F 1987 Human Exposure to Ultraviolet Radiation: Risks and Regulations (Amsterdam,
Netherlands: Excerpta Medica)
[31] Standard, CIE 1998 Erythema reference action spectrum and standard erythema dose CIE S 7 E1998
[32] Mirowsky J et al 2013 The effect of particle size, location and season on the toxicity of urban and rural particulate matter Inhal. Toxicol.
25 747–57
[33] Anderson H R, Bremner S A, Atkinson R W, Harrison R M and Walters S 2001 Particulate matter and daily mortality and hospital
admissions in the west midlands conurbation of the United Kingdom: associations with fine and coarse particles, black smoke and
sulphate Occup. Environ. Med. 58 504–10
[34] Valavanidis A, Fiotakis K and Vlachogianni T 2008 Airborne particulate matter and human health: Toxicological assessment and
importance of size and composition of particles for oxidative damage and carcinogenic mechanisms J. Environ. Sci. Heal.—Part C
Environ. Carcinog. Ecotoxicol. Rev. 26 339–62
[35] Pinkerton K E et al 2000 Distribution of particulate matter and tissue remodeling in the human lung Environ. Health Perspect. 108 1063–9
[36] Santamouris M, Haddad S, Fiorito F, Osmond P, Ding L, Prasad D, Zhai X and Wang R 2017 Urban heat island and overheating
characteristics in Sydney, Australia. An analysis of multiyear measurements Sustainability 9 712
[37] Samuels R, Randolph B, Graham P, Mccormick T, Pollard B and Sydney H 2010 Micro-Urban-Climatic Thermal Emissions: in a
Medium-Density Residential Precinct
[38] Yun G Y, Ngarambe J, Duhirwe P N, Ulpiani G, Paolini R, Haddad S, Vasilakopoulou K and Santamouris M 2020 Predicting the
magnitude and the characteristics of the urban heat island in coastal cities in the proximity of desert landforms. The case of Sydney Sci.
Total Environ. 709 136068
[39] Department of the Environment, National Environment Protection (Ambient Air Quality) Measure, (2016). (https://legislation.gov.
au/Details/F2016C00215)
[40] World Health Organization and others 2006 WHO air quality guidelines for particulate matter, ozone, nitrogen dioxide and sulfur dioxide.
Global update 2005: summary of risk assessment World Health Organization Retrieved January 30
[41] Barros V R et al 2014 IPCC: Climate Change 2014: Impacts, Adaptation, and Vulnerability. Part B: Regional Aspects. Contribution of
Working Group II to the Fifth Assessment Report of the Intergovernmental Panel on Climate Change (Cambridge, UK: Cambridge Univ.
Press) 688
[42] Hueglin C, Gehrig R, Baltensperger U, Gysel M, Monn C and Vonmont H 2005 Chemical characterisation of PM2.5, PM10 and coarse
particles at urban, near-city and rural sites in Switzerland Atmos. Environ. 39 637–51
[43] Monn C, Braendli O, Schaeppi G, Schindler C, Ackermann-Liebrich U, Leuenberger P and Sapaldia Team and others 1995 Particulate
matterEnviron. Res. Commun. 2 (2020) 065005 G Ulpiani et al
[47] NASA, NASA animates world path of smoke and aerosols from Australian fires, (n.d.). (https://nasa.gov/feature/goddard/2020/
nasa-animates-world-path-of-smoke-and-aerosols-from-australian-fires)
[48] BoM A G 2020 (Bureau of Metereology, Wind speed and direction rose—SYDNEY AIRPORT AMO, Retrieved Febr. 18. (http://bom.
gov.au/cgi-bin/climate/cgi_bin_scripts/windrose_selector.cgi?period=Annual&type=9&location=66037)
[49] Crutzen P J and Andreae M O 1990 Biomass burning in the tropics: impact on atmospheric chemistry and biogeochemical cycles
Science (80-.) 250 1669–78
[50] Pahlow M, Kleissl J and Parlange M B 2005 Atmospheric boundary-layer structure observed during a haze event due to forest-fire
smoke Boundary-Layer Meteorol. 114 53–70
[51] Holloway T, Fiore A and Hastings M G 2003 Intercontinental Transport of Air Pollution: Will Emerging Science Lead to a New Hemispheric
Treaty?
[52] McTainsh G 1996 Dust concentrations and particle-size characteristics of an intense dust haze event: inland delta region, Mali, West
Africa Atmos. Environ. 30 1081–90
[53] Wilson R et al 1996 Particles in our Air: Concentrations and Health Effects (MA, USA: Harvard School of Public Health Cambridge)
[54] Ado H 1992 Numerical study of the daytime urban effect and its interaction with the sea breeze J. Appl. Meteorol. 31 1146–64
[55] Freitas E D, Rozoff C M, Cotton W R and Silva Dias P L 2007 Interactions of an urban heat island and sea-breeze circulations during
winter over the metropolitan area of São Paulo, Brazil Boundary-Layer Meteorol. 122 43–65
[56] Yoshikado H and Tsuchida M 1996 High levels of winter air pollution under the influence of the urban heat island along the shore of
Tokyo Bay J. Appl. Meteorol. 35 1804–13
[57] Chen F, Miao S, Tewari M, Bao J W and Kusaka H 2011 A numerical study of interactions between surface forcing and sea breeze
circulations and their effects on stagnation in the greater Houston area J. Geophys. Res. Atmos. 116 1–19
[58] Moreira D S et al 2017 Modeling the Radiative Effects of Biomass Burning Aerosols on Carbon Fluxes in the Amazon Region (European
Geosciences Union (EGU))
[59] Sena E T, Artaxo P and Correia A L 2013 Spatial variability of the direct radiative forcing of biomass burning aerosols and the effects of
land use change in Amazonia Atmos. Chem. Phys. 13
[60] Schafer J S, Eck T F, Holben B N, Artaxo P, Yamasoe M A and Procopio A S 2002 Observed reductions of total solar irradiance by
biomass-burning aerosols in the Brazilian Amazon and Zambian Savanna Geophys. Res. Lett. 29 1–4
[61] Calvo A I, Pont V, Castro A, Mallet M, Palencia C, Roger J-C, Dubuisson P and Fraile R 2010 Radiative forcing of haze during a forest
fire in Spain J. Geophys. Res. Atmos. 115
[62] Chubarova N, Nezval Y, Sviridenkov I, Smirnov A and Slutsker I 2012 Smoke aerosol and its radiative effects during extreme fire event
over central Russia in summer 2010 Atmos. Meas. Tech. 5 557–68
[63] Péré J C, Bessagnet B, Mallet M, Waquet F, Chiapello I, Minvielle F, Pont V and Menut L 2014 Direct Radiative Effect of the Russian
Wildfires and its Impact on air Temperature and Atmospheric Dynamics During August 2010
[64] Markowicz K M, Lisok J and Xian P 2017 Simulations of the effect of intensive biomass burning in July 2015 on Arctic radiative budget
Atmos. Environ. 171 248–60
[65] Vant-Hull B, Li Z, Taubman B F, Levy R, Marufu L, Chang F-L, Doddridge B G and Dickerson R R 2005 Smoke over haze: Comparative
analysis of satellite, surface radiometer, and airborne in situ measurements of aerosol optical properties and radiative forcing over the
eastern United States J. Geophys. Res. Atmos. 110
[66] Wang S-H, Lin N-H, Chou M-D and Woo J-H 2007 Estimate of radiative forcing of Asian biomass-burning aerosols during the period
of TRACE-P J. Geophys. Res. Atmos. 112
[67] Mckendry I G, Christen A, Lee S, Ferrara M, Strawbridge K B, Neill N O and Black A 2019 Impacts of an intense wildfire smoke episode
on surface radiation, energy and carbon fluxes in southwestern British Columbia, Canada Atmos. Chem. Phys. 19 835–46
[68] Luca R M and Ponsonby A L 2002 Ultraviolet radiation and health: friend and foe Med. J. Aust. 177 594–8
[69] Kalashnikova O V, Mills F P, Eldering A and Anderson D 2007 Application of satellite and ground-based data to investigate the UV
radiative effects of Australian aerosols Remote Sens. Environ. 107 65–80
[70] Mills F P, Weber L M, Petrass J B and Chee C Y 2011 Characterisation of aerosols over Australia and New Zealand and effects on surface
UV radiation Compos. Atmos. Fifth CAWCR Work (15 November–17 November 2011(Melbourne: Australia) p 59
[71] Urmy S S, Williamson C E, Leach T H, Schladow S G, Overholt E P and Warren J D 2016 Vertical redistribution of zooplankton in an
oligotrophic lake associated with reduction in ultraviolet radiation by wildfire smoke Geophys. Res. Lett. 43 3746–53
[72] Souza D Z, Vasconcellos P C, Lee H, Aurela M, Saarnio K, Teinilä K and Hillamo R 2014 Composition of PM2.5 and PM10 collected at
Urban Sites in Brazil Aerosol Air Qual. Res. 14 168–76
[73] Wang B, Harder T H, Kelly S T, Piens D S, China S, Kovarik L, Keiluweit M, Arey B W, Gilles M K and Laskin A 2016 Airborne soil
organic particles generated by precipitation Nat. Geosci. 9 433–7
[74] Bones D L, Reid J P, Lienhard D M and Krieger U K 2012 Comparing the mechanism of water condensation and evaporation in glassy
aerosol Proc. Natl Acad. Sci. 109 11613–8
[75] Joung Y S and Buie C R 2015 Aerosol generation by raindrop impact on soil Nat. Commun. 6 1–9
[76] Cotrufo M F, Soong J L, Horton A J, Campbell E E, Haddix M L, Wall D H and Parton W J 2015 Formation of soil organic matter via
biochemical and physical pathways of litter mass loss Nat. Geosci. 8 776–9
[77] Yu S 2014 Water spray geoengineering to clean air pollution for mitigating haze in China’s cities Environ. Chem. Lett. 12 109–16
[78] Ulpiani G 2019 Water mist spray for outdoor cooling: a systematic review of technologies, methods and impacts Appl. Energy 254
113647
[79] Zhang L, Vet R and Michelangeli D V 2006 Numerical investigation of gas scavenging by weak precipitation J. Atmos. Chem. 54 203–31
14You can also read