Explaining Extreme Events of 2019 from a Climate Perspective
←
→
Page content transcription
If your browser does not render page correctly, please read the page content below
Explaining Extreme
Events of 2019 from
a Climate Perspective

              Special
              Special Supplement
                       Supplement toto the
                                       the
  Bulletin
  Bulletin of
           of the
              the American
                   American Meteorological
                              Meteorological SocietySociety
            Vol.
             Vol. 102,
                  102, No.
                       No. 1,
                           1, January
                              January 2021
                                       2021
                                        Unauthenticated | Downloaded 03/20/21 04:27 AM UTC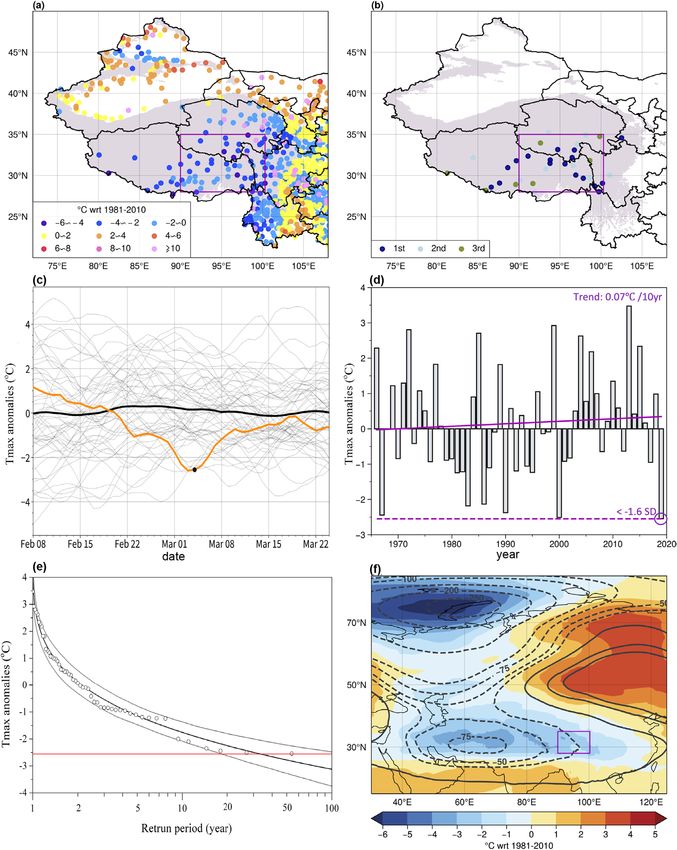
EXPLAINING EXTREME
EVENTS OF 2019 FROM A
CLIMATE PERSPECTIVE

                           Editors

    Stephanie C. Herring, Nikolaos Christidis, Andrew Hoell,
             Martin P. Hoerling, and Peter A. Stott

           BAMS Special Editors for Climate

               Andrew King, Thomas Knutson,
          John Nielsen-Gammon, and Friederike Otto

                 Special Supplement to the

        Bulletin of the American Meteorological Society

                 Vol. 102, No. 1, January 2021

       American Meteorological Society

                                                   Unauthenticated | Downloaded 03/20/21 04:27 AM UTC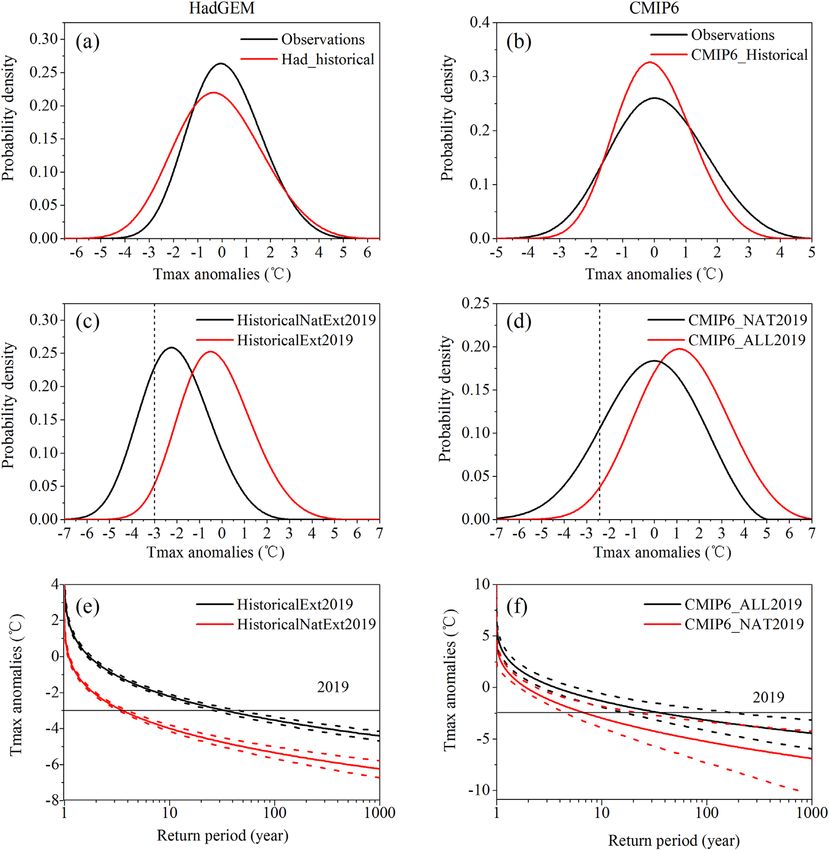
Corresponding Editor:
Stephanie C. Herring, Ph.D.
NOAA National Centers for Environmental Information
325 Broadway, E/CC23, Rm 1B-131
Boulder, CO 80305-3328
E-mail: stephanie.herring@noaa.gov
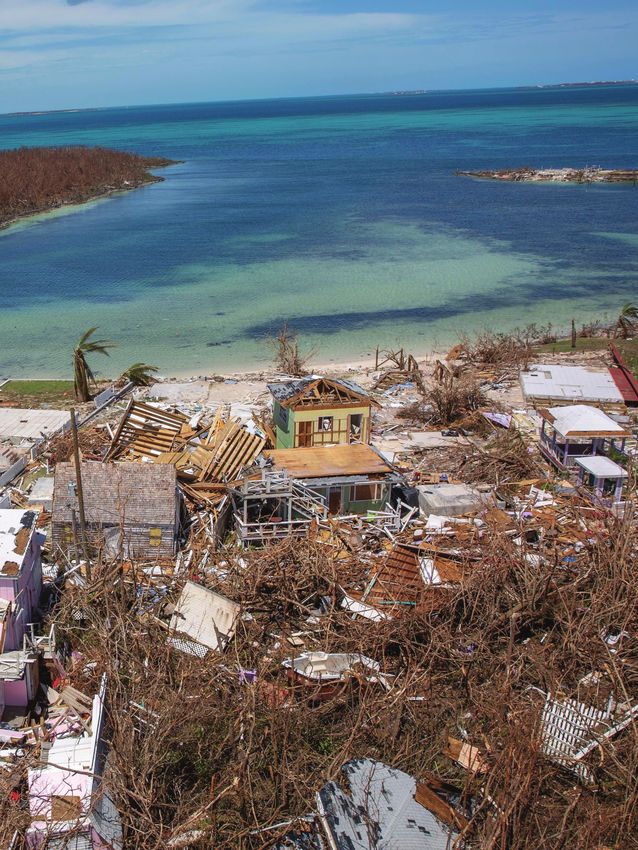
Cover: Ruins and rubble are all that are left of homes destroyed by Hurricane Dorian viewed from a U.S. Customs
and Border Protection rescue helicopter 5 September 2019 in Marsh Harbour, Abaco, Bahamas. Dorian struck the
small island nation as a Category 5 storm with winds of 185 mph. (credit: Planetpix/Alamy Stock Photo)
HOW TO CITE THIS DOCUMENT
Citing the complete report:
Herring, S. C., N. Christidis, A. Hoell, M. P. Hoerling, and P. A. Stott, Eds., 2021: Explaining Extreme Events
of 2019 from a Climate Perspective. Bull. Amer. Meteor. Soc., 102 (1), S1–S112, https://doi.org/10.1175/BAMS-
ExplainingExtremeEvents2019.1.
Citing a section (example):
Amaya, D. J., M. A. Alexander, A. Capotondi, C. Deser, K. B. Karnauskas, A. J. Miller, and N. J. Mantua, 2021: Are
Long-Term Changes in Mixed Layer Depth Influencing North Pacific Marine Heatwaves? [in “Explaining Extremes
of 2019 from a Climate Perspective”]. Bull. Amer. Meteor. Soc., 102 (1), S59–S66, https://doi.org/10.1175/BAMS-
D-20-0144.1.
Sii | JANUARY 2021
Unauthenticated | Downloaded 03/20/21 04:27 AM UTCTABLE OF CONTENTS
1. Increased Risk of the 2019 Alaskan July Fires due to Anthropogenic Activity. . . . . S1
2. Anthropogenic Influence on Hurricane Dorian’s Extreme Rainfall. . . . . . . . . . . . . . S9
3. Quantifying Human-Induced Dynamic and Thermodynamic Contributions
to Severe Cold Outbreaks Like November 2019 in the Eastern United States. . . . S17
4. Anthropogenic Influences on Extreme Annual Streamflow into Chesapeake
Bay from the Susquehanna River. . . . . . . . . . . . . . . . . . . . . . . . . . . . . . . . . . . . . . . . S25
5. Anthropogenic Contribution to the Rainfall Associated with the 2019
Ottawa River Flood. . . . . . . . . . . . . . . . . . . . . . . . . . . . . . . . . . . . . . . . . . . . . . . . . . . S33
6. Extremely Warm Days in the United Kingdom in Winter 2018/19 . . . . . . . . . . . . . S39
7. CMIP6 Model-Based Assessment of Anthropogenic Influence on the
Long Sustained Western Cape Drought over 2015–19. . . . . . . . . . . . . . . . . . . . . . . S45
8. Has Global Warming Contributed to the Largest Number of Typhoons
Affecting South Korea in September 2019?. . . . . . . . . . . . . . . . . . . . . . . . . . . . . . . S51
9. Are Long-Term Changes in Mixed Layer Depth Influencing North Pacific
Marine Heatwaves?. . . . . . . . . . . . . . . . . . . . . . . . . . . . . . . . . . . . . . . . . . . . . . . . . . . S59
10. Was the Extended Rainy Winter 2018/19 over the Middle and Lower
Reaches of the Yangtze River Driven by Anthropogenic Forcing?. . . . . . . . . . . . . S67
11. Roles of Anthropogenic Forcing and Natural Variability in the Record-
Breaking Low Sunshine Event in January–February 2019 over the
Middle-Lower Yangtze Plain. . . . . . . . . . . . . . . . . . . . . . . . . . . . . . . . . . . . . . . . . . . S75
12. Attribution of the Extreme Drought-Related Risk of Wildfires in Spring
2019 over Southwest China . . . . . . . . . . . . . . . . . . . . . . . . . . . . . . . . . . . . . . . . . . . . S83
13. Attribution of 2019 Extreme Spring-Early Summer Hot Drought over
Yunnan in Southwestern China. . . . . . . . . . . . . . . . . . . . . . . . . . . . . . . . . . . . . . . . . S91
14. Anthropogenic Influence on 2019 May–June Extremely Low Precipitation
in Southwestern China. . . . . . . . . . . . . . . . . . . . . . . . . . . . . . . . . . . . . . . . . . . . . . . . S97
15. Anthropogenic Influences on Heavy Precipitation during the 2019
Extremely Wet Rainy Season in Southern China . . . . . . . . . . . . . . . . . . . . . . . . . . S103
16. Anthropogenic Influences on the Extreme Cold Surge of Early Spring
2019 over the Southeastern Tibetan Plateau. . . . . . . . . . . . . . . . . . . . . . . . . . . . . S111
AMERICAN METEOROLOGICAL SOCIETY JANUARY 2021 | Siii
Unauthenticated | Downloaded 03/20/21 04:27 AM UTCSiv | JANUARY 2021
Unauthenticated | Downloaded 03/20/21 04:27 AM UTCAnthropogenic Influences
on the Extreme Cold Surge
of Early Spring 2019
over the Southeastern
Tibetan Plateau
Jianping Duan, Liang Chen, Lun Li, Peili Wu, Nikolaos Christidis,
Zhuguo Ma, Fraser C. Lott, Andrew Ciavarella, and Peter A. Stott
HadGEM3 and CMIP6 ensemble simulations suggest
that anthropogenic forcing has reduced the likeli-
hood of extreme early-spring cold surge over the
southeast Tibetan Plateau similar to 2019 by ~80%.
I
AFFILIATIONS: Duan, Chen, and Ma—CAS Key n early 2019, anomalously low air temperature hit the
Laboratory of Regional Climate-Environment southeastern Tibetan Plateau (TP) and had disastrous
for Temperate East Asia, Institute of Atmo- influence in some areas. A few local meteorological ad-
spheric Physics, Chinese Academy of Sciences, ministrations issued warnings for the cold event (http://
Beijing, China; Li—Chinese Academy of Meteo- www.cma.gov.cn/2011xwzx/2011xqxxw/2011xqxyw/201902
rological Sciences, Beijing, China; Wu, Christidis, /t20190220_515063.html). Reports show that the daily life of
Lott, Ciavarella, and Stott—Met Office Hadley more than 158,000 people and forage supplies of 1.19 million
Centre, Exeter, United Kingdom
livestock were affected by the cold event, which resulted in
CORRESPONDING AUTHOR: Jianping Duan, economic losses totaling 100 million Yuan (http://www.tibet
duanjp@tea.ac.cn .cn/cn/news/zcdt/201903/t20190321_6530435.html). This event
prompted an emergency rescue from the local governments.
DOI:10.1175/BAMS-D-20-0215.1 Observed records show that early spring air tempera-
ture in 2019 (averaged during 25 February to 11 March) over
A supplement to this article is available online
the TP was obviously lower compared to the 1981–2010
(10.1175/BAMS-D-20-0215.2)
climatology and was largely confined to 28°–35°N, 90°–
©2021 American Meteorological Society 100.3°E (Figs. 1a,b; see Fig. ES1 in the online supplemen-
For information regarding reuse of this content tal material). In particular, the regionally averaged daily
and general copyright information, consult the maximum air temperature (Tmax) during 25 February to
AMS Copyright Policy. 11 March of 2019 is record-breaking since 1966 (Figs. 1c,d).
AMERICAN METEOROLOGICAL SOCIETY JANUARY 2021 | S111
Unauthenticated | Downloaded 03/20/21 04:27 AM UTCFig. 1. (a) Observed anomalies of early spring (25 Feb to 11 Mar) Tmax (°C) over the TP and the surrounding area.
(b) Meteorological stations with Tmax anomaly of early spring 2019 ranked among the three coldest since 1966.
(c) The 15-day moving average of regional daily Tmax from February to March during 1966–2019. The orange, thin
gray, and thick gray lines are for 2019, 1966–2018, and the period mean of 1966–2019, respectively. The black dot
indicates the regional Tmax anomaly during 25 Feb to 11 Mar 2019. (d) Time series of early spring Tmax during
1966–2019 in the study area. (e) Return periods and 95% confidence intervals for early spring Tmax (°C), where the
red line denotes the year 2019. (f) Anomalies of 500-hPa geopotential height field (gpm) and early spring Tmax
(°C) of 2019 derived from ERA-5 dataset. Dots and the light gray shaded areas in (a) and (b) indicate the locations
of meteorological stations and the TP scope with an elevation more than 2,000 m above mean sea level, respec-
tively. The magenta box in (a), (b), and (f) indicates the range of the study area. All the anomalies are with respect
to the 1981–2010 climatology.
S112 | JANUARY 2021
Unauthenticated | Downloaded 03/20/21 04:27 AM UTCThis cold event resulted from the invasion of cold air from the northern high lat-
itudes centered basically at Novaya Zemlya where the cold air originated (Fig. 1f).
Anomalies of geopotential height at 500 hPa (Z500) during 25 February to 11 March
2019 show a large-scale cyclonic circulation west of the TP, transporting cold air from
the northern high latitudes across the TP. This induced the persistent and anomalous
low daily Tmax in early spring of 2019 over the southeastern TP. Attribution and atmo-
spheric circulation analysis of extreme events on the TP (Yin et al. 2019; Dong et al.
2001, Huang et al. 2018, Li and He 2019) and cold events in other midlatitude areas (Sun
et al. 2018; Francis and Vavrus 2015; Kug et al. 2015; Mori et al. 2014) have drawn great
attention. However, it is unclear how anthropogenic forcing has influenced the likeli-
hood of 2019-like cold events on the TP, especially under a rapid warming background.
In this study, we concentrate on such cold events and quantify the anthropogenic con-
tribution to the likelihood of cold events as instances when the early spring Tmax is
lower than the one observed in 2019 using daily observations and model simulations.
Data and methods.
Observations of daily temperature derived from 48 stations located in the study area
(available at http://data.cma.cn/) were used in this study (for detailed information please
see the supplemental information). The HadGEM3-A-N216 model simulations at a hori-
zontal resolution of 0.83° × 0.56° (Christidis et al. 2013; Ciavarella et al. 2018) and avail-
able simulations from 10 CMIP6 models (Table ES1) with (Historical/ALL) and without
(HistoricalNat/NAT) anthropogenic forcing are used in this study. Fifteen ensemble
members are available for Historical and HistoricalNat simulations during the period
of 1960–2013 and are extended to 525 members for 2019 conditions (HistoricalExt and
HistoricalNatExt). The HistoricalExt run was driven with observed SSTs, sea ice con-
centrations, and corresponding anthropogenic forcing (Rayner et al. 2003; Christidis
et al. 2013). The HistoricalNatExt run was driven by SSTs and sea ice concentrations
where a multimodel estimate of anthropogenic climate change has been removed from
the observations. All other forcings are set to preindustrial levels. Both the ALL and
NAT simulations from CMIP6 include 39 members (Table ES1). Moreover, daily Tmax
and daily geopotential height field data at 500 hPa from ERA5 (the fifth generation of
ECMWF atmospheric reanalyses of the global climate; Hersbach et al. 2020) were used
to analyze the atmospheric circulation related to the 2019 early spring cold event over
the TP.
Based on the observations (Fig. 1), regionally averaged anomalies of Tmax (simple
average of station data) during 25 February to 11 March (early spring hereafter) from
48 meteorological stations located within 28°–35°N, 90°–100.3°E are used to define
the extreme cold event over the southeastern TP. The value in 2019 (the lowest one,
−2.55°C with respect to 1981–2010 climatology) was chosen as the threshold for ob-
servations. For HadGEM/CMIP6 model simulations, area-averaged anomalies of early
spring Tmax over the study region (28°–35°N, 90°–100.3°E) were calculated for both
the historical period of 1966–2013/1966–2019 and the event year 2019. The generalized
extreme value (GEV) distributions were used to fit the distributions of both simulated
and observed data. A two-sided Kolmogorov–Smirnoff (K-S) test was applied to test if
the distributions of the observations and historical simulations are from the same pop-
ulation. To make simulations and observations comparable, we construct GEV distri-
butions using the samples from simulations and derive the thresholds for the event in
HadGEM3-A-N216 and CMIP6 with the same return period as the year 2019 in observa-
tion. The risk ratio (RR) (National Academies of Sciences, Engineering, and Medicine
2016) was used to quantify anthropogenic influences on the likelihood of frequency
of the 2019-like event. The RR is defined as P1/P0, where P1 is the probability of the
event in ensembles with anthropogenic forcing and P0 is that for ensembles without
anthropogenic forcing. Bootstrapping with 1,000 resamples was employed to calculate
the confidence intervals for the return period using empirical data.
AMERICAN METEOROLOGICAL SOCIETY JANUARY 2021 | S113
Unauthenticated | Downloaded 03/20/21 04:27 AM UTCResults.
The Tmax of early spring on the southeastern TP has a warming trend during 1966–2019
(0.07°C decade −1) (Fig. 1). Anomalies of the averaged early spring Tmax in 2019 at some
stations reached −6° to −4°C with respect to the 1981–2010 climatology, and ranked in
the lowest three since 1966. The return period of the 2019 cold event in observations is
about once in 34 years (Fig. 1e). Although comparisons of time series and spatial pat-
tern between the observed and simulated anomalies of early spring Tmax show some
differences (HadGEM simulations are better than CMIP6 simulations) (not shown), the
probability density function (PDF) indicates a relatively good similarity between the
simulated and observed early spring Tmax distributions (Figs. 2a,b). The Kolmogorov–
Smirnoff test indicates that there is no significant difference between the distributions
derived from HadGEM/CMIP6 model simulations and observations in the historical
period (p = 0.15/0.34). These results indicate that a formal attribution analysis for the
Tmax in early spring of 2019 can be reasonably conducted using the model simulations.
The 2019 GEV distributions show that the early spring Tmax is generally greater
from the PDFs derived from the Historical/ALL forcing than the PDFs derived from the
HistoricalNat/NAT forcing (Figs. 2c,d). The thresholds at −3.0°C (−2.42°C) with the same
return periods as observations are derived from simulations of HadGEM3-A-N216 (CMIP6)
for attribution (Figs. 2e,f). The likelihood of a 2019-like cold event over the southeast-
ern TP in HadGEM (CMIP6) model simulations with anthropogenic influence is 0.0295
(0.0294) [P1 = 0.0295 (0.0294)], while without anthropogenic influence is 0.2797 (0.152)
[P0 = 0.2797 (0.152)]; therefore, the RR is 0.11 (0.19). This suggests that anthropogenic forc-
ing has reduced the likelihood of extreme early spring cold surges over the southeastern
TP similar to the 2019 event by 89% (81%). Like previous studies (Mori et al. 2014; Francis
and Vavrus 2015; Kug et al. 2015), our study also shows an influence of the Arctic cold
air on the 2019 cold event over the midlatitude TP (Fig. 1f). However, further attribution
analysis indicates that climate warming (i.e., anthropogenic warming) has not induced
an increase of the frequency of such cold events, but rather has reduced its likelihood
in the midlatitude TP. Of course, our analyses are only based on one case of cold events
and cannot conclude that whether or not the southward movement of the Arctic cold air
under climate warming has induced more frequent cold events in other seasons or other
time windows on the TP. Both observed SSTs (used to drive HistoricalExt) (Figs. ES2a,c,e)
and the anthropogenic climate change of SSTs (removed from the HistoricalExt run SSTs
to generate the HistoricalNatExt boundary forcing) (Figs. ES2b,d,f) show warming con-
ditions in the early spring 2019. Anthropogenic climate change of SSTs contributed to
warming both in the land and ocean (Fig. ES2). Based on these estimates, anthropogenic
warming over the TP during February to March of 2019 was about 1.9°C. This means that
the Tmax of early spring 2019 would be 1.9°C lower than the actual without anthropo-
genic forcing. The uncertainty depends on the multimodel estimate used for simulations
of HistoricalExt (Christidis et al. 2013; Ciavarella et al. 2018).
Conclusions.
The southeastern TP experienced the coldest early spring in 2019 since 1966. This cold
event originated from the invasion of cold air from the northern high latitudes trans-
ported by an anomalous strong cyclonic circulation west of the TP. Analyses based on
HadGEM3 and CMIP6 ensemble simulations indicate that anthropogenic forcing has
reduced the likelihood of extreme cold event of early spring with an intensity equal to
or stronger than the record of 2019 over the southeastern TP by ~80%.
Acknowledgments. This research was supported by the National Natural Science
Foundation of China (Grants 41875113) and the National Key R&D Program of China
(2016YFA0600404) . PW, NC, FCL, AC, and PAS were supported by the U.K.–China
Research and Innovation Partnership Fund through the Met Office Climate Science for
Service Partnership (CSSP) China as part of the Newton Fund.
S114 | JANUARY 2021
Unauthenticated | Downloaded 03/20/21 04:27 AM UTCFig. 2. (a),(b) Probability density functions (PDFs) based on GEV fit for the observed and simulated early spring
Tmax during 1966–2013/2019. (c),(d) PDFs of fitted GEV distributions for early spring Tmax in 2019 from Historic-
alExt/ALL and HistoricalNatExt/NAT simulations. The dotted line indicates the threshold used. (e),(f) Return period
(years) of early spring Tmax in HistoricalExt/ALL and HistoricalNatExt/NAT simulations. Dotted lines show the
bootstrapped 5%–95% uncertainty range. Results are for simulations from the HadGEM model in (a), (c), and (e) and
the CMIP6 models in (b), (d), and (f).
References
Christidis, N., P. A. Stott, A. A. Scaife, A. Arribas, G. S. Jones, D. Copsey, Dong, W. J., Z. G. Wei, and L. J. Fan, 2001: Climatic character analyses
J. R. Knight, and W. J. Tennant, 2013: A new HadGEM3-A-based of snow disasters in east Qinghai-Xizang Plateau livestock farm (in
system for attribution of weather- and climate-related extreme Chinese with English abstract). Plateau Meteor., 20, 402–406.
events. J. Climate, 26, 2756–2783, https://doi.org/10.1175/ Francis, J. A., and S. J. Vavrus, 2015: Evidence for a wavier jet stream in
JCLI-D-12-00169.1. response to rapid Arctic warming. Environ. Res. Lett., 10, 014005,
Ciavarella, A., and Coauthors, 2018: Upgrade of the HadGEM3-A based http://doi.org/10.1088/1748-9326/10/1/014005.
attribution system to high resolution and a new validation frame- Hersbach, H., and Coauthors, 2020: The ERA5 global reanalysis. Quart.
work for probabilistic event attribution. Wea. Climate Extremes, 20, J. Roy. Meteor. Soc., 146, 1999–2049, https://doi.org/10.1002/
9–32, https://doi.org/10.1016/j.wace.2018.03.003. qj.3803.
AMERICAN METEOROLOGICAL SOCIETY JANUARY 2021 | S115
Unauthenticated | Downloaded 03/20/21 04:27 AM UTCHuang, X. Q., S. Y. Tang, and D. J. Ciwang, 2018: Variation of the snow National Academies of Sciences, Engineering, and Medicine, 2016: Attri-
disasters under global warming and its relationship with general bution of Extreme Weather Events in the Context of Climate Change.
circulation over Tibetan Plateau (in Chinese with English abstract). National Academies Press, 186 pp., https://doi.org/10.17226/21852.
Plateau Meteor., 37, 325–332. Rayner, N. A., D. E. Parker, E. B. Horton, C. K. Folland, L. V. Alexander, D.
Kug, J.-S., J.-H. Jeong, Y.-S. Jang, B.-M. Kim, C. K. Folland, S.-K. Min, and P. Rowell, E. C. Kent, and A. Kaplan, 2003: Global analyses of sea
S.-W. Son, 2015: Two distinct influences of Arctic warming on cold surface temperature, sea ice, and night marine air temperature since
winters over North America and East Asia. Nat. Geosci., 8, 759–762, the late nineteenth century. J. Geophys. Res., 108, 4407, https://doi.
https://doi.org/10.1038/ngeo2517. org/10.1029/2002JD002670.
Li, X. L., and L. F. He, 2019: Analysis of the February 2019 atmospheric Sun, Y., T. Hu, X. B. Zhang, H. Wan, P. Stott, and C. H. Lu, 2018: Anthro-
circulation and weather (in Chinese). Meteor. Mon., 45, 738–744. pogenic influence on the eastern China 2016 super cold surge.
Mori, M., M. Watanabe, H. Shiogama, J. Inoue, and M. Kimoto, 2014: Ro- Bull. Amer. Meteor. Soc., 99, S123–S127, https://doi.org/10.1175/
bust Arctic sea-ice influence on the frequent Eurasian cold winters BAMS-D-17-0092.1.
in past decades. Nat. Geosci., 7, 869–873, https://doi.org/10.1038/ Yin, H., Y. Sun, and M. G. Donat, 2019: Changes in temperature extremes
ngeo2277. on the Tibetan Plateau and their attribution. Environ. Res. Lett., 14,
124015, https://doi.org/10.1088/1748-9326/ab503c.
S116 | JANUARY 2021
Unauthenticated | Downloaded 03/20/21 04:27 AM UTCYou can also read