LETTERS The Atlantic-Pacific Seesaw
←
→
Page content transcription
If your browser does not render page correctly, please read the page content below

VOL. 17, NO. 11                                     JOURNAL OF CLIMATE                                                              1 JUNE 2004

                                                              LETTERS

                                               The Atlantic–Pacific Seesaw
                                                          OLEG A. SAENKO
      Canadian Centre for Climate Modelling and Analysis, Meteorological Service of Canada, Victoria, British Columbia, Canada

                                                       ANDREAS SCHMITTNER
                                     Institut für Geowissenschaften, Universität Kiel, Kiel, Germany

                                                        ANDREW J. WEAVER
                    School of Earth and Ocean Sciences, University of Victoria, Victoria, British Columbia, Canada

                                                  4 December 2003 and 8 January 2004

                                                                ABSTRACT
                A global, oceanic teleconnection of salinity, meridional overturning circulation (MOC), and climate of the
             North Atlantic and North Pacific is proposed. Simulations with a global climate model show that an extraction
             of freshwater from the Pacific results not only in an increase of salinity there, but also in a decrease of salinity
             in the Atlantic. As a result, a Pacific MOC develops while the Atlantic MOC collapses without freshwater
             perturbation in the Atlantic. Similarly, an input of freshwater to the Atlantic leads not only to a decrease of
             salinity there, but also to an increase of salinity in the Pacific. The Atlantic MOC collapses, whereas the Pacific
             MOC develops without freshwater perturbation in the Pacific. The mechanism behind this antiphase Atlantic–
             Pacific relationship is the positive feedback between ocean circulation and salinity contrasts, originally proposed
             by Stommel to operate between low and high latitudes. Here the authors show that the same mechanism operates
             on the Atlantic–Pacific interbasin scale, with the Southern Ocean acting as a pivot point for the interbasin seesaw.
             The proposed Atlantic–Pacific seesaw effect helps to explain some major out-of-phase oscillations of the climate
             states between the North Atlantic and North Pacific during the last deglaciation.

1. Introduction                                                         salinity contrast between the two ocean basins appears
                                                                        to play an important role (Warren 1983). This is also
   One of the most distinctive characteristics of the pre-              supported by the ocean modeling studies (e.g., Hughes
sent-day global ocean overturning circulation is its
                                                                        and Weaver 1994; Seidov and Haupt 2003).
asymmetry between the Atlantic and Pacific. North At-
                                                                           Our understanding of multiple states of ocean cir-
lantic Deep Water (NADW) forms in the Atlantic,
                                                                        culation is based on the early work of Stommel (1961).
whereas no such deep sinking exists today in the Pacific.
The resulting meridional overturning circulation (MOC)                  He used a box model to show how an anomalously
is responsible for a large fraction of the oceanic heat                 increased salinity contrast between tropical waters and
transport in the Atlantic, but not the Pacific. This is                 high-latitude waters would reduce the MOC and the
believed to be one of the key reasons for the observed                  associated northward advection of salinity, thereby fur-
difference between the relatively cold climate of the                   ther increasing the salinity contrast. As a result of this
northwestern parts of North America and the compar-                     positive feedback, when a certain threshold was ex-
atively warmer climate of northwestern Europe. The                      ceeded, the location of deep-water formation switched
mechanisms establishing and maintaining this Atlantic–                  from high to low latitudes. Bryan (1986) applied this
Pacific asymmetry remain controversial, although the                    feedback to explain the transitions from an equatorially
                                                                        symmetric circulation to an asymmetric circulation in a
                                                                        single-basin ocean model. He showed that deep-water
   Corresponding author address: Dr. Oleg A. Saenko, Canadian Cen-      formation in the Northern Hemisphere could be turned
tre for Climate Modelling and Analysis, Meteorological Service of
Canada, University of Victoria, P.O. Box 1700, Victoria, BC V8W
                                                                        on and off by applying freshwater forcing of a corre-
2Y2, Canada.                                                            sponding sign to high latitudes of the Southern Hemi-
E-mail: oleg.saenko@ec.gc.ca                                            sphere, that is, without any explicit forcing in the north.

                                                                   2033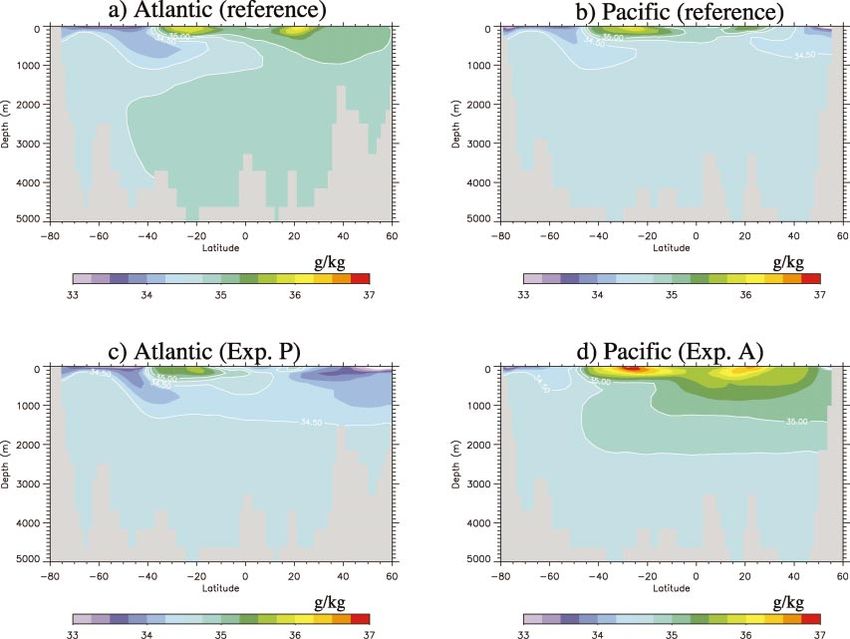
2034                                          JOURNAL OF CLIMATE                                                           VOLUME 17

Similar north–south MOC transitions have been illus-
trated to exist in a model of realistic continental con-
figuration (Weaver et al. 2003; Saenko et al. 2003), with
Stommel’s feedback playing an important role. Here we
show that this same feedback operates on an interbasin,
Atlantic–Pacific scale, with the Southern Ocean, and in
particular the Antarctic Intermediate Water (AAIW),
acting as a pivot point for the interbasin seesaw.

2. Climate model and experimental strategy
   The coupled model we use is described in detail in
Weaver et al. (2001). It comprises an ocean GCM, an
energy–moisture balance atmosphere model and a dy-
namic–thermodynamic sea ice model. All model com-
ponents have the same horizontal resolution of 1.88 lat-
itude and 3.68 longitude. The ocean model uses iso-
pycnal mixing after Gent and McWilliams (1990); the
vertical mixing scheme ensures very small values of
diffusivity in the pycnocline (order of 10 25 m 2 s 21 ) away
from regions of rough ocean bottom topography (Sim-
mons et al. 2004). The atmospheric model calculates
surface heat and freshwater fluxes, as well as the trans-
port of sensible heat and moisture. The annual cycle of
winds is prescribed from the National Centers for En-
vironmental Prediction–National Center for Atmospher-
ic Research (NCEP–NCAR) reanalysis.
   At steady state, the model simulates about 15 Sv (1
Sv [ 10 6 m3 s 21 ) of deep-water formation in the North
Atlantic and no deep-water formation in the North Pa-
cific. Starting from this reference state, we conduct two
sensitivity experiments, both of which illustrate the At-
lantic–Pacific seesaw effect. In experiment P, freshwater
was extracted from the surface of the North Pacific,
whereas in experiment A, freshwater was supplied to
the surface of the North Atlantic (Fig. 1a). To keep
global average salinity constant, the same total fresh-
water is extracted (in expt A) and added (in expt P) as
a uniform flux over the entire World Ocean area, apart
from the perturbation regions. Hereafter we distinguish
between the freshwater perturbations, applied in the lo-
calized regions of the North Atlantic and North Pacific,
and the much smaller (per unit area) compensating flux-
es. In both experiments, the rate of change of the fresh-
water forcing was slow [0.2 Sv (1000 yr) 21 ] to ensure
that the climate system was in near equilibrium with the           FIG. 1. (a) Schematic illustration of the Atlantic–Pacific seesaw
forcing. The experiments were integrated for 3000 yr,           effect and the region of freshwater extraction in expt P (marked P)
decreasing the freshwater forcing in experiment P from          and the region of freshwater discharge in expt A (marked A). (b)
0 to 20.6 Sv and increasing it in experiment A from             Maximum overturning circulation in the North Atlantic (NADW) and
                                                                in the North Pacific (NPDW), and (c) surface densities in the North
0 to 10.6 Sv.                                                   Atlantic (NADW; between 588 and 658N, 08 and 408W), in the North
                                                                Pacific (NPDW between 588 and 658N) and in the Southern Ocean
                                                                (AAIW between 558 and 628S) as functions of the freshwater ex-
3. The Atlantic–Pacific seesaw                                  traction in the North Pacific (to the left of zero) and freshwater input
                                                                in the North Atlantic (to the right of zero). The climate states labeled
   In both experiments, qualitatively similar out of phase      1 and 2 in (b) and (c) are discussed in the text.
behavior of the MOC between the Atlantic and the Pa-
cific is found. Extracting freshwater from the North Pa-
cific (expt P) makes the surface waters less buoyant
there. As a result, North Pacific Deep Water (NPDW)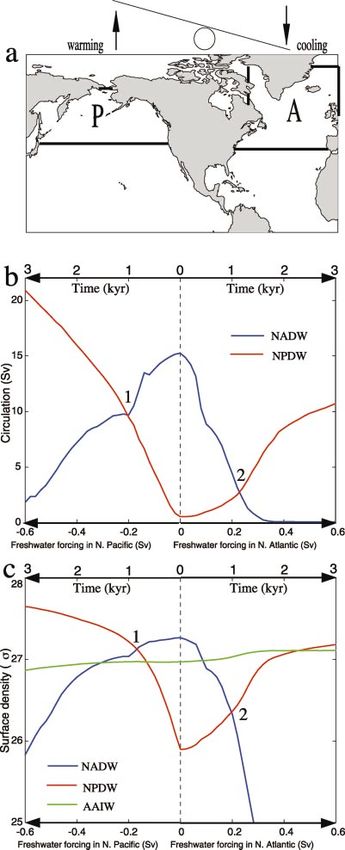
1 JUNE 2004                                                LETTERS                                                        2035

                    FIG. 2. Surface air temperature differences between the climate obtained (a) after extracting
                 freshwater from the Pacific (final state of expt P) and the reference climate state and (b) between
                 the climate obtained after discharging freshwater to the Atlantic (final state of expt A) and the
                 reference climate state. Negative values are shaded.

begins to develop. With the freshwater forcing becom-               turning in both oceans is about equal. However, in ex-
ing more negative, the overturning circulation associ-              periment P the Atlantic and Pacific MOCs could be said
ated with NPDW gradually intensifies, whereas the cir-              to be equally ‘‘strong’’ (Fig. 1b, state 1), whereas in
culation of NADW weakens (Fig. 1b, left part). When                 experiment A they are equally ‘‘weak’’ (Fig. 1b, state
the rate of freshwater extraction from the North Pacific            2). Insight as to why this is the case can be gained by
reaches 20.6 Sv, the maximum overturning in the North               considering the changes of water density in the region
Atlantic drops to 2 Sv without freshwater perturbation              of NADW formation (rNADW ) and in the region of
in the Atlantic. Furthermore, the Bering Strait is kept             NPDW formation (rNPDW ), and how these compare with
closed in the model so that the only connection between             the density of Antarctic Intermediate Water (rAAIW ) in
the Atlantic and the Pacific is through the Southern                the Southern Ocean. The extraction of buoyancy from
Ocean. Explicitly supplying freshwater to the North At-             the North Pacific results in a rather rapid increase of
lantic (expt A) dramatically reduces the Atlantic MOC,              surface density there, whereas the density decrease in
as expected. At the same time, the Pacific MOC begins               the Atlantic is slow (Fig. 1c, left part). As a result, when
to develop, without freshwater perturbation in the Pa-              the rate of freshwater extraction from the Pacific ap-
cific (Fig. 1b, right part).                                        proaches 20.2 Sv, the relationship between the densities
   When the freshwater forcing passes a value of 60.2               of these water masses is rNADW . rNPDW . rAAIW (Fig.
Sv (Fig. 1b, states ‘‘1’’ and ‘‘2’’), the maximum over-             1c, state 1). This means, according to scaling arguments
2036 JOURNAL OF CLIMATE VOLUME 17
FIG. 3. Large-scale salinity and circulation anomalies in the subsurface ocean (88-m depth) (a)
in the final state of expt A and (b) in the final state of expt P relative to the reference state. In (a)
salinity anomalies of more than 1 g kg 21 are shown in orange and those of less than 23 g kg 21
in blue. In (b), salinity anomalies of more than 1 g kg 21 are shown in orange and those of less
than 21 g kg 21 in blue. Vectors of less than 1 cm s 21 are not shown.
(Hughes and Weaver 1994; Gnanadesikan 1999), that seesaw effect is the positive feedback between salinity
both NADW and NPDW should be well developed, as anomalies and ocean circulation (Stommel 1961). A
indeed they are (Fig. 1b, state 1). supply of freshwater to the North Atlantic (expt A)
In contrast, supplying buoyancy explicitly to the weakens deep convection and hence sinking, thereby
North Atlantic in experiment A results in a rather rapid increasing the residence time of surface waters there.
decrease of surface density there, whereas the density This gives the forcing more time to operate, further
increase in the Pacific is slow (Fig. 1c, right part). As freshening the North Atlantic and weakening the deep-
a result, when the rate of freshwater input to the Atlantic water sinking. As shown by Bryan (1986), in a single
reaches about 10.2 Sv, the density relationship is rNADW equatorially symmetric and closed ocean basin this
. rNPDW , rAAIW (Fig. 1c, state 2). This implies that would eventually lead to a redirection of deep-water
both NADW and NPDW should be in collapsed or very formation and heat transport to the other hemisphere,
weak states. In our case, the maximum overturning in given the external constraints (such as radiation, mixing,
the Atlantic and in the Pacific at this forcing level is etc.) on the net amount of deep-water production in an
less than 5 Sv (Fig. 1b, state 2), again in agreement ocean basin.
with the scaling arguments. The real ocean is not equatorially symmetric. The
The northward heat transport in the two ocean basins existence of Drake Passage inhibits a net north–south
closely follows their overturning circulations. As a re- geostrophic flow in the upper ocean around 608S down
sult, the climate between the North Atlantic and the to about 2000-m depth. This, as well as the combined
North Pacific flips around in both experiments, making effect of strong surface buoyancy input and the north-
the North Atlantic cooler and the North Pacific warmer ward Ekman flow makes the Southern Ocean a region
(Fig. 2). of deep-water upwelling and transformation into a light-
The physical mechanism behind this Atlantic–Pacific er intermediate water and denser bottom water (e.g.,1 JUNE 2004 LETTERS 2037
FIG. 4. Salinity sections in the (a), (c) Atlantic at 278W and (b), (d) in the Pacific at 1698W; (a) and (b) correspond to the reference state
while (c) and (d) correspond to the final states of expts P and A, respectively.
Speer et al. 2000), rather than a region of deep-water water extraction from the North Pacific in experiment
sinking. As long as the denser deep water is being trans- P. The explicit forcing of the NPDW formation leads to
formed into the lighter intermediate water in the south, an enhanced flow of saline, low-latitude waters to the
there must be a compensating transformation of light North Pacific (Fig. 3b). At the same time, the initial
water into a dense water elsewhere, mainly in the north. surface freshwater cap in the North Pacific is gradually
As a result, when NADW formation weakens in our removed by the developing deep circulation and the
experiment A, the deep water (as opposed to bottom forcing. In an equatorially symmetric ocean, this would
water) begins to form in the Pacific, rather than in the lead to a redirection of deep-water formation and heat
Southern Ocean. The formation of NPDW is fed by a transport from another hemisphere (Bryan 1986). How-
reduction of the Indonesian Throughflow (by about 8 ever, deep water does not form in the Southern Ocean,
from 16 Sv in the reference state) and by a redirection so it is being redirected to the Pacific from the Atlantic.
of water from the Southern Ocean. The enhanced inflow The North Pacific becomes saltier, whereas the North
of saline subtropical waters due to the developing over- Atlantic becomes fresher. The vertical structure of sa-
turning circulation makes the North Pacific much saltier linity in the Atlantic becomes similar to the Pacific ref-
(Fig. 3a). As can be seen from Figs. 1b and 1c, after erence state, with fresh intermediate waters in both
the Atlantic MOC considerably weakens (state 2), it hemispheres propagating equatorward (Figs. 4b,c).
takes 1–2 kyr for this advective mechanism to spin up Again, no freshwater perturbation in the Atlantic was
the Pacific MOC so that rNPDW . rAAIW . Eventually, the needed to reorganize its salinity from that shown in Fig.
vertical salinity structure in the Pacific becomes similar 4a to that in Fig. 4c.
to that of the Atlantic in the reference state, with fresh
AAIW overlying saline NPDW (Figs. 4a,d). Note that
4. Implications for past climates and conclusions
no freshwater perturbation in the Pacific was needed to
reorganize its salinity from that shown in Fig. 4b to that Proxy data suggest that during the Younger Dryas
in Fig. 4d. (YD) period (;11.5–12.9 kyr BP) the Atlantic MOC
Similar arguments can be applied in the case of fresh- was weaker than today and that the climate of the North2038 JOURNAL OF CLIMATE VOLUME 17
Atlantic was much colder. Recent reconstructions sug- tive suggestions. AJW is grateful for release time pro-
gest that the last thousand years of the YD were ac- vided by the Killam Foundation and the Canada Re-
companied by an increase of sea surface temperature search Chair Program and for funding support from
(SST) in the North Pacific by as much as 18–28C (T. NSERC and CFCAS. AS is supported by the Deutsche
Kiefer 2003, personal communication). This was fol- Forschungs Gemeinschaft within the research unit on
lowed by a gradual decline of North Pacific SSTs by ocean gateways.
38–58C to their minimum around 8.5–8.0 kyr, whereas
the North Atlantic SSTs increased after the termination REFERENCES
of the YD. This pattern of opposite Atlantic versus Pa-
Bryan, F., 1986: High-latitude salinity effects and interhemispheric
cific temperature and ventilation changes on millennial thermohaline circulation. Nature, 323, 301–304.
time scale apparently extends back throughout the last Gent, P. R., and J. C. McWilliams, 1990: Isopycnal mixing in ocean
60 000 yr (Kiefer et al. 2001). Previous modeling studies general circulation models. J. Phys. Oceanogr., 20, 150–155.
succeeded in producing the ventilation pattern through Gnanadesikan, A., 1999: A simple predictive model for the structure
of the oceanic pycnocline. Science, 283, 2077–2079.
an atmospheric teleconnection (e.g., Schmittner and Hughes, T. M. C., and A. J. Weaver, 1994: Multiple equilibria of an
Clement 2002), although simulated SST anomalies were asymmetric two-basin ocean model. J. Phys. Oceanogr., 24,
of the same sign in both basins. The oceanic telecon- 619–637.
nection proposed here helps to explain the findings from Kiefer, T., M. Sarnthein, H. Erlenkeuser, P. M. Grootes, and A. P.
Roberts, 2001: North Pacific response to millennial-scale chang-
the paleorecord. es in ocean circulation over the last 60 ky. Paleoceanography,
We showed that deep-water formation in the Atlantic 16, 179–189.
and in the Pacific are fundamentally connected through Saenko, O. A., A. J. Weaver, and J. M. Gregory, 2003: On the link
a seesawlike effect. Specifically, a weakening of the between the two modes of the ocean thermohaline circulation
and the formation of global-scale water masses. J. Climate, 16,
Atlantic MOC as a consequence of a large freshwater 2797–2801.
perturbation there would result in a strengthening of the Schmittner, A., and A. C. Clement, 2002: Sensitivity of the ther-
Pacific MOC and an associated warming of the North mohaline circulation to tropical and high latitude feshwater forc-
Pacific, without freshwater perturbation in the Pacific. ing during the last glacial-interglacial cycle. Paleoceanography,
Similarly, a strengthening of the Pacific MOC would 17, 1017, doi:10.1029/2000PA000591.
Seidov, D., and B. J. Haupt, 2003: Freshwater teleconnections and
lead to a weakening of the Atlantic MOC and an as- ocean thermohaline circulation. Geophys. Res. Lett., 30, 1329,
sociated cooling of the North Atlantic, without fresh- doi:10.1029/2002GL016564.
water perturbation in the Atlantic. Taken together, and Simmons, H. L., S. R. Jayne, L. C. St. Laurent, and A. J. Weaver,
in the context of our earlier work (Weaver et al. 2003; 2004: Tidally driven mixing in a numerical model of the ocean
general circulation. Ocean Modell., 6, 245–263.
Saenko et al. 2003) and related work by others (e.g., Speer, K. G., S. R. Rintoul, and B. M. Sloyan, 2000: The diabatic
Seidov and Haupt 2003), it is clear that understanding Deacon cell. J. Phys. Oceanogr., 30, 3212–3222.
the behavior of the Atlantic MOC over the last glacial Stommel, H. M., 1961: Thermohaline convection with two stable
cycle requires an analysis of processes operating in the regimes of flow. Tellus, 13, 224–230.
Warren, B. A., 1983: Why is no deep water formed in the North
Southern Ocean and the North Pacific, as well as locally Pacific? J. Mar. Res., 41, 327–347.
in the North Atlantic itself. Weaver, A. J., and Coauthors, 2001: The UVic Earth System Climate
Model: Model description, climatology and application to past,
present and future climates. Atmos.–Ocean, 39, 361–428.
Acknowledgments. We would like to thank J. Fyfe ——, O. A. Saenko, P. U. Clark, and J. X. Mitrovica, 2003: Meltwater
and W. Merryfield, who provided internal reviews. We pulse 1A from the Antarctic ice sheet as a trigger of the Bølling–
also thank two anonymous reviewers for their construc- Allerød warm interval. Science, 299, 1709–1713.You can also read