Exploring Technical Quality Factors That Enhance Mobile Learning Applications Services Using Data Mining Techniques
←
→
Page content transcription
If your browser does not render page correctly, please read the page content below
International Journal of Information and Communication Technology Education
                                                                                Volume 17 • Issue 4 • October-December 2021

Exploring Technical Quality Factors That
Enhance Mobile Learning Applications
Services Using Data Mining Techniques
Ahmad Abu-Al-Aish, Department of Computer Science, Jerash University, Jerash, Jordan

ABSTRACT

Mobile learning (m-learning) has become an increasingly attractive solution for schools and
universities that utilize new technologies in their teaching and learning setting. This study investigates
the technical factors affecting the development of m-learning applications services from students’
perspectives. It presents a model consisting of 12 technical factors, including content usefulness,
scalability, security, functionality, accessibility, interface design, interactivity, reliability, availability,
trust, responsiveness, and personalization. To evaluate the model, a questionnaire was designed and
distributed to 151 students in Jerash University, Jordan. The results indicate that all technical factors
have positive effects on learner satisfaction and overall m-learning applications service; however,
the data mining analysis revealed that security and scalability factors exert a major impact on student
satisfaction with m-learning applications services. This study gives insight for the future of developing
and designing m-learning applications.

Keywords
Data Mining Techniques, M-Learning, M-Learning Applications, M-Learning Deployment, M-Learning
Implementation, Mobile Learning Application, Technical Factors, User Satisfaction

INTRODUCTION

In recent years, the rapid development in wireless and communication technologies and market forces
have made mobile devices widespread and relatively cheap, with fast and easy internet access, mobility,
and more convenience, including with regard to e-services such as e-commerce and educational
applications such as mobile learning (m-learning) (Almaiah et al., 2016; Sarrab et al., 2015; Wu et al.,
2012). M-learning is galvanizing technology utilization in higher education, enabling the delivery of
learning materials anytime, anywhere, and providing a strong opportunity for students and lecturers to
engage, communicate, collaborate, and share learning contents (Ali et al., 2012). Furthermore, using
mobile technologies in learning environments can offer control over learning, portability in terms of
time and place, and wide interaction (Jones et al., 2006; Traxler, 2009). The term ‘m-learning’ has
come to encompass all of these attributes in a pedagogical context.
     Technologies support learning and teaching are attracting many educators in different educational
fields to provide more efficient learning and teaching methods (Virtanen et al., 2018). Many researchers
investigated the benefits of m-learning for teaching and learning within schools and universities
environments. M-learning has been utilized as a tool to support secondary school students learning
basic programming concepts (Giannakoulas & Xinogalos, 2018), to improve students learning ability

DOI: 10.4018/IJICTE.20211001.oa14                                                                             *Corresponding Author
       This article published as an Open Access article distributed under the terms of the Creative Commons Attribution License
       (http://creativecommons.org/licenses/by/4.0/) which permits unrestricted use, distribution, and production in any medium,
                      provided the author of the original work and original publication source are properly credited.

                                                                                                                                   1
International Journal of Information and Communication Technology Education
Volume 17 • Issue 4 • October-December 2021
to discover new knowledge in learning natural science (Hung et al., 2014), learning resources in
museums (wang et al., 2016), and learning contents and location information using active learning
support system (ALESS) (Hsu et al., 2016). In addition, m-learning is an eminently suitable technology
for application in conventional higher education course teaching. It supports collaborative learning,
which is particularly useful in language learning as well as its general facilitation of ubiquitous
learning services (Alnabhan et al., 2018; Huang et al., 2016; Troussas et al., 2014). It has been used
to help undergraduate students learn computer programming (John & Rani, 2015), facilitate learning
computing and mathematics courses (Drigas & Pappas, 2015; Oyelere & Suhonen, 2016), and help
nursing students in their practical training (Guo et al., 2007; Wu et al., 2012).
M-learning users try to find applications that satisfy their requirements for learning services.
In other words, they demand services of necessary quality that improve their satisfaction to use
m-learning applications (Kim and Ong, 2005). The quality of m-learning services has been evaluated
in terms of the overall performance that affects student learning (Benhamida et al., 2017). The
principle idea in learning environments is that the quality of services and user satisfaction are the
key factors of successful learning and teaching processes. Quality of service is assayed in terms of
users’ perceptions of how good m-learning applications are (Sarrab et al., 2016). Delone and Mclean
(2003) indicate that system quality influences user satisfaction towards systems. Many researchers
clarify that factors related to system quality play a significant role in successful system deployment
(Almarashdeh et al., 2010).
There is a shortage of research considering the technical quality aspects of m-learning applications
services in higher education institutes. there are a few studies that discuss this topic. The novelty of
this study is to explore and evaluate technical quality factors that help the development of m-learning
applications in higher education environments. This can provide high quality services which motivate
students, instructors, and decision makers to use and implement m-learning technology. The study
contributes to m-learning researches by adding comprehensible and clear model that contains technical
quality factors that should be consider while design and implement m-learning applications in higher
education.
RELATED RESEARCH
M-learning offers a good opportunity for learning and teaching process. Several studies have
investigated the design of m-learning applications in terms of pedagogical or technical aspects and
issues (Oyelere et al., 2018). M-learning systems providing great service quality and stakeholder
satisfaction are considered the main factor for a successful m-learning process in higher education
environments (Sarrab et al., 2016). Al-Mushasha and Hassan (2009) investigated university students’
perceptions about m-learning services’ quality, students’ satisfaction with m-learning services, and
students’ behavioral intention to utilize m-learning in their studies. They proposed a service quality
model for m-learning in university context that measured ten technical factors derived from service
quality, information quality, and system quality on overall students’ perceived services quality. In
addition, they measured the relationship between overall perceived quality, learner satisfaction, and
behavioral intention. The results indicated that the technical factors of interface design, trust, content
usefulness, content adequacy, ease of use, reliability, accessibility, and interactivity support m-learning
services for university students. Furthermore, the results indicated that there is a relationship between
overall perceived m-learning services and student satisfaction, and between student satisfaction and
behavioral intention to use m-learning.
Almaiah et al. (2016) investigated the factors that enhance mobile learning system quality based
on university students’ perspectives. They presented and tested three frameworks for m-learning
system based on quality factors. The three frameworks depend on three types of quality factors with
eleven sub-quality factors: (1) information quality, concerning content usefulness and adequacy; (2)
system quality, concerning functionality, accessibility, interactivity, interface design, and ease of use;
2International Journal of Information and Communication Technology Education
Volume 17 • Issue 4 • October-December 2021
and (3) service quality, including availability, personalization, trust, and responsiveness. The data
were collected from a total 392 graduate and undergraduate students from five Jordanian universities.
The results indicated that all quality factors supported high-quality of m-learning systems that meet
student requirements and contribute to the successful deployment of m-learning system in higher
educational institutes.
Sarrab et al. (2016) proposed and described a model that contains the technical aspects of
mobile learning services quality. A group of technical quality factors was derived from mobile
learning application previous studies, with concentration on mobile application software for learning
and teaching. The model includes flexibility, scalability, usability, availability, quick response,
maintainability, performance, functionality, reliability, connectivity, user interface, and security.
To validate the workability of the proposed model, the researchers examined the twelve
components of the model (technical quality factors) with different and well-known mobile learning
platforms empirically. Four case studies were investigated against the technical quality factors in
order to determine which technical factor contributes to and enhances the development of m-learning
application services in the education context. The case studies were the following m-learning systems:
MOODEL, Blackboard, Schoology, and Edmodo. The results indicate that there are relationships
between the overall technical aspects of the proposed model and learner satisfaction. In addition,
the model supports the overall learning process by validating the technical aspects while control the
quality of mobile learning deployed.
Other studies explored the factors that affect the continuous usage of m-learning service within
higher education institutions. Glood et al. (2018) tested the effect of information quality, services
quality, and compatibility on user satisfaction, and finally the continuous usage of m-learning. The
findings indicated that information quality, services quality, and compatibility affect the usage of
m-learning through user satisfaction. Furthermore, the findings suggest that m-learning service
providers need to provide high quality information, good services, and compatibility to maintain the
post adoption of m-learning services.
It is worth to mention that a lot of studies in m-learning field concentrate on m-learning acceptance
using Technology acceptance model (TAM) (Liu et al., 2010) and Unified Theory of Acceptance and
Use of Technology (UTAUT) (Abu Al-Aish & Love, 2013; Venkatesh et al., 2003). The aim of these
studies was to investigate user’s behavioral attention toward use m-learning. Other studies aimed to
build frameworks and models for m-learning system in education environment (Motiwalla, 2007)
to discuss the benefit and challenged of m-learning. These models ignored the quality factors that
could participate to successful use and implementation of m-learning in higher education institutes.
However, there is a shortage of researches that considering the technical quality of m-learning
application services. Therefore, this study aims to propose a model of technical quality factors that
enhance m-learning application services, and to examine which of technical quality factors that
have the most affect and contribute to the use and implementation of m-learning services in higher
education environment. In addition, the data analysis in pervious researches utilized descriptive or
multiple regression analysis to test the model designed or to evaluate the effectiveness of model factors
through comparative studies with current m-learning platforms. The data analysis in this research
utilize the data mining techniques that give more accurate results.
TECHNICAL QUALITY FACTORS
A model of technical quality factors was derived from literature review and developed based on
software quality of m-learning applications (Almaiah et al., 2016; Al-Mushasha & Hassan, 2009;
Sarrab et al., 2016). The model addresses the most common and theoretical technical aspects of
m-learning application services, such as content usefulness, scalability, security, functionality,
accessibility, interface design, interactivity, reliability, availability, rust, responsiveness, and
personalization. Figure 1 illustrates the model.
3International Journal of Information and Communication Technology Education
Volume 17 • Issue 4 • October-December 2021
Table (1) explains the related m-learning applications features for every technical factor and
supporting references. These features are suggested from previous literature studies that explored
mobile application software quality.
RESEARCH METHODOLOGY
This study utilized a quantitative questionnaire method to explore technical factors that enhance
m-learning services. The questionnaire was designed from previous work to capture university
students’ feedback about the technical factor proposed in the model (Figure 1). The questionnaire
contains questions about students’ demographic information, and 33 items measuring 12 constructs.
The questionnaire was distributed to undergraduate students in the Faculty of Computer Science
and Information Technology and the Faculty of Engineering, Jerash University. Students from
different classes were invited to participate and complete the questionnaire in their class. A brief
description about the study objectives and a definition of m-learning and its services were given by
the researcher before students started answering the questionnaire. A total number of 151 responses
were obtained. After the data were collected, a pre-processing of the data was conducting including
data cleaning and data conversion. The next step was data set analysis using descriptive analysis and
data mining techniques (simple K-means, expectation–maximization (EM), Apriori Association
Algorithm and Multilayer Perceptron (MLP). finally, results representation. Figure 2 explain the
object process diagram.
Figure 1. Proposed technical factors model
4International Journal of Information and Communication Technology Education
Volume 17 • Issue 4 • October-December 2021
Table 1. Proposed model factors and related m-learning applications features
Technical factor Related m-learning applications features Reference
Content Usefulness Up-to-date, accurate content, that fits users’ needs, including Almaiah et al. (2016)
multimedia and collaborative content.
Scalability Ability to accommodate and adapt changes made to the application, Wingkvist (2009)
ability to handle multiple types of contents and large number of users.
Security Keeping data confidentially, with integrity and privacy. Implementing Sarrab et al. (2016)
authentication and authorization.
Functionality Suitability, compliance, accuracy, interoperability, privacy, easy Almaiah et al. (2016),
navigation. Sarrab et al. (2016)
Accessibility Ability to download files, upload files, easy access to learning Almaiah et al. (2016)
materials and services using 3G, 4G, and Wi-Fi.
Interface Design Ease of use, attractive interface, user satisfaction, attractivity, Almaiah et al. (2016),
learnability, user-friendly, consistency for different platforms. Sarrab et al. (2016)
Interactivity Sharing learning content with students and lecturers, discussing and Almaiah et al. (2016)
collaborative learning among learning community.
Reliability Perform its function and operation without failure; high processing, Sarrab et al.
performance, and accuracy; robustness, recoverability, and maturity. (2016)
Availability Provide learning content and services anytime, anywhere. Almaiah et al. (2016)
Trust Safe transaction, trust services, security features. Al-Mushasha and
Hassan (2009),
Almaiah et al. (2016)
Responsiveness Immediate response, assist users all the time, prompt services, reduce Almaiah et al. (2016),
loading. Sarrab et al. (2016)
Personalization Control learning, personalized message, record performance. Almaiah et al. (2016)
DATA ANALYSIS RESULTS
The data analysis method for this research consists of two steps. Step one was conducted using
descriptive analysis to find the mean, standard deviation and reliability for all items using SPPS 16.
Step two utilizing data mining techniques applied on WEKA.
Descriptive Analysis
Table (2) represents participants’ demographic data, including their gender, age, subject, kinds of
mobile devices, and usability of m-learning. Table (3) shows the mean, standard deviation, and
Cronbach’s alpha for all attributes. Cronbach’s alpha test was conducted to check the reliability of the
measured data. The coefficients ranged between 0.70 and 0.80, indicating acceptability (De Vellis,
2003; Sekaran, 2003).
Applied Techniques
Step two of Data Analysis was performed using data mining techniques applied on WEKA. Three data
mining techniques provided by WEKA were used to analyze the data, as they are most suitable for our
case: clustering, classification and association Rules. Clustering algorithms are simple K-means and
expectation–maximization (EM). The classification algorithm utilized multilayer perceptron (MLP)
while the association rules generate a set of rules using the Apriori algorithm.
5International Journal of Information and Communication Technology Education
Volume 17 • Issue 4 • October-December 2021
Figure 2. Object process diagram
Clustering is an unsupervised learning technique which provides the ability of grouping data in
order to find the frequent patterns from our dataset. With clustering there are no class attributes in
the data. Clustering thus helps us determining the class attributes from our dataset.
To compare the performance of the EM and K-means algorithms, our data were analyzed using
the experimental clustering for all attributes. To compare the performance of K-means and EM, the
same data were applied using the WEKA machine learning program.
Experimental Setup
This research conducted preliminary experiments to determine the suitable configuration of the
classification and clustering methods for a proper data analysis. At first, it is implemented with its
default parameter settings. Then, its parameter values are carefully tuned to obtain the desired results.
Using Weka version 3.6, experiments are conducted on a Windows 10 machine with Core i5 processor
and 4 GB of RAM. Table 4 shows the parameter settings for the K-means, EM, Apriori and MLP.
K-Means Clustering
The K-means clustering algorithm is effective, simple and easy to implement. Also, it is easy to
interpret the clustering results. It can be considered as fast and efficient algorithm in terms of
computational cost. Table 5 shows the outcomes of the simple K-means clustering algorithm applied
to our dataset.
Based on Table 5, all the 151 items are clustered into 5 different clusters using a simple K-means
clustering algorithm. The table tells us how each cluster comes together, with a “1” meaning everyone
in that cluster shares the same value of one, and a “0” meaning everyone in that cluster has a value of
zero for that attribute. Numbers are the average value of instances in the cluster. Each cluster shows
us a type of preferences for the students, from which the following conclusions are drawn:
• Cluster 0 (18% of instances): this group comprises 23 year-old male Mathematics students using
Samsung mobile devices. They mostly strongly agree with all services provided in m-learning,
except they are neutral concerning the trust and availability of services.
6International Journal of Information and Communication Technology Education
Volume 17 • Issue 4 • October-December 2021
Table 2. Participants’ characteristics
Characteristic Frequency Percent Cumulative percent
Gender
Female 69 45.7 45.7
Male 82 54.3 100
Age
19-21 56 37.1 37.1
22-25 78 51.6 88.7
Over 25 17 11.3 100
Subject
CIS 18 11.9 11.9
Civil Engineering 17 11.3 23.2
CS 75 49.7 72.8
Math 9 6.0 78.8
Computer Network 32 21.2 100
Mobile device
Huawei 66 43.7 43.7
iPhone 41 27.2 70.9
Nokia 2 1.3 72.2
Samsung 3 25.2 97.4
Sony 4 2.6 100
Use of m-learning
Yes 144 95.4 95.4
No 7 4.6 100
Internet plan
Yes 142 94.0 94.0
No 9 6.0 100
Years of using m-learning
Less than 1 year 15 9.9 9.9
1-3 years 45 29.8 39.7
3-5 years 91 60.3 100
• Cluster 1 (32%): this group comprises 23 year-old female Computer Science students who use
Huawei mobile devices. They mostly strongly agree with all services provided in m-learning.
• Cluster 2 (19%): this group comprises 21 year-old female students of Computer Science who use
iPhone mobile devices. They mostly strongly agree with all services provided in m-learning.
• Cluster 3 (13%): this group is relatively small, and it is not statistically relevant nor significantly
affecting the analysis, but it can be useful in supporting some factors (e.g. personalization and
7International Journal of Information and Communication Technology Education
Volume 17 • Issue 4 • October-December 2021
Table 3. Mean, standard deviation, and Cronbach’s alpha for all attributes
Factors Items Mean Std Cronbach’s
Deviation Alpha
CU1 4.2583 0.82027 0.764
Contents Usefulness CU2 4.4437 0.77140
CU3 4.4967 0.72915
CU4 4.3841 0.80714
Scalability SC1 4.2185 0.82376 0.701
SC2 4.2649 0.85403
Security SE1 4.5364 0.75520 0.761
SE2 4.5033 0.72915
SE3 4.3377 0.76496
Functionality FU1 4.2119 0.87643 0.721
FU2 4.0331 0.90493
FU3 4.2318 0.83621
Accessibility ACC1 4.2848 0.85928 0.712
ACC2 4.2450 0.75690
ACC3 4.3576 0.84336
Interface Design Inerface1 4.2517 0.73229 0.702
Interface2 4.2781 0.74975
Interface3 4.4238 0.78687
Interactivity Interactivity1 4.2781 0.80960 0.726
Iinteractivity2 4.3841 0.80714
Reliability RE1 4.4503 0.75444 0.713
RE2 4.5033 0.68190
Availability AV1 4.2119 0.92815 0.710
AV2 4.2384 0.87718
Trust TR1 4.3709 0.81335 0.755
TR2 4.3510 0.74116
TR3 4.3311 0.82237
Responsiveness RESP1 4.3841 0.79884 0.723
continued on next page
8International Journal of Information and Communication Technology Education
Volume 17 • Issue 4 • October-December 2021
Table 3. Continued
Factors Items Mean Std Cronbach’s
Deviation Alpha
RESP2 4.2781 0.76732
RESP3 4.3377 0.72927
Personalization PERS1 4.3311 0.78928 0.734
PERS2 4.2583 0.84430
PERS3 4.3377 0.79906
Table 4. Experimental setup for K-means, EM, Apriori and MLP
Algorithm Parameter Value
K-means Distance function Euclidean distance
Initialization method Random
Number of clusters 5
Seed number 10
Cluster mode percentage split 66%
EM Initialization method Random
Number of clusters 5
Seed number 100
Cluster mode 10 folds cross-validation
Apriori Delta=0.05 0.05
Metric = confidence Confidence
Minimum metric .9
Number of rules 10
MLP Hidden layers number of attributes +number of
classes
Learning rate .03
Momentum .02
Epoch 100
Test mode percentage split 66%
9International Journal of Information and Communication Technology Education
Volume 17 • Issue 4 • October-December 2021
responsiveness) considered by other groups. This group comprises 20 year-old male students
of Computer Science who use Huawei mobile devices. They are mainly disappointed or neutral
with the services provided by the m-learning.
• Cluster 4 (19%): this group comprises 27 year-old Male Computer Network students who use
Samsung mobile devices. Even though they are 27 years old and used m-learning for less than a
year, they are greatly satisfied with all services provided via m-learning and totally agree with it.
Expectation–Maximization (EM) Algorithm
Table 6 (Appendix 2) shows the results of EM clustering algorithm experimental applied to our
dataset. Table 6 shows relatively similar results to the ones in Table 5, but with less quality. However,
results obtained by the EM clustering algorithm are more detailed with respect to the mean errors of
correct clustering. It provides the mean and standard deviations for each attribute value in each cluster.
Results obtained by K-means clustering algorithm used the same conditions as were set for the
EM clustering algorithm. The results showed that the processing speed of the K-means clustering (0.01
seconds) is faster than that with the EM clustering (0.06 seconds). K-means performed 5 iterations,
while the EM clustering performed 3. K-means showed a sum of squared errors within clusters about
47.8, while the EM showed a log likelihood of -30.19. Considering attributes values in the Tables
(1) and (2), K-means showed the percentage of respondents who belonged to their cluster based on
their answers (data types or scales), while the EM clustering showed the mean and standard deviation
values for each attribute.
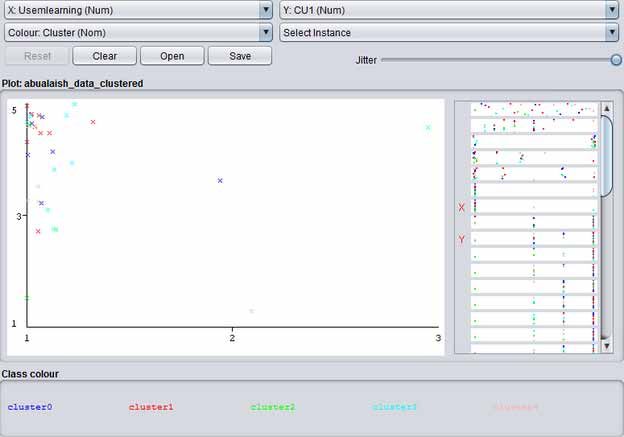
The classification accuracy of the data is 99% for the K-means, 100% accuracy was obtained by
the EM. In order to simplify the results, Figure (2) visualizes the clusters obtained by the K-means
clustering algorithm.
Taking one example from all instances, Using Mobile Learning versus Content Usefulness, it can
be seen from Figure (3) that the 5 clusters are grouped for the values of the two attributes (namely: use
m-learning as the X axis and CU1 as the Y axis), and are mainly concentrated at the top-left corner
around the scale number 5. Which indicates a strongly agree of the provided service in mobile learning.
In other words, most students are using mobile learning services due to their satisfaction with the
content Usefulness. This represents the students’ satisfaction with using m-learning frequently rather
than occasionally. This is one example, the rest of the instances show a similar degree of satisfaction,
such as: Scalability, Security, Interface Design, and Reliability.
Multilayer Perceptron (MLP)
The multilayer perceptron (MLP) is a class of feed forward artificial neural network (ANN) which
uses a supervised learning technique called back propagation algorithm for training. MLP is utilized
for classification tasks. It consists of three layers: input layer, hidden layer, and output layer. Learning
is typically based on the minimization of measurement errors between network outputs and desired
outputs.
Appling the MLP to our data sets, we found that scalability factor including SC1 and SC2 has
a high accuracy of 99.33% (the highest accuracy rate in comparison with other factors). This result
revealed that the scalability factor of m-learning application affects student satisfaction with m-learning
application services. Table 6 shows the results obtained from multilayer perceptron algorithm.
Confusion Matrix
a b classified as
0 139 a=yes
11 1 b=no
10International Journal of Information and Communication Technology Education
Volume 17 • Issue 4 • October-December 2021
Table 5. K-means clustering algorithm experimental results (final cluster centroids) *
Initial starting points (random):
Cluster 0:
23,M,MATH,SAM,1,1,3,4,4,5,5,5,4,5,5,5,5,4,5,5,5,3,5,5,5,4,5,5,5,3,3,3,4,5,5,4,4,5,5,5
Cluster 1:
23,F,CS,HU,1,1,3,5,4,4,5,4,5,4,5,4,5,4,5,4,5,4,4,4,4,4,4,4,4,4,5,4,4,5,4,5,5,5,5,5
Cluster 2:
21,F,CS,IPHONE,1,1,2,5,5,5,5,4,5,5,5,5,4,4,4,4,3,5,5,4,4,4,5,5,5,5,5,5,4,5,5,5,4,5,5,5
Cluster 3:
20,M,CS,HU,1,2,1,5,3,4,3,4,2,4,3,3,3,3,4,2,3,4,5,3,3,3,5,3,4,2,3,2,3,3,2,4,5,4,3,5
Cluster 4:
27,M,NET,SAM,1,1,1,5,5,5,5,5,5,5,5,5,4,4,4,5,5,5,5,5,5,5,5,5,5,5,4,5,5,5,5,5,5,5,5,5
Final Cluster Centroids:
Cluster#
Attribute Full Data 0 01 2 3 4
(151.0) (27.0) (49.0) (28.0) (19.0) (28.0)
Age 22.8079 22.5185 22.7755 23.1071 22.3684 23.1429
Gender M M F F M M
Subject CS CS CS CS CS NET
Mobiledevice HU SAM HI IPHONE HU SAM
Internetplan 105.96 1.1111 1.0816 1 1.0526 1.0357
Usemlearning 1.1126 1.037 1.0816 1.0357 1.1579 1.2857
Yearsmlearning 2.5033 2.4444 2.6939 2.2857 2.0526 2.75
CU1 4.245 4.2593 4.4082 4.2857 3.2105 4.6071
CU2 4.4305 4.4444 4.5306 4.6786 3.4211 4.6786
CU3 4.4834 4.3704 4.5714 4.7143 3.4737 4.8929
CU4 4.3709 4.2222 4.5306 4.2857 3.4737 4.9286
SC1 4.2053 3.7778 4.4286 4.3214 3.2632 4.75
SC2 4.2517 3.8148 4.4896 4.5 3.4211 4.5714
SE1 4.5232 4.4074 4.4694 4.9286 3.5789 4.9643
SE2 4.4901 4.5185 4.6327 4.6701 3.3684 4.8571
SE3 4.3245 4.2963 4.449 4.4643 3.4211 4.6071
FU1 4.1987 4 4.3265 4.4286 3.0526 4.7143
FU2 4.0199 3.7037 4.3265 3.9286 3.0526 4.5357
FU3 4.2185 4.1481 4.3469 4.3929 2.8947 4.7857
ACC1 4.1854 4.2222 4.4286 4.5 3.1579 4.1071
ACC2 4.2119 3.963 4.4082 4.3571 3.4737 4.4643
ACC3 4.2781 3.8889 4.4286 4.6429 3.1579 4.7857
Interaface1 4.2384 4.1111 4.2041 4.5714 3.5263 4.5714
Interface2 4.2649 4.0741 4.3265 4.6071 3.3158 4.6429
Interface3 4.4106 4.5556 4.449 4.75 3.2105 4.6786
continued on next page
11International Journal of Information and Communication Technology Education Volume 17 • Issue 4 • October-December 2021 Table 5. Continued Initial starting points (random): Interactivity1 4.2649 4.1111 4.3061 4.5714 3.3158 4.6786 Interactivity2 4.3709 4.4444 4.5102 4.4286 3.0526 4.8929 RE1 4.4371 4.2593 4.6735 4.75 3.0526 4.8214 RE2 4.4768 4.4815 4.4694 4.7143 3.4737 4.9286 AV1 4.2252 4.1852 4.3061 4.6071 3.2105 4.4286 AV2 4.2384 3.8519 4.449 4.5357 3.2632 4.6071 TR1 4.3709 4.1481 4.551 4.6071 3.0526 4.9286 TR2 4.3377 4.1481 4.5306 4.4286 3.4211 4.7143 TR3 4.3311 4.1111 4.5714 4.4643 3.2105 4.75 RESP1 4.3841 4.2963 4.5714 4.4643 3.2632 4.8214 RESP2 4.2781 3.9259 4.3878 4.5 3.5263 4.7143 RESP3 4.3377 4.037 4.2857 4.5714 3.7895 4.8571 PERS1 4.3311 4 4.551 4.4286 3.4737 4.75 PERS2 4.2583 4.0741 4.4898 4.25 3.3684 4.6429 PERS3 4.3377 3.963 4.4694 4.5 3.7368 4.7143 Cluttered Instances 0 27 (18%) 1 49 (32%) 2 28 (19%) 3 19 (13%) 4 28 (19%) Figure 3. A visualization of results obtained by the K-means clustering algorithm for 2 instances 12
International Journal of Information and Communication Technology Education
                                                                       Volume 17 • Issue 4 • October-December 2021

Apriori Association Algorithm
The Apriori association algorithm is implemented for a more detailed relationship between instances.
For example, it identifies the instances (services) that affect student satisfaction with mobile learning.
Three sets of rules are produced, with a minimum support of 55% of the instances, and confidence
greater than 90%. These rulesets are 15 items, 18 items, and 3 items.
     The best rules found are:

1.  Interface3=5 88 ==> Use m-learning=1 87 		                         lift:(1.07) lev:(0.04)
    [5] conv:(3.5)
2. Use m-learning=1 SE1=5 96 ==> internet plan=1 94                    lift:(1.04) lev:(0.02)
    [3] conv:(1.91)
3. Use ml earning=1 SE2=5 91 ==> internet plan=1 89                     lift:(1.04) lev:(0.02)
    [3] conv:(1.81)
4. SE1=5 102 ==> internet plan=1 99 			                                lift:(1.03) lev:(0.02)
    [3] conv:(1.52)
5. SE2=5 95 ==> internet plan=1 92 			                                 lift:(1.03) lev:(0.02)
    [2] conv:(1.42)
6. internet plan=1 SE2=5 92 ==> Use m-learning=1 89                    lift:(1.05) lev:(0.03)
    [4] conv:(1.83)
7. SE2=5 95 ==> Use m-learning=1 91 			                                lift:(1.04) lev:(0.02)
    [3] conv:(1.51)
8. CU2=5 89 ==> Use m-learning=1 85			                                  lift:(1.04) lev:(0.02)
    [3] conv:(1.41)
9. Use m-learning=1 139 ==> internet plan=1 132                        lift:(1.01) lev:(0.01)
    [1] conv:(1.04)
10. internet plan=1 SE1=5 99 ==> Use m-learning=1 94                   lift:(1.03) lev:(0.02)
    [2] conv:(1.31)

     It can be seen that, for example rule number 10, 94 students are willing to use m-learning if they
have an internet plan and are totally satisfied with the security service. The factor Use m-learning
showed a significant level of importance for 139 students in rule number 9. In nine rules, using mobile
learning (Use m-learning) is totally dependent on the Security service, and in one rule the Content
Quality plays a role in using mobile learning. It is worth mentioning that the security factor has been
heavily considered by students (95 strongly agreed students), which is presented in rules number 4,
5, and 7 as a major independent factor, especially the SE2 factor (privacy and confidentiality), which
appeared in 2 rules with a high confidence of 97%. SE1 and SE2 factors were presented in rules 2,
3, 6, and 10 as dependent factors upon the internet plan and Use m-learning factors. In addition, the
factor SE1 factor appearing in rule number 4 has the majority of students (102 students out of 151)
preferring secure credentials over others. Overall, it can be concluded that the factors SE1 and SE2
have the greatest impact on satisfying students’ needs in using m-learning (Use m-learning).

DISCUSSION

This study has presented a data mining technique to investigate the quality factors of m-learning
applications services that support learning and teaching in higher education institutes. The researcher
proposed a quality factors model that aims to blending all technical aspects of m-learning services
that might affect student’s satisfaction with m-learning services. The first part of data analysis was
conducted using descriptive statistics. The results revealed that all factors suggested by the proposed
model have positive affect on student’s satisfaction with m-learning applications services. Table 3

                                                                                                               13
International Journal of Information and Communication Technology Education
Volume 17 • Issue 4 • October-December 2021
Table 6. Multilayer perceptron algorithms results
Detailed Accuracy by class
Weighted Avg TP Rate FP Rate Precision Recall F-measure MCC Roc Area PRC
0.992 0.954 0.954 0.991 1.000 0.993 0.083 1.000
0.926 0.943 0.954 0.957 0.917 1.000 0.000 0.917
0.987 0.943 0.954 0.993 0.993 0.993 0.077 0.993
shows that all questionnaire items have a mean ranged between 4.03 and 4.53 which falls between
‘agree’ and ‘strongly agree’ and indicated that the participants had agreed thoughts regarding to the
model factors. This result similar with results obtained by previous researches (Almaiah et al. (2016);
Sarrab et al. (2106)).
The second part of data analysis was conducted using data mining techniques applied on WEKA.
In first step the researcher performed analysis with two clustering techniques/algorithms, namely
k-mean and EM (Dey et al., 2019) in order to identify groups of items that may have a significant
impact on the satisfaction of students in using or relying on mobile technology as an assistant tool for
learning. Both algorithms indicated the importance of the “Security” factor as a critical component
in designing a successful / preferred m-learning application. Both algorithms were implemented to
support each other in their indication of some factor of interest. Upon our preliminary experiments,
one clustering algorithm was not enough to determine a significant factor (e.g. K-means) with 99%
accuracy. Therefore, another clustering algorithm (e.g. EM) was implemented to support the grouping
generated by k-means. It is clearly that EM has obtained a higher accuracy (100%) than the K-means.
Hence, proceeding with the generated grouping (security factor) to the next data mining technique.
Then, the second step, a classification algorithm (namely, MLP) was implemented to predict
a descriptive model of the grouping generated by the clustering algorithms in first step. However,
this classification step has further indicated the significance of the “scalability” factor with a high
F-measure (0.91) and a high (0.99) model accuracy. So, two significant factors are now considered
for the third step. In the third step, the association rules algorithm (Apriori) was employed to predict
a set of rules driven from the classification or rather the description (generated in step two) of the
grouped factors from step one. Apriori has generated 10 sequences of rules that again support the
significance of the “security” factor. Consecutively, these 3 steps recommended potential design
components for learners based on the predefined factors. The employed algorithms in this proposed
model are not to compete for accuracy; they are employed sequentially in order to come out with the
best recommendation.
Since it is well known that data mining techniques are capable of discovering patterns and groups
of potential data, such as students/learners’ preferences or design factors that impact a successful
development of m-learning applications. This study highlights model for applying data mining in
m-learning to determine its potential.
Based on that, it is required to link learners’ preferences and the design components of a preferable
development of m-learning applications. Hence, using data mining views a multidimensional
perspective. This might lead to a better decision such as, what is the best configuration of designing a
successful m-learning application, what are the critical components/requirements that hinder/support
the success of m-learning applications, or even that hinder/support learners interacting effectively
with the application. In general, data mining techniques are to discover patterns/factors that have the
potential to become an actual application.
The research results focusing on security and scalability factors because they have highest
impact on student’s satisfaction with m-learning services. Students need m-learning applications that
keep user’s data confidentially and privacy. Also, has ability to accommodate changes made to the
14International Journal of Information and Communication Technology Education
Volume 17 • Issue 4 • October-December 2021
application and ability to handle multiple types of contents and large number of users (Sarrab et al.,
2016). In addition, the factors that suggestions by the proposed model will enhance the implementation
of mobile learning through improving learning performance and learning contexts (Garcia-Cabot
et al., 2015).
Contribution and Benefit of Research Outcomes
There is a lake of researches that investigated the technical aspects of m-learning applications services.
This research added value to the previous literature in mobile learning applications services through
designing a model of technical quality factors that enhanced this technology in universities teaching
and learning methods. The results indicate that students consider security and scalability are the most
important services that should m-learning applications provide. This result gives an important insight
for people who designing and developing m-learning applications.
Security should be considered while designing m-learning applications; m-learning applications
have to protect data and implement control over authentication, authorization and sharing contents.
Students worried about losing confidential information, stop having privacy, change of learning
quality and authorized users’ access learning contents. Lecturers also concerned about control over
e-examinations. Therefore m-learning designers should integrate some security technologies in
m-learning applications. This includes access control mechanisms, firewalls, anti-viruses, digital
identity to each users, authentication and authorization.
Furthermore, scalability is other factor that needs to be integrated with m-learning applications.
M-learning applications should have ability to handle and manage a large number of data and allowed
a large number of users to access applications from different locations at the same time. M-learning
applications need to be refined and extended in order to outfit different needs and complex issues. In
addition, m-learning applications should have a suitable graphical user interface that can be modified
to integrate newly features.
CONCLUSION
Overall, the results of this research reveal that all of the quality factors have a positive effect on
student satisfaction with m-learning application services. Furthermore, these factors meet students’
needs and requirements to implement this tool within the learning process. Security and scalability
factors were discovered to be a quality aspect that has the highest impact on student satisfaction with
m-learning application services. The classification accuracy of the data is 99% for the K-means, while
100% accuracy was obtained by the EM for the “security” factor, and 99.33% accuracy was achieved
by the MLP for the “scalability” factor.
This research provides empirical support for discovering the guidelines and instructions to design
and develop high-quality m-learning applications. Designers should consider all technical factors
in the proposed model with more attention to security and scalability factors while designing and
developing m-learning applications.
This study is limited to university students more researches for universities lecturers are highly
needed to evaluate the model proposed. Also, there is a difficulty to compare the study results with
similar research due to the lake of researches in technical aspect of m-learning quality services that
utilized same data mining techniques. Furthermore, the data analysis of this study limited to some
technical data mining algorithms, Next researches should use other algorithms with high performance.
Future work might aim to investigate the feasibility of model components on different mobile learning
applications, and additional work is needed to integrate more nontechnical factors in the model,
including teaching pedagogy, learning approach, and management support.
15International Journal of Information and Communication Technology Education Volume 17 • Issue 4 • October-December 2021 REFERENCES Abu-Al-Aish, A., & Love, S. (2013). Factors influencing students’ acceptance of M-learning: An investigation in higher education. International Review of Research in Open and Distance Learning, 14(5), 82–107. doi:10.19173/ irrodl.v14i5.1631 Al-Mushasha, N., & Shahizan, H. (2009). A model for mobile learning service quality in university environment. International Journal of Mobile Computing and Multimedia Communications, 1(1), 70–91. doi:10.4018/ jmcmc.2009010105 Ali, A., Ouda, A., & Capretz, L. F. (2012). A Conceptual Framework for Measuring the Quality Aspects of Mobile Learning. Bulletin of the IEEE Technical Committee on Learning Technology, 14(4), 31–34. Almaiah, M.A., Jalil, M.A. & Man, M. (2016). Empirical investigation to explore factors that achieve high quality of mobile learning system based on students’ perspectives. Engineering Science and Technology, an International Journal, 19(3), 1314-1320. Almarashdeh, I. A., Sahari, N., Zin, N. A. M., & Alsmadi, M. (2010). The success of learning management system among distance learners in Malaysian Universities. Journal of Theoretical and Applied Information Technology, 21(2), 80–91. Alnabhan, M., Abu-Al-Aish, A., & Al-Masaeed, S. A. (2018). Collaborative and ubiquitous mobile learning system prototype. International Journal of Computer Applications in Technology, 58(4), 296–307. doi:10.1504/ IJCAT.2018.095939 Benhamida, V., Bouallouche-Medjkoune, L., Aı¨ssani, D., & Lafifi, Y. (2017). Improving the Quality of Mobile Learning Services. Wireless Personal Communications, 97(4), 5305–5324. doi:10.1007/s11277-017-4780-4 De Vellis, R. F. (2003). Scale Development: Theory and Applications. Sage Publications. DeLone, W. H., & McLean, E. R. (2003). The DeLone and McLean model of information systems success:A ten- year update. Journal of Management Information Systems, 19(4), 9–30. doi:10.1080/07421222.2003.11045748 Dey, N., Wagh, S., Mahalle, P. N., & Pathan, M. S. (Eds.). (2019). Applied machine learning for smart data analysis. CRC Press. doi:10.1201/9780429440953 Drigas, A. S., & Pappas, M. A. (2015). A Review of Mobile Learning Applications for Mathematics. International Journal of Interactive Mobile Technologies, 9(3), 18–23. doi:10.3991/ijim.v9i3.4420 Garcia-Cabot, A., de-Marcos, L., & Garcia-Lopez, E. (2015). An empirical study on m-learning adaptation: Learning performance and learning contexts. Computers & Education, 82, 450–459. doi:10.1016/j. compedu.2014.12.007 Giannakoulas, A., & Xinogalos, S. (2018). A pilot study on the effectiveness and acceptance of an educational game for teaching programming concepts to primary school students. Education and Information Technologies, 23(5), 2029–2052. doi:10.1007/s10639-018-9702-x Glood, S. H., & Hussein, R. M., & Abduladheem, W. (2018). The Effects of Information Quality, Service Quality, And Combatability On Continue Use of m-learning Among Students in the Public Universities of Iraqi. Journal of Theoretical and Applied Information Technology, 96(12), 3739–3755. Guo, S. H. M., Chong, P. P., & Chang, H. K. (2007). Mobile learning in nursing practical learning: An applicability analysis. International Journal of Mobile Learning and Organization, 1(4), 342–354. doi:10.1504/ IJMLO.2007.016175 Hsu, T.-Y., Chiou, C.-K., Tseng, J., & Hwang, G.-J. (2016). Development and evaluation of an active learning support system for context-aware ubiquitous learning. IEEE Transactions on Learning Technologies, 9(1), 37–45. doi:10.1109/TLT.2015.2439683 Huang, C. S. J., Yang, S. J. H., Chiang, T. H. C., & Su, A. Y. S. (2016). Effects of Situated Mobile Learning Approach on Learning Motivation and Performance of EFL Students. Journal of Educational Technology & Society, 19(1), 263–276. 16
International Journal of Information and Communication Technology Education
                                                                         Volume 17 • Issue 4 • October-December 2021

Hung, P. H., Hwang, G. J., Lee, Y. H., Wu, T. H., Vogel, B., Milrad, M., & Johansson, E. (2014). A problem-based
ubiquitous learning approach to improving the questioning abilities of elementary school students’. Journal of
Educational Technology & Society, 17(4), 316–334.
John, S., & Rani, M. S. (2015). Teaching java programming on smartphone-pedagogy and innovation; proposal
of its ontology oriented implementation. Procedia: Social and Behavioral Sciences, 176, 787–794. doi:10.1016/j.
sbspro.2015.01.541
Jones, A., Issroff, K., Scanlon, E., Clough, G., McAndrew, P., & Blake, C. (2006). Using mobile devices for
learning in informal settings: is it motivating? In Proceedings of IADIS International Conference on Mobile
Learning. IADIS Press.
Kim, G. M., & Ong, S. M. (2005). An exploratory study of factors influencing m-learning success. Journal of
Computer Information Systems, 46(1), 92–97.
Liu, Y., Li, H., & Carlsson, C. (2010). Factors driving the adoption of m-learning: An empirical study. Computers
& Education, 55(3), 1211–1219. doi:10.1016/j.compedu.2010.05.018
Motiwalla, L. F. (2007). Mobile learning: A framework and evaluation. Computer Education, 49(3), 581–596.
doi:10.1016/j.compedu.2005.10.011
Oyelere, S. S., & Suhonen, J. (2016). Design and implementation of MobileEdu m-learning application for
computing education in Nigeria: A design research approach. Proceedings of Fourth International Conference
on Learning and Teaching in Computing and Engineering, 27–31. doi:10.1109/LaTiCE.2016.3
Oyelere, S. S., Suhonen, J., Wajiga, G. M., & Sutinen, E. (2018). Design, development, and evaluation of a
mobile learning application for computing education. Education and Information Technologies, 23(1), 467–495.
doi:10.1007/s10639-017-9613-2
Sarrab, M., Alalwan, N., Alfarraj, O., & Alzahran, A. (2015). An empirical study on cloud computing requirements
for better mobile learning services. International Journal of Mobile Learning and Organisation, 9(1), 1–20.
doi:10.1504/IJMLO.2015.069709
Sarrab, M., Elbasir, M., & Alnaeli, S. (2016). Towards a quality model of technical aspects for mobile learning
services: An empirical investigation. Computers in Human Behavior, 55, 100–112. doi:10.1016/j.chb.2015.09.003
Sekaran, U. (2003). Research Methods for Business: A Skill-Building Approach. John Wiley & Sons.
Traxler, J. (2009). Learning in a mobile age. International Journal of Mobile and Blended Learning, 1(1), 1–12.
doi:10.4018/jmbl.2009010101
Troussas, C., Virvou, M., & Alepis, E. (2014). Collaborative learning: Group interaction in an intelligent
mobile-assisted multiple language learning system. Informatics in Education, 13(2), 279–292. doi:10.15388/
infedu.2014.17
Venkatesh, V., Morris, M. G., Davis, G. B., & Davis, F. D. (2003). User acceptance of information technology:
Toward a unified view. Management Information Systems Quarterly, 27(3), 425–478. doi:10.2307/30036540
Virtanen, M. A., Elina Haavisto, E., Eeva Liikanen, E., & Kääriäinen, M. (2018). Ubiquitous learning
environments in higher education: A scoping literature review. Education and Information Technologies, 23(2),
985–998. doi:10.1007/s10639-017-9646-6
Wang, H. Y., Liu, G. Z., & Hwang, G. J. (2016). Integrating sociocultural contexts and location based systems for
ubiquitous language learning in museums: A state of the art review of 2009–2014. British Journal of Educational
Technology, 48(2), 653–671. doi:10.1111/bjet.12424
Wingkvist, A. (2009). Understanding scalability and sustainability in mobile learning: A systems development
framework. Vaxjo University Press.
Wu, P.-H., Hwang, G.-J., Su, L.-H., & Huang, Y.-M. (2012). A context-aware mobile learning system for
supporting cognitive apprenticeships in nursing skills training. Journal of Educational Technology & Society,
15(1), 223–236.

                                                                                                                 17
International Journal of Information and Communication Technology Education
Volume 17 • Issue 4 • October-December 2021
Appendix 1: Questionnaire
Age: Gender: Subject and level:
1. What kind of mobile device you have: .........................................
2. Do you have a mobile internet package plan? 1. Yes 2. No
Explain your connection type and speed……………………………………………..
3. Do you use m-learning in your studies? 1. Yes 2. No
4. Years of using m-learning
1. less than 1 year 2. 1-3 years 3. 3-5 years
On a scale of 1 to 5, indicate with an û how strongly you agree or disagree with each of the following
statements.
Rating Scale
1 2 3 4 5
Strongly Disagree Disagree Neutral Agree Strongly Agree
1 2 3 4 5
Content quality
CU1 It is important for m-learning applications to provide will-aimed content.
CU2 It is important for m-learning applications to provide text, audio and video content
CU3 It is important for m-learning applications to provide up-to-date content.
CU4 It is important for m-learning applications to provide content that meets learners’ needs.
Scalability
SC1 It important for m-learning applications to handle multiple types of content with a large amount of information
and features.
SC2 M-learning applications should handle the increasing number of users who want to access the application at the
same time.
Security
SE1 M-learning applications should secure learners’ username and password across its servers.
SE2 It is important for m-learning applications to maintain the privacy and confidentiality of data stored and
transferred for educational process.
SE3 Recent security technologies that protect learners’ information, access, and communication should be integrated
with m-learning applications.
Functionality
FU1 It is important for m-learning applications to be compatible with different platforms (Android, IOS).
FU2 M-learning applications should have a search engine that facilitates searching for specific functions.
FU3 M-learning application interfaces should provide a good size and resolution.
Accessibility
ACC1 M-learning applications should offer the ability to up-load and download attachment files.
ACC2 M-learning applications should allow students and lecturers to access and submit learning content in multiple
formats.
ACC3 M-learning applications should allow accessing learning materials and services by using 3G,4G, WiFi, and
offline
Interface design
continued on next page
18International Journal of Information and Communication Technology Education
Volume 17 • Issue 4 • October-December 2021
Rating Scale Continued
1 2 3 4 5
Strongly Disagree Disagree Neutral Agree Strongly Agree
Inerface1 It is important for m-learning applications to provide attractive interface, including graphics, animation, and
colors).
Interface2 It is important for m-learning applications to provide good icons and menu designs.
Interface3 It is important for m-learning applications to provide good page layout.
Interactivity (IN)
Interactivity1 M-learning applications should allow learners to interact with their colleges and instructors via online messages.
Ineractivity2 M-learning applications should make it easy to share and exchange learning contents among the learning
community
Reliability
RE1 M-learning applications should be reliable, with high performance and accuracy, battery life, and processing
power.
RE2 It is important for m-learning applications to overcome issues like software fault and crash frequency.
Availability
AV1 M-learning applications should provide learning materials and services anywhere
AV2 M-learning applications should provide learning materials and services anytime.
Trust
TR1 M-learning applications should provide safe and trustworthy transactions.
TR2 M-learning applications should keep students’ personal data in confidence.
TR3 M-learning applications should provide secure features.
Responsiveness
RESP1 It is important for m-learning applications to provide learners with quick services
RESP2 M-learning applications need to assist learners all the time they use it.
RESP3 M-learning applications have to provide learners with feedback that responds to their needs.
Personalization
PERS1 It is important for m-learning applications to enable learners to choose how they want to learn.
PERS2 It is important for m-learning applications to allow learners to learn the content they prefer.
PERS3 It is important for m-learning applications to enable learners to control their learning process.
19International Journal of Information and Communication Technology Education
Volume 17 • Issue 4 • October-December 2021
Appendix 2:
Table 7. EM clustering algorithm experimental results
Cluster
Attribute 0 1 2 3 4
(0.23) (0.23) (0.3) (0.12) (0.11)
Age
Mean 23.3776 24.1333 21.2532 22.6569 23.2455
Std. dev. 2.9625 2.9875 1.4057 2.8198 0.9899
Gender
F 21.2116 11 32.1599 6.0039 3.6246
M 15.6321 26.1067 15.4194 14.7415 15.1003
[total] 36.8436 37.1068 47.5793 20.7454 18.7249
subject
CS 21.3041 17.1068 19.1749 10.0032 12.411
CIVIL 2.0575 9 5.0963 2.6183 3.228
NET 11.5732 7 10.4685 6.9073 1.051
CIS 1.9304 6 9.8255 3.2167 2.0274
MATH 2.9784 1 6.014 1 3.0075
[total] 39.8436 40.1068 50.5793 23.7454 21.7249
Mobile device
HU 6.9478 17.1067 32.2439 12.7426 1.959
SAM 9.941 10 8.3061 2.0002 12.7526
SONY 2.9968 1 2.9904 1 1.0128
IPHONE 18.9581 10 6.0387 7.0026 4.0005
NOKIA 1 2 1.0001 1 1.9999
[total] 39.8436 40.1068 50.5793 23.7454 21.7249
Internet plan
Mean 1.0861 1.2279 1.0552 1.155 1.0347
Std. dev. 0.0406 0 0.3308 0.2247 0.3408
Use mlearning
mean 1.0861 1.2279 1.0552 1.155 1.0347
Std. dev. 0.2805 0.6355 0.2887 0.3619 0.2607
Years mlearning
Mean 2.3761 2.9115 2.3461 2.0647 2.8314
Std. dev. 0.7245 0.284 0.6657 0.7709 0.3744
CU1
Mean 4.4957 4.7091 4.036 3.163 4.5313
Std. dev. 0.5494 0.5712 0.7577 1.0582 0.586
CU2
Mean 4.678 4.7721 4.2754 3.5529 4.6038
continued on next page
20International Journal of Information and Communication Technology Education
Volume 17 • Issue 4 • October-December 2021
Table 7. Continued
Cluster
Std. dev. 0.5243 0.5384 0.7424 1.2194 0.4891
CU3
mean 4.6571 4.94 4.3611 3.511 4.5867
Std. dev. 0.4749 0.2375 0.7907 0.9896 0.602
CU4
Mean 4.4862 4.943 4.0722 3.4132 4.8168
Std. dev. 0.7328 0.2318 0.7703 1.0469 0.3869
SC1
Mean 4.3934 4.7691 3.9741 3.2315 4.3515
Std. dev. 0.6453 0.4214 0.8291 0.9736 0.6842
SC2
Mean 4.5898 4.6012 4.2079 3.4882 3.7886
Std. dev. 0.4988 0.5947 0.9463 1.031 0.9061
SE1
mean 4.6164 5 4.4766 3.6064 4.4825
Std. dev. 0.643 0.7986 0.743 1.1713 0.6098
SE2
Mean 4.5414 4.9145 4.63 3.4462 4.2808
Std. dev. 0.6483 0.2796 0.4828 1.1285 0.749
SE3
Mean 4.5902 4.6582 4.1734 3.4463 4.4665
Std. dev. 0.6433 0.6292 0.6712 0.9765 0.6988
FU1
Mean 4.5145 4.9145 3.8435 2.8516 4.5158
Std. dev. 0.5547 0.2796 0.8204 0.7593 0.6077
FU2
Mean 4.1888 4.6297 3.9066 2.7489 4.1212
Std. dev. 0.9214 0.5892 0.7103 0.9048 0.5862
FU3
Mean 4.2287 5 4.0823 3.0613 4.2254
Std. dev. 0.5902 0.0004 0.645 1.1391 0.8101
ACC1
Mean 4.4547 4.5412 4.1107 3.2136 4.1706
Std. dev. 1.0279 1.0502 0.8183 0.9565 0.8704
ACC2
Mean 4.4584 4.6297 4.0668 3.2938 4.246
Std. dev. 0.6025 0.795 0.7479 0.8369 0.5321
ACC3
mean 4.7677 5 4.0033 3.295 3.594
continued on next page
21You can also read