Learning to Predict Page View on College Official Accounts With Quality-Aware Features
←
→
Page content transcription
If your browser does not render page correctly, please read the page content below
ORIGINAL RESEARCH
                                                                                                                                             published: 28 October 2021
                                                                                                                                        doi: 10.3389/fnins.2021.766396

                                            Learning to Predict Page View on
                                            College Official Accounts With
                                            Quality-Aware Features
                                            Yibing Yu 1,2*, Shuang Shi 3 , Yifei Wang 3 , Xinkang Lian 3 , Jing Liu 3 and Fei Lei 3
                                            1
                                             The Communist Youth League Committee, Beijing University of Technology, Beijing, China, 2 School of Economics and
                                            Management, Beijing University of Technology, Beijing, China, 3 Faculty of Information Technology, Beijing University of
                                            Technology, Beijing, China

                                            At present, most of departments in colleges have their own official accounts, which have
                                            become the primary channel for announcements and news. In the official accounts,
                                            the popularity of articles is influenced by many different factors, such as the content
                                            of articles, the aesthetics of the layout, and so on. This paper mainly studies how to
                                            learn a computational model for predicting page view on college official accounts with
                                            quality-aware features extracted from pictures. First, we built a new picture database
                                            by collecting 1,000 pictures from the official accounts of nine well-known universities in
                                            the city of Beijing. Then, we proposed a new model for predicting page view by using
                                            a selective ensemble technology to fuse three sets of quality-aware features that could
                           Edited by:       represent how a picture looks. Experimental results show that the proposed model has
                        Xiongkuo Min,
         University of Texas at Austin,     achieved competitive performance against state-of-the-art relevant models on the task
                         United States      for inferring page view from pictures on college official accounts.
                      Reviewed by:
                                            Keywords: page view, quality-aware features, selective ensemble, human visual system, college official accounts
                           Yutao Liu,
            Tsinghua University, China
                       Weiling Chen,
             Fuzhou University, China       1. INTRODUCTION
                      Qiuping Jiang,
             Ningbo University, China       With the popularization and development of the Internet, the official accounts have attracted
                  *Correspondence:
                                            extensive attention. The majority of college departments now own accounts because it has become
                            Yibing Yu       the main channel for publishing notices and posting news. Page view is a very significant indicator
                 yuyibing@bjut.edu.cn       for college official accounts, capable of visually showing the popularity of an article. If we can
                                            predict the page views, it is of great help to improve the attention of audience for articles. The
                   Specialty section:       number of views on articles is influenced by the content of pictures. To this end, we explore the
         This article was submitted to      quality-aware features of pictures and attempt to predict page views in the official accounts based
                   Perception Science,      on image processing technology in this paper.
               a section of the journal
                                               In recent years, with the development of image processing technology, there are many
            Frontiers in Neuroscience
                                            great contributions in multimedia telecommunication domain (Geng et al., 2011; Kang et al.,
         Received: 29 August 2021           2019; Moroz et al., 2019; Su et al., 2019; Wu et al., 2019; Yildirim, 2019), education
      Accepted: 27 September 2021
                                            and teaching (Richard, 1991; Greenberg et al., 1994; Rajashekar et al., 2002; Yaman and
        Published: 28 October 2021
                                            Karakose, 2016), and environmental perception and protection, such as air pollution detection
                             Citation:      (Gu et al., 2020a,c, 2021b; Liu et al., 2021), PM2.5 monitoring (Gu et al., 2019, 2021a),
Yu Y, Shi S, Wang Y, Lian X, Liu J and
                                            air quality forecast (Gu et al., 2018, 2020b), and distance education (Zheng et al., 2009).
Lei F (2021) Learning to Predict Page
    View on College Official Accounts
                                            Among them, picture quality assessment (PQA) has been receiving a lot of attention as
         With Quality-Aware Features.       an important part of image processing technology. With a variety of PQA models available
          Front. Neurosci. 15:766396.       from Wang et al. (2004), how to achieve evaluation results that are consistent with the
     doi: 10.3389/fnins.2021.766396         subjective PQA of human beings is crucial. Usually, subjective experiments are performed by

Frontiers in Neuroscience | www.frontiersin.org                                    1                                          October 2021 | Volume 15 | Article 766396
Yu et al.                                                                                                      Page View and Quality-Aware Features

human observers who score the pictures, and the final reliable             pictures. The local features of pictures can perfectly reflect the
results obtained are taken as the ground truth (Gu et al.,                 perceptual quality of pictures.
2014, 2015a). However, the method mentioned above is time                      Due to the fact that most of the audiences get the information
consuming and complicated, so the focus of relevant scientific             from official accounts from vision, we also introduce into the
research has shifted to the design of objective PQA algorithms             approach based on the HVS. Advances in brain science and
implemented by computers. The objective PQA algorithm has                  neuroscience studied by Friston et al. (2006) have encouraged
the characteristics of convenience, high-speed, repeatable, batch          scholars to explore new fields of machine vision. Eye movement
processing, and real-time, which make up for the deficiency of             research is also of significance to the visual perception of brain
the subjective PQA method.                                                 science. Jiang et al. (2019a), Kim et al. (2019), Lin et al. (2019),
    The objective PQA approach establishes a mathematical                  Tang et al. (2020), Zhang et al. (2020), Jiang et al. (2021), Wang
model that is combined with the subjective human visual system             et al. (2021) had carried out a lot of research work. Brain science
(HVS) to realize the evaluation of picture quality. According to           research have shown that the brain produces an intrinsic model
the amount of information provided by the reference picture,               to explain the process of perception and understanding, and that
the existing objective PQA methods can be divided into: full               the free energy generated during this cognitive process can reflect
reference (FR) PQA method, reduced reference (RR) PQA                      the difference between picture signals and internal descriptions.
method, and no reference (NR) PQA method. Among them,                      By modeling important physiological and psychological visual
the FR PQA method is the most reliable and technically mature              features, Xu et al. (2016) discussed the mechanism related to
evaluation method. It has a complete original picture and                  free energy in the human brain and proposed an efficient PQA
allows a one-to-one correspondence comparison of the distorted             method by using JPEG and JPEG2000 compression, Jiang et al.
picture with the pixels of the original picture. Instead, RR               (2020) presented a new FR-SIQM method by measuring and
PQA method requires only partial original picture information,             fusing the degradations on hierarchical features. Besides, Gu et al.
researchers like Liang and Weller (2016) and Wu et al. (2013)              (2015b) designed the NFSDM in an alternative way of extracting
put forward a series of novel RR PQA algorithms. The FR                    features. On the basis of the NFSDM approach, the NFERM is
PQA algorithm and the RR PQA algorithm combine the visual                  combined with HVS to reduce the number of extracted by half,
features of the picture to quantify the difference between the             further improving the accuracy of the evaluation.
original picture and the distorted picture, so as to get the quality           Based on image processing technology, this paper investigates
of pictures.                                                               a large collection of quality-aware features of pictures to
    In official accounts, the original picture information is              predict the page view that reflects the popularity of articles. To
not available, so it is particularly important to propose PQA              accomplish this goal, the authors do a lot of work to collect
algorithm. Most of the current NR PQA methods were proposed                the pictures published by the WeChat official accounts of nine
based on two steps, which are feature extraction proposed by Gu            universities in Beijing in recent months, and establish a new
et al. (2017b) and the support vector machine (SVM) proposed               picture database consisting of 1,000 pictures. In addition, we
by Smola and Schölkopf (2004) that can find out the underlying             collect three groups of features from the Official Accounts Picture
relationship between the selected features and human subjective            Quality Database (OAPQD) and use the selective ensemble
evaluations. No reference method is a situation where none of              technique proposed for NSS, HVS, and histogram feature analysis
the information contained in any reference picture or video                to fuse these features, allowing them to fit the correlation between
is used to draw quality conclusions. Since the picture is not              page view and the quality of pictures. The results of experiments
available in most cases, more and more metrics were proposed               show that these features are able to predict the page view of
for NR PQA method. Nowadays, the advanced method (e.g.,                    articles, and that the method of using the three groups of features
BRISQUE) is a universal blind PQA model based on Natural                   can more accurately fit the correlation.
Scene Statistics (NSS) proposed by Mittal et al. (2012). Natural               The structure of this paper is as follows. In section 2, we
scene pictures belong to a small domain of Internet picture                describe the construction of the OAPQD dataset. In section 3,
signals that follow predictable statistical laws. Specifically, the        the three features and the selective ensemble method that can
natural scene pictures captured by high-quality devices obey               fuse them are presented separately. We conduct the comparison
the Gaussian-like distribution, while the pictures with distortion         experiment on the OAPQD to analyze the magnitude of the seven
(such as blur, noise, watermarks, color transformation, etc.) do           features on fitting the page view in section 4. Section 5 gives the
not follow the Bell curve law. Based on this theory, the features          concluding remarks.
of NSS can be used as an effective and robust natural PQA tool.
In recent years, a large number of studies based on NSS have
been carried out, such as the MSDDs presented by Jiang et al.              2. THE DATASET
(2018), Bliinds-II constructed by Saad et al. (2012), BLIQUE-
TMI created by Jiang et al. (2019b), GMLF designed by Xue                  With the development of information and network technology,
et al. (2014), and DIIVINE presented by Moorthy and Bovik                  traditional media were gradually replaced by digital new media,
(2011), which is capable of assessing the quality of distorted             such as WeChat official account, which has been widely used by
pictures across multiple distortion categories, etc. In addition,          all walks of life. Currently, most universities use official accounts
Ruderman (1994) investigated the data rules of natural pictures,           as the platform for campus culture construction. In order to
which provides a basis for evaluating the perceptual quality of            better explore the reasons why articles are popular on public

Frontiers in Neuroscience | www.frontiersin.org                        2                                   October 2021 | Volume 15 | Article 766396
Yu et al. Page View and Quality-Aware Features
accounts, we focus mainly on the page view of articles. To this distortion types and natural pictures, we use the generalized
end, we first subscribed to the WeChat official accounts of nine Gaussian distribution (GGD) to fit the distribution of MSCN.
well-known universities in Beijing, then selected the pictures The sign of the transformed picture coefficients are regular, but
inserted in the articles that were published by the accounts in Mittal et al. suggested that the existence of distortion affects this
the past months, based on which a new database is created. To above correlation structure. In order to research the correlation
be specific, the most researched and representative pictures are information between connected pixels, the zero-mode AGGD is
extracted from the selected article. Simultaneously, the number used to model the inner product of MSCN adjacent coefficient.
of page views corresponding to the selected article is recorded, The moment matching-based approach proposed by Lasmar et al.
with a maximum of 100,000 and a minimum of 253. We selected (2009) can estimate the parameters of the AGGD. Then we
a picture from a large number of articles published by official calculate the adjacent pairs of coefficients from the horizontal,
accounts of schools every day, and we have collected 1,276 vertical, and diagonal directions to obtain the 16 parameters,
pictures altogether. However, not each of the above pictures has respectively. Low-resolution pictures are obtained from each
research value. In these pictures, the selection criteria are first picture through low-pass filtering and downsampling with a
based on the picture content and type, and then exclude extreme factor of 2. We measure the MSCN parameters fitted by GGD and
special cases, such as the case where the picture quality is very the 16 parameters generated by AGGD according to the above
poor but the number of clicks is very high. Finally, 1,000 most two scales. Once all the work mentioned above is done, the first
representative pictures were selected to form the picture data set. feature set consisting of 36 features is obtained.
Figure 1 shows the subset of OAPQD.
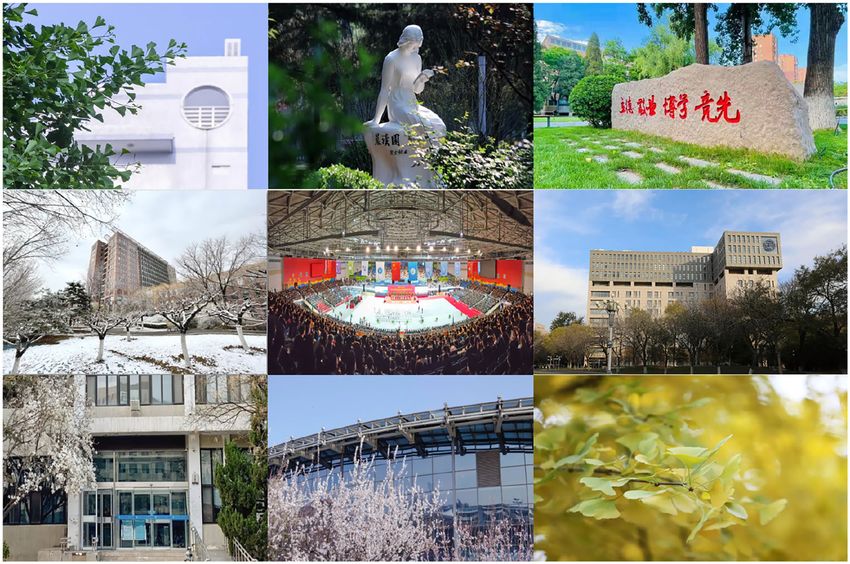
By observing the data set we constructed, we find that there 3.2. Histogram-Based Feature Extraction
is a positive correlation between picture quality and page view. The second group consists of 40 features (f37 -f76 ), illustrating
As shown in Figure 2, there are three pictures from left to right. the main features of the HVS introduced from biology in image
The picture on the left is the most colorful and clear among the processing. Since the visual information in picture is often
three pictures, giving a better visual experience with 41,000 hits. redundant, the understanding of the HVS is mainly related
The intermediate picture is of poor quality, with only 7,466 clicks. to its basic features, such as contour, zero cross, and so on.
The picture on the far right is the least visually appealing and thus Gradient magnitude (GM) feature can reflect the intensity of
logically the least clicked picture with only 1,052. local luminance variations. The local maximum GM pixels can
reflect small details and textural change of pictures, which is
3. METHODOLOGY the main element of contour. GM has been widely used for
PQA methods, such as FSIM proposed by Zhang et al. (2011),
The specific features can well reflect the page view of pictures, GMSD constructed by Xue et al. (2013), PSIM designed by
but the fitting accuracy of using a certain characteristic feature Gu et al. (2017a), and ADD-GSIM established by Gu et al.
alone is relatively low. In this section, we will introduce the three (2016), where picture quality is evaluated only by the similarity
groups of complementary features extracted based on natural of gradient magnitude. Besides, on the basis of GM method,
scene analysis, histogram, and free energy theory, and further Min et al. (2019b) first proposed a picture dehazing algorithm,
describe a selective ensemble approach capable of fusing the then a novel objective index named DHQI was presented by
99 features. Min et al. (2019a) can be utilized to evaluate DHAs or optimize
practical dehazing systems. Finally, a blind PQA method was
3.1. NSS-Based Feature Extraction introduced by Min et al. (2018) has a superior performance.
The first group is composed of 36 features (f01 -f36 ), which were Generally, GM is calculated using linear filter convolution, where
proposed on the basis of NSS theory. Bovik (2010) suggested that the typical filters are mainly Sobel, Prewitt, Roberts, etc. Unlike
natural pictures have regular statistical characteristics, therefore, the GM operator, isotropic measurements on the second spatial
the statistical features of natural scenes can be considered as derivative of pictures show the strongest brightness variation.
an effective and powerful tool for PQA. In general, complex The Laplacian of Gaussian (LOG) operator reflects the intensity
image textures affect the perceptual level of distortion, and the contrast of a small spatial neighborhood, and Marr and Hildreth
local brightness normalization can greatly reduce the correlation (1980) proposed that it can model the receptive fields of retinal
between adjacent pixels of the original picture and the distorted ganglion cells. The LOG operator and the GM operator adopt
picture. Thus, the classic spatial NSS model is first used to the anisotropic calculation method without angular preference
preprocess the picture to remove the local mean value, and to obtain the local picture structure from different angles. They
then the picture is segmented and normalized to extract the can represent the structural information of pictures, especially
mean subtracted contrast normalized coefficient of natural scene the local contrast features, and therefore can be used to form
pictures. The Mean Subtracted Contrast Normalized (MSCN) the semantic information of pictures. Finally, the picture local
coefficients vary in different ways due to distinct distortions. On quality prediction is achieved by using these two operators
the basis of this variation, the type of picture distortion and mentioned above.
the perceived quality of pictures can be predicted. The pixel
intensity of natural pictures follows a Gaussian distribution, 3.3. Free Energy-Based Feature Extraction
which can be represented by a Bell curve. In order to clearly The 23 features (f77 -f99 ) extracted in the third group are inspired
observe the differences in data distribution between different by the free energy principle and the structural degradation
Frontiers in Neuroscience | www.frontiersin.org 3 October 2021 | Volume 15 | Article 766396Yu et al. Page View and Quality-Aware Features FIGURE 1 | Representative nine pictures from the OAPQD data set, the content of above mainly includes architecture, landscape, people, text content, meeting scene, etc. FIGURE 2 | The quality of the three pictures in the OAPQD decreases gradually from left to right. model (SDM). A basic premise of the free energy theory is In an effective RR SDM proposed by Gu et al. (2015b), that an internal generative model can be used to estimate the we observe the structural degradation after low-pass filtering gap between the viewing scene and the corresponding brain of the picture. The spatial frequency of input picture I prediction. It measures the difference between the probability has different degrees of decrease. We first define the local distribution of environmental quantities acting on the system mean and variance of I with a two-dimensional circularly and an arbitrary distribution encoded by its configuration. symmetric Gaussian weighting function. The linear dependence Since this process is very closely related to the quality of between the free energy and the structural degradation human visual perception, it can be used for the PQA method. information provides an opportunity to characterize distorted The free energy of pictures can be approximated by the pictures in the absence of the information of original picture. AR model as the total description length of pictures data. Furthermore, the NFEQM is added to the third group as Frontiers in Neuroscience | www.frontiersin.org 4 October 2021 | Volume 15 | Article 766396
Yu et al.                                                                                                         Page View and Quality-Aware Features

feature f99 due to its excellent performance in noisy and                   correlation coefficient (PLCC) and the Spearman rank order
blurred pictures.                                                           correlation coefficient (SRCC). The PLCC is a linear correlation
                                                                            coefficient with scale invariance, which indicates the degree of
3.4. Selective Ensemble-Based Page View                                     similarity between picture features and page view. The PLCC is
Inference                                                                   defined as
A single picture feature does not represent the picture quality                                        P
                                                                                                            (qi − q̄) · (oi − ō)
well, which will lead to its poor fitting of the relationship                             PLCC = pP i                                     (1)
                                                                                                                   2                  2
                                                                                                                       P
between features and page view. To solve this question, we                                              i (qi − q̄) ·     i (oi − ō)
consider an ensemble learning approach which can produce                    where oi and ō represent the features of the ith picture and its
strong generalization to improve the fitting accuracy. This                 overall mean value, and qi and q̄ are the page view of ith picture
content has become a hot research topic in the international                and its mean value. Before using the PLCC metric for evaluation,
machine learning community, so there are more and more                      we employ the nonlinear regression equation proposed by Sheikh
methods presents by scholars, such as the geometric structural              et al. (2006), which is given by
ensemble (GSE) learning framework approach presented by Zhu
et al. (2018). Zhou et al. (2002) suggested that the presence of
                                                                                                       1       1

high-dimensional selective ensemble methods based on direct                            p(x) = α1         −                 + α4 x + α5              (2)
                                                                                                       2 1 + eα2 (x−α3 )
merging is prone to overfitting or some of these features
may be overlooked in the fitting process. On the basis of                   where p(x) represents the predicted score, αi (i = 1,2,3,4,5) is
this theory, we adopt the method of selective ensemble to                   the parameter of the generation fitting, and x is the original
further enhance the performance of our presented approach in                prediction score. While the SRCC represents the strength of the
this paper.                                                                 monotonic relationship predicted by the algorithm, it can be
   It is natural to combine features to derive a more effective             calculated by
preprocessing method, so as to better remove random details
caused by the varying viewing method and picture resolution                                                         6
                                                                                                                            N
                                                                                                                            X
in different but supplementary domains. We combine the                                       SRCC = 1 −                           di2               (3)
                                                                                                              N(N 2 − 1)
three features two by two and last fuse the three by using a                                                                i=1
selective ensemble technique proposed by Gu et al. (2020b)
and Chen et al. (2021), so as to make an experimental                       where N is the number of pictures in the dataset, and di is the
comparison with the accuracy of the fit using single features.              difference between the ranking of ith picture in features and
The following seven categories can be generated based on the                page view. The value range of PLCC and SRCC is [−1, 1]. The
number of features: (1) BRISQUE; (2) GMLF; (3) NFERM; (4)                   closer the absolute value of these two indicators is to 1, the
BRISQUE+GMLF; (5) BRISQUE+NFERM; (6) GMLF+NFERM;                            stronger the correlation between picture features and page view,
(7) BRISQUE+GMLF+NFERM. The experimental results show                       where >0 means a positive correlation and
Yu et al. Page View and Quality-Aware Features
TABLE 1 | The Pearson linear correlation coefficient (PLCC) and Spearman rank official accounts. We elaborately select 1,000 pictures from
order correlation coefficient (SRCC) values of seven feature fusion methods on the
the official accounts of nine universities, construct a picture
dataset.
database named OAPQD, and record the clicks of corresponding
Algorithm PLCC SRCC articles. Three groups of features extracted from different angles
can reflect the features, and the stacked selective ensemble
BRISQUE (direct use) 0.0156 0.0347 technology is used to fuse them for comparison experiments.
GMLF (direct use) 0.0034 0.0343 The experimental results show that the method integrating three
NFERM (direct use) 0.0683 0.0146 groups of 99 features at the same time has the highest accuracy
BRISQUE (re-train) 0.3925 0.2707 in fitting the page view. Therefore, in future publicity work,
GMLF (re-train) 0.3911 0.3340 the selection of pictures is very meaningful for the popularity
NFERM (re-train) 0.3983 0.2782 of official account articles. For the publicity department of
BRISQUE+GMLF 0.4545 0.3577 the college, they can import our method to predict the
BRISQUE+NFERM 0.4454 0.3054 page views of their articles and use these data parameters
GMLF+NFERM 0.4387 0.3655 to adjust picture quality or change diffusion strategy. All of
BRISQUE+GMLF+ NFERM 0.4764 0.3863 these measures can improve the visibility of official accounts to
The top data values are given in bold.
some extent.
DATA AVAILABILITY STATEMENT
method are given in bold. In Table 1, it can be seen that the
values of PLCC and SRCC are very approximate when using The raw data supporting the conclusions of this article will be
a single algorithm. It is not difficult to find that GMLF has made available by the authors, without undue reservation.
gained the best results (on average) of SRCC, which is sensitive
to pictures with gradient features. However, Table 1 reports the AUTHOR CONTRIBUTIONS
low correlation performance on SRCC when combined with the
features from BRISQUE and NFERM. It also can be seen that YY conceived the framework of the paper and completed the
the more the number of fused picture features, the better the main content of the paper. SS collected a large number of
fit to the relation between features and page view. Meanwhile, references to provide a strong background basis for the paper.
it shows a certain degree of similarity between the features and YW was mainly responsible for the revision of the thesis.
click-through rate. This method proposed in this paper can XL participated in the revision and content supplement of
provide guidance for the management of college official accounts. the article. JL revised the layout of the article and checked
For example, the insertion of high-definition and high-quality for grammatical errors. FL checked the final version of the
pictures into published articles can increase the visibility of paper. All authors contributed to the article and approved the
the articles. submitted version.
5. CONCLUSION FUNDING
In this paper, we have studied the connection between picture This work was supported by National Social Science Foundation
features and the popularity of articles published in college of China (15BJY048).
REFERENCES Gu, K., Liu, H., Xia, z., Qiao, J., Lin, W., and Thalmann, D. (2021a).
Pm 2.5 monitoring: use information abundance measurement and wide
Bovik, A. C. (2010). Handbook of Image and Video Processing. Academic Press. and deep learning. IEEE Trans. Neural Netw. Learn. Syst. 2, 4278–4290.
Chen, W., Gu, K., Zhao, T., Jiang, G., and Callet, P. L. (2021). Semi-reference sonar doi: 10.1109/TNNLS.2021.3105394
image quality assessment based on task and visual perception. IEEE Trans. Gu, K., Liu, M., Zhai, G., Yang, X., and Zhang, W. (2015a). Quality assessment
Multimedia 23, 1008–1020. doi: 10.1109/TMM.2020.2991546 considering viewing distance and image resolution. IEEE Trans. Broadcast. 61,
Friston, K., Kilner, J., and Harrison, L. (2006). A free energy principle for the brain. 520–531. doi: 10.1109/TBC.2015.2459851
J. Physiol. 100, 70–87. doi: 10.1016/j.jphysparis.2006.10.001 Gu, K., Qiao, J., and Li, X. (2019). Highly efficient picture-based prediction
Geng, B., Yang, L., Xu, C., Hua, X.-S., and Li, S. (2011). “The role of attractiveness of PM2. 5 concentration. IEEE Trans. Indus. Electron. 66, 3176–3184.
in web image search,” in Proceedings of the 19th ACM International Conference doi: 10.1109/TIE.2018.2840515
on Multimedia (Scottsdale, AZ), 63–72. Gu, K., Qiao, J., and Lin, W. (2018). Recurrent air quality predictor based on
Greenberg, R., Magisos, M., Kolvoord, R., and Strom, R. (1994). “Image meteorology- and pollution-related factors. IEEE Trans. Indus. Informatics 14,
processing for teaching: a national dissemination program,” in Proceedings of 3946–3955. doi: 10.1109/TII.2018.2793950
1st International Conference on Image Processing, Vol. 1 (Austin, TX), 511–514. Gu, K., Tao, D., Qiao, J.-F., and Lin, W. (2017b). Learning a no-reference
Gu, K., Li, L., Lu, H., Min, X., and Lin, W. (2017a). A fast reliable image quality quality assessment model of enhanced images with big data. IEEE Trans.
predictor by fusing micro-and macro-structures. IEEE Trans. Indus. Electron. Neural Netw. Learn. Syst. 29, 1301–1313. doi: 10.1109/TNNLS.2017.264
64, 3903–3912. doi: 10.1109/TIE.2017.2652339 9101
Frontiers in Neuroscience | www.frontiersin.org 6 October 2021 | Volume 15 | Article 766396Yu et al. Page View and Quality-Aware Features
Gu, K., Wang, S., Zhai, G., Lin, W., Yang, X., and Zhang, W. (2016). Analysis Moorthy, A. K., and Bovik, A. C. (2011). Blind image quality assessment: from
of distortion distribution for pooling in image quality prediction. IEEE Trans. natural scene statistics to perceptual quality. IEEE Trans. Image Process. 20,
Broadcast. 62, 446–456. doi: 10.1109/TBC.2015.2511624 3350–3364. doi: 10.1109/TIP.2011.2147325
Gu, K., Xia, Z., and Qiao, J. (2020a). Deep dual-channel neural network Moroz, M., Garzorz, I., Folmer, E., and MacNeilage, P. (2019). Sensitivity to visual
for image-based smoke detection. IEEE Trans. Multimedia 22, 311–323. speed modulation in head-mounted displays depends on fixation. Displays 58,
doi: 10.1109/TMM.2019.2929009 12–19. doi: 10.1016/j.displa.2018.09.001
Gu, K., Xia, Z., and Qiao, J. (2020b). Stacked selective ensemble for PM2.5 forecast. Rajashekar, U., Panayi, G., Baumgartner, F., and Bovik, A. (2002). The
IEEE Trans. Instrum. Meas. 69, 660–671. doi: 10.1109/TIM.2019.2905904 siva demonstration gallery for signal, image, and video processing
Gu, K., Zhai, G., Yang, X., and Zhang, W. (2014). Hybrid no-reference quality education. IEEE Trans. Educ. 45, 323–335. doi: 10.1109/TE.2002.
metric for singly and multiply distorted images. IEEE Trans. Broadcast. 60, 804392
555–567. doi: 10.1109/TBC.2014.2344471 Richard, W. (1991). An educational image processing/machine vision system. IEEE
Gu, K., Zhai, G., Yang, X., and Zhang, W. (2015b). Using free energy principle Trans. Educ. 34, 129–132. doi: 10.1109/13.79893
for blind image quality assessment. IEEE Trans. Multimedia 17, 50–63. Ruderman, D. L. (1994). The statistics of natural images. Network 5:517.
doi: 10.1109/TMM.2014.2373812 doi: 10.1088/0954-898X_5_4_006
Gu, K., Zhang, Y., and Qiao, J. (2020c). Vision-based monitoring of flare soot. IEEE Saad, M. A., Bovik, A. C., and Charrier, C. (2012). Blind image quality assessment:
Trans. Instrum. Meas. 69, 7136–7145. doi: 10.1109/TIM.2020.2978921 a natural scene statistics approach in the DCT domain. IEEE Trans. Image
Gu, K., Zhang, Y., and Qiao, J. (2021b). Ensemble meta-learning for few- Process. 21, 3339–3352. doi: 10.1109/TIP.2012.2191563
shot soot density recognition. IEEE Trans. Indus. Informat. 17, 2261–2270. Sheikh, H. R., Sabir, M. F., and Bovik, A. C. (2006). A statistical evaluation of recent
doi: 10.1109/TII.2020.2991208 full reference image quality assessment algorithms. IEEE Trans. Image Process.
Jiang, Q., Peng, Z., Yue, G., Li, H., and Shao, F. (2021). No-reference image contrast 15, 3440–3451. doi: 10.1109/TIP.2006.881959
evaluation by generating bidirectional pseudoreferences. IEEE Trans. Indus. Smola, A. J., and Schölkopf, B. (2004). A tutorial on support vector regression. Stat.
Informat. 17, 6062–6072. doi: 10.1109/TII.2020.3035448 Comput. 14, 199–222. doi: 10.1023/B:STCO.0000035301.49549.88
Jiang, Q., Shao, F., Gao, W., Chen, Z., Jiang, G., and Ho, Y.-S. (2019a). Su, H., Jung, C., Wang, L., Wang, S., and Du, Y. (2019). Adaptive tone mapping
Unified no-reference quality assessment of singly and multiply distorted for display enhancement under ambient light using constrained optimization.
stereoscopic images. IEEE Trans. Image Process. 28, 1866–1881. Displays 56, 11–22. doi: 10.1016/j.displa.2018.10.005
doi: 10.1109/TIP.2018.2881828 Tang, X.-T., Yao, J., and Hu, H.-F. (2020). Visual search
Jiang, Q., Shao, F., Lin, W., Gu, K., Jiang, G., and Sun, H. (2018). Optimizing experiment on text characteristics of vital signs monitor
multistage discriminative dictionaries for blind image quality assessment. IEEE interface. Displays 62:101944. doi: 10.1016/j.displa.2020.
Trans. Multimedia 20, 2035–2048. doi: 10.1109/TMM.2017.2763321 101944
Jiang, Q., Shao, F., Lin, W., and Jiang, G. (2019b). Blique-TMI: blind Wang, X., Jiang, Q., Shao, F., Gu, K., Zhai, G., and Yang, X. (2021). Exploiting local
quality evaluator for tone-mapped images based on local and global degradation characteristics and global statistical properties for blind quality
feature analyses. IEEE Trans. Circuits Syst. Video Technol. 29, 323–335. assessment of tone-mapped HDR images. IEEE Trans. Multim. 23, 692–705.
doi: 10.1109/TCSVT.2017.2783938 doi: 10.1109/TMM.2020.2986583
Jiang, Q., Zhou, W., Chai, X., Yue, G., Shao, F., and Chen, Z. (2020). A Wang, Z., Bovik, A. C., Sheikh, H. R., and Simoncelli, E. P. (2004).
full-reference stereoscopic image quality measurement via hierarchical deep Image quality assessment: from error visibility to structural similarity.
feature degradation fusion. IEEE Trans. Instrum. Meas. 69, 9784–9796. IEEE Trans. Image Process. 13, 600–612. doi: 10.1109/TIP.2003.
doi: 10.1109/TIM.2020.3005111 819861
Kang, H., Ko, J., Park, H., and Hong, H. (2019). Effect of outside view on Wu, H.-N., Wang, X.-M., Yu, L.-K., Yuan, T., and Kuai, S.-G. (2019).
attentiveness in using see-through type augmented reality device. Displays 57, Rendering a virtual light source to seem like a realistic light source
1–6. doi: 10.1016/j.displa.2019.02.001 in an electronic display: a critical band of luminance gradients for the
Kim, H., Yi, S., and Yoon, S.-Y. (2019). Exploring touch feedback display perception of self-luminosity. Displays 59, 44–52. doi: 10.1016/j.displa.2019.
of virtual keyboards for reduced eye movements. Displays 56, 38–48. 07.001
doi: 10.1016/j.displa.2018.11.004 Wu, J., Lin, W., Shi, G., and Liu, A. (2013). Reduced-reference
Lasmar, N.-E., Stitou, Y., and Berthoumieu, Y. (2009). “Multiscale skewed heavy image quality assessment with visual information fidelity. IEEE
tailed model for texture analysis,” in 2009 16th IEEE International Conference Trans. Multimedia 15, 1700–1705. doi: 10.1109/TMM.2013.
on Image Processing (ICIP) (Cairo), 2281–2284. 2266093
Liang, H., and Weller, D. S. (2016). Comparison-based image quality assessment Xu, L., Lin, W., Ma, L., Zhang, Y., Fang, Y., Ngan, K. N., et al. (2016). Free-energy
for selecting image restoration parameters. IEEE Trans. Image Process. 25, principle inspired video quality metric and its use in video coding. IEEE Trans.
5118–5130. doi: 10.1109/TIP.2016.2601783 Multimedia 18, 590–602. doi: 10.1109/TMM.2016.2525004
Lin, C. J., Prasetyo, Y. T., and Widyaningrum, R. (2019). Eye movement measures Xue, W., Mou, X., Zhang, L., Bovik, A. C., and Feng, X. (2014). Blind image quality
for predicting eye gaze accuracy and symptoms in 2d and 3d displays. Displays assessment using joint statistics of gradient magnitude and laplacian features.
60, 1–8. doi: 10.1016/j.displa.2019.08.002 IEEE Trans. Image Process. 23, 4850–4862. doi: 10.1109/TIP.2014.2355716
Liu, H., Lei, F., Tong, C., Cui, C., and Wu, L. (2021). Visual smoke detection based Xue, W., Zhang, L., Mou, X., and Bovik, A. C. (2013). Gradient magnitude
on ensemble deep cnns. Displays 69:102020. doi: 10.1016/j.displa.2021.102020 similarity deviation: a highly efficient perceptual image quality index. IEEE
Marr, D., and Hildreth, E. (1980). Theory of edge detection. Proc. R. Soc. Lond. Ser. Trans. Image Process. 23, 684–695. doi: 10.1109/TIP.2013.2293423
B. Biol. Sci. 207, 187–217. doi: 10.1098/rspb.1980.0020 Yaman, O., and Karakose, M. (2016). “Development of image processing
Min, X., Zhai, G., Gu, K., Liu, Y., and Yang, X. (2018). Blind image quality based methods using augmented reality in higher education,” in 2016 15th
estimation via distortion aggravation. IEEE Trans. Broadcast. 64, 508–517. International Conference on Information Technology Based Higher Education
doi: 10.1109/TBC.2018.2816783 and Training (ITHET) (Istanbul), 1–5.
Min, X., Zhai, G., Gu, K., Yang, X., and Guan, X. (2019a). Objective quality Yildirim, C. (2019). Cybersickness during vr gaming undermines game
evaluation of dehazed images. IEEE Trans. Intell. Transport. Syst. 20, 2879– enjoyment: a mediation model. Displays 59, 35–43. doi: 10.1016/j.displa.2019.
2892. doi: 10.1109/TITS.2018.2868771 07.002
Min, X., Zhai, G., Gu, K., Zhu, Y., Zhou, J., Guo, G., et al. (2019b). Quality Zhang, L., Zhang, L., Mou, X., and Zhang, D. (2011). FSIM: A feature similarity
evaluation of image dehazing methods using synthetic hazy images. IEEE Trans. index for image quality assessment. IEEE Trans. Image Process. 20, 2378–2386.
Multim. 21, 2319–2333. doi: 10.1109/TMM.2019.2902097 doi: 10.1109/TIP.2011.2109730
Mittal, A., Moorthy, A. K., and Bovik, A. C. (2012). No-reference image quality Zhang, Y., Tu, Y., and Wang, L. (2020). Effects of display area and corneal
assessment in the spatial domain. IEEE Trans. Image Process. 21, 4695–4708. illuminance on oculomotor system based on eye-tracking data. Displays
doi: 10.1109/TIP.2012.2214050 63:101952. doi: 10.1016/j.displa.2020.101952
Frontiers in Neuroscience | www.frontiersin.org 7 October 2021 | Volume 15 | Article 766396Yu et al. Page View and Quality-Aware Features
Zheng, T., Pan, W., and Jia, B. (2009). “Study on the application of pattern Publisher’s Note: All claims expressed in this article are solely those of the authors
recognition technology in distance education system,” in 2009 Second and do not necessarily represent those of their affiliated organizations, or those of
International Conference on Computer and Electrical Engineering, Vol. 1 the publisher, the editors and the reviewers. Any product that may be evaluated in
(Dubai), 474–477. this article, or claim that may be made by its manufacturer, is not guaranteed or
Zhou, Z.-H., Wu, J., and Tang, W. (2002). Ensembling neural
endorsed by the publisher.
networks: many could be better than all. Artif. Intell. 137, 239–263.
doi: 10.1016/S0004-3702(02)00190-X
Copyright © 2021 Yu, Shi, Wang, Lian, Liu and Lei. This is an open-access article
Zhu, Z., Wang, Z., Li, D., Zhu, Y., and Du, W. (2018). Geometric structural
distributed under the terms of the Creative Commons Attribution License (CC BY).
ensemble learning for imbalanced problems. IEEE Trans. Cybern. 50, 1617–
The use, distribution or reproduction in other forums is permitted, provided the
1629. doi: 10.1109/TCYB.2018.2877663
original author(s) and the copyright owner(s) are credited and that the original
Conflict of Interest: The authors declare that the research was conducted in the publication in this journal is cited, in accordance with accepted academic practice.
absence of any commercial or financial relationships that could be construed as a No use, distribution or reproduction is permitted which does not comply with these
potential conflict of interest. terms.
Frontiers in Neuroscience | www.frontiersin.org 8 October 2021 | Volume 15 | Article 766396You can also read