EXTENT OF FOOD PROCESSING AND RISK OF PROSTATE CANCER: THE PROTEUS STUDY IN MONTREAL, CANADA
←
→
Page content transcription
If your browser does not render page correctly, please read the page content below
nutrients
Article
Extent of Food Processing and Risk of Prostate Cancer:
The PROtEuS Study in Montreal, Canada
Karine Trudeau 1,2 , Marie-Claude Rousseau 1,2,3 and Marie-Élise Parent 1,2,3, *
 1   Epidemiology and Biostatistics Unit, Centre Armand-Frappier Santé Biotechnologie, Institut national de la
     recherche scientifique, University of Quebec, Laval, QC H7V 1B7, Canada; karine.trudeau@iaf.inrs.ca (K.T.);
     marie-claude.rousseau@iaf.inrs.ca (M.-C.R.)
 2   School of Public Health, Department of Social and Preventive Medicine, University of Montreal,
     Montreal, QC H3N 1X9, Canada
 3   University of Montreal Hospital Research Centre, Montreal, QC H2X 0A9, Canada
 *   Correspondence: marie-elise.parent@iaf.inrs.ca; Tel.: +1-450-686-5676

 Received: 4 February 2020; Accepted: 26 February 2020; Published: 28 February 2020

 Abstract: We studied the association between food intake, based on the extent of processing, and
 prostate cancer risk in a population-based case-control study conducted in Montreal, Canada in
 2005–2012. Incident prostate cancer cases (n = 1919) aged ≤75 years were histologically confirmed.
 Population controls (n = 1991) were randomly selected from the electoral list and frequency-matched
 to cases by age (±5 years). A 63-item food frequency questionnaire focusing on the two years prior
 to diagnosis/interview was administered by interviewers. The NOVA classification was used to
 categorize foods based on processing level. Unconditional logistic regression estimated the association
 between food intake and prostate cancer risk, adjusting for age, education, ethnicity, family history,
 and timing of last prostate cancer screening. Consumption of unprocessed or minimally processed
 foods showed a slight, inverse association (Odd ratio [OR] 0.86, 95% confidence interval [CI] 0.70–1.07;
 highest vs. lowest quartile) with prostate cancer. An increased risk was observed with higher intake
 of processed foods (OR 1.29, 95%CI 1.05–1.59; highest vs. lowest quartile), but not with consumption
 of ultra-processed food and drinks. The associations with unprocessed/minimally processed foods
 and processed foods were slightly more pronounced for high-grade cancers (ORs 0.80 and 1.33,
 respectively). Findings suggest that food processing may influence prostate cancer risk.

 Keywords: prostate cancer; case-control study; NOVA; food processing; ultra-processed foods;
 unprocessed or minimally processed foods; processed culinary ingredients; processed foods

1. Introduction
     Prostate cancer was the most commonly diagnosed cancer, after non-melanoma skin cancer,
among Canadian men in 2019, accounting for 22,900 of estimated new cases [1]. It was the third cause
of cancer death with 4100 estimated deaths. The burden will increase in this country, with 33,063
new cases projected for 2023 [2]. The only definitively established risk factors for prostate cancer
are advancing age, family history of prostate cancer, and African ancestry [3–5]. Despite extensive
research to understand its etiology, there are still no known modifiable risk factors for this cancer [5].
The geographic distribution of the incidence of prostate cancer and studies of migrant populations
strongly suggest that its etiology is at least partially influenced by environmental factors and lifestyle
habits, possibly diet [6]. Most previous studies focusing on the latter have evaluated the role of a single
food or nutrient at a time, with contradictory findings [7,8]. According to the World Cancer Research
Fund, there is only limited evidence that dairy products, diets high in calcium, low-plasma tocopherol
concentrations, and low plasma selenium concentrations increase the risk of prostate cancer [5].

Nutrients 2020, 12, 637; doi:10.3390/nu12030637                                  www.mdpi.com/journal/nutrients
Nutrients 2020, 12, 637 2 of 12
Several factors can influence nutritional quality, including education and occupation. Although
education may help make healthier choices, busy lifestyles can push people with lower or
higher educational levels to consume ready-to-eat meals, including ultra-transformed food [9].
Ultra-transformed foods are formulations made mostly or entirely from substances derived from
foods and additives, with little if any intact unprocessed or minimally processed food [10,11]. Their
consumption might be linked to chronic conditions such as type 2 diabetes, obesity and cancers [12].
Surveys in Europe, the US, Canada, Brazil and New Zealand on individual food intake, household
food expenses, or supermarket sales show that ultra-processed food products represent 25% to 50% of
the total daily energy intake [13,14]. Understanding the health impact of ultra-processed foods has
gained in interest as the global consumption of ultra-processed foods increases [15]. To our knowledge,
only one published study to date has reported on the frequency of ultra-processed foods consumption
in relation with cancer risk. It found no association with prostate cancer, albeit based on relatively
few cases [13]. A recent study suggests a higher risk of all-cause mortality associated with a greater
consumption of ultra-processed foods [16].
Several aspects of foods undergoing processing justify studying them in relation to cancer risk:
their nutritional composition (e.g., high contents of saturated fat, sugar, salt), the presence of some
contaminants and additives (e.g., acrylamide, heterocyclic amines, polycyclic aromatic hydrocarbons,
emulsifiers, artificial sweeteners), and their packaging (e.g., bisphenol A) [17]. By contrast, the
consumption of unprocessed foods such as fruits and vegetables has been linked with a reduced risk
of aerodigestive cancers [18].
The objective of the present study was to evaluate the association between the extent of processing
of food in the diet and prostate cancer risk, both overall and by tumour aggressiveness.
2. Materials and Methods
2.1. Study Population
We used data from the Prostate Cancer and Environment Study (PROtEuS), a large
population-based case-control study conducted in Montreal, Canada aimed at identifying
environmental, occupational, lifestyle and genetic factors involved in the development of prostate
cancer. This study has been described previously [19]. In brief, eligible cases and controls were
Canadian citizens registered on the provincial electoral list, residents of the Montreal metropolitan
area and agedNutrients 2020, 12, 637 3 of 12
2.2. Data Collection
Face-to-face interviews were conducted between 2005 and 2012, mainly in the house of participants,
collecting a wide range of information on sociodemographic, environmental, lifestyle, and medical
factors. Of particular interest here, these included education, ethnicity, family history of prostate
cancer, diet, alcohol, coffee and tea consumption, and smoking history. In addition, the prostate cancer
screening history by prostatic specific antigen (PSA) and/or digital rectal exam (DRE) was collected.
Tumour Gleason scores were extracted from pathology reports of prostate biopsies at diagnosis.
Dietary information was collected using a 63-item food frequency questionnaire (FFQ) based on a
validated instrument used by the Canadian Cancer Registries Epidemiology Research Group, with
slight modifications to reflect the specificity of the study population [20]. Cases and controls were
asked to report their consumption of food at home, at work, and at restaurants two years prior to the
index date. The consumption of food items, expressed in commonly-used portions, was recorded in
terms of the frequency of use per day, week or month. Dietary data were missing for 13 cases and 3
controls, and 42 controls became cases of prostate cancer during the ascertainment period, leaving
1919 cases and 1991 controls for the analysis. Participants were asked how many months per year they
ate various fresh fruits in order to take into account seasonal variations. Data on lifelong use of coffee,
black tea, green tea, beer, wine, and spirits were collected; levels of use two years before the index date
were retained for the present analyses.
2.3. Statistical Analysis
Each item from the FFQ and the beverage questions (coffee, black tea, green tea, beer, wine and
spirits consumption) was classified into one of four groups based on the NOVA food classification [10,21],
as shown in Table 1.
The first group contains unprocessed or minimally processed foods such as fresh fruits and
vegetables, pasta, and pasteurized milk. The second group includes processed culinary ingredients
such as salt, sugar, maple syrup, vegetable oils, and butter. The third group consists of processed foods
such as cheese, fruits in syrup, beer, cider, and wine. The fourth group is constituted of ultra-processed
foods and drink products such as breakfast cereals, soft drinks, fruit yogurt, ice cream, chocolate,
candies, pasta dishes, and pizza. As we only had one item in group 2 (butter), we excluded this
grouping from our analysis.
We calculated a consumption score for each of groups 1, 3, and 4. This was done by summing the
weekly frequency of use of foods in the FFQ corresponding to a given group, then dividing by the
frequency of use of all FFQ food items consumed per week. Scores were categorized into quartiles
based on distributions among controls.
Unconditional logistic regression was used to estimate odds ratios (ORs) and 95% confidence
intervals (CIs) for the association between each food group score, in quartiles and prostate cancer
risk, overall and by tumour aggressiveness. The latter was defined using the Gleason score. Risk of
low-grade (Gleason scores 2 years before index date, never
screened, do not know), marital status (married and common law, separated and divorced, single,
widower, member of a religious order, do not know), income (80,000$CAD), diabetes (yes, no, do not know), body mass
index (BMI, continuous), total calories (kcal/day, continuous), and physical activity (not very active,
moderately active, and very active). The total effect (shown in pink in Figure 1) closes all biasing pathsNutrients 2020, 12, 637 4 of 12
and leaves all causal paths opened. A minimal model included age, education, ethnicity, and marital
status. We chose to present here results based on a more etiologically relevant model, which includes
age, education, ethnicity, first-degree family history of prostate cancer, and timing of last prostate
screening test. Continuous variables were treated as such after confirming the linearity of the logits, or
as categorical otherwise. The covariates included in the adjusted model presented few missing values,
which were modeled as a separate category.
Table 1. NOVA food groups 1 and corresponding foods from the food frequency questionnaire in the
Prostate Cancer and Environment Study (PROtEuS).
NOVA Food Group 1: Unprocessed or Minimally Processed Foods
Examples of
Fresh fruits and vegetables, herbs, legumes, meat, poultry, fish, eggs, pasteurized milk,
foods in NOVA
plain yogurt, tea, coffee, oats
group
Banana, apple, orange, peaches, apricots, cantaloupe, watermelon, berries, potatoes, sweet
Foods from the potatoes, legumes, broccoli, carrots, spinach, cabbage, cauliflower, dark lettuce, tomatoes,
FFQ 2 sweet red pepper, beef, pork, chicken, veal, lamb, liver, fish, eggs, rice, oatmeal, milk,
cream, tea, coffee
NOVA Food Group 2: Processed Culinary Ingredients
Examples of
foods in NOVA Salt, sugar, maple syrup, vegetable oils, butter
group
Foods from the
Butter
FFQ
NOVA Food Group 3: Processed Foods
Examples of
foods in NOVA Cheese, fruits in syrup, beer, cider, wine
group
Foods from the Tomato soup, vegetable soup, tofu, meat grilled on the barbeque, spaghetti, cheese, nuts,
FFQ beer, wine
NOVA Food Group 4: Ultra-Processed Foods
Examples of
Breakfast cereals, soft drinks, spirits, fruit yogurt, ice cream, chocolate, candies, pasta
foods in NOVA
dishes, pizza, sausages, pastries, cakes, pre-prepared pasta
group
Fried potatoes, ketchup, salsa, salad dressing, mayonnaise, hot-dog, cheese macaroni,
Foods from the pizza, cookies, muffins, white bread, brown bread, breakfast cereal, real juice, tomato juice,
FFQ dark carbonated soft, drinks, other carbonated soft drinks, margarine, fried food, chips,
chocolate, yogurt, ice cream
1Monteiro, C.A.; Cannon, G.; Levy, R.B.; Moubarac, J.-C.; Jaime, P.; Martins, A.P.; Canella, D.; Louzada, M.L.; Parra,
D.; with Ricardo, C., et al. NOVA. The star shines bright. World Nutrition 2016, 7, 28–38. 2 FFQ, food frequency
questionnaire in PROtEuS.
In order to evaluate the possible impact of latent prostate cancers in our control series, we
conducted a sensitivity analysis, excluding controls that were not screened for prostate cancer within
the previous two years.Nutrients 2018, 10, x FOR PEER REVIEW 5 of 11
Nutrients 2020, 12, 637 5 of 12
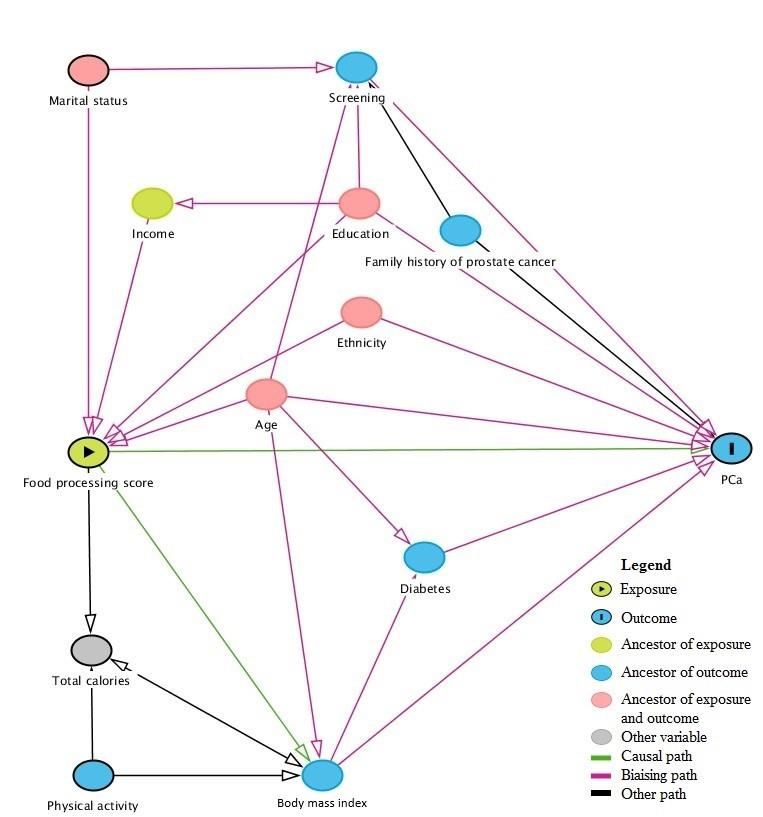
Figure
Figure1.1.Directed
Directed acyclic graph
graph(DAG)
(DAG)for
forthethe association
association between
between foodfood processing
processing and prostate
and prostate cancer.
cancer.
3. Results
In order to evaluate the possible impact of latent prostate cancers in our control series, we
3.1. Study Population
conducted a sensitivity analysis, excluding controls that were not screened for prostate cancer within
The characteristics
the previous two years. of 1919 cases and 1991 controls are displayed in Table 2.
Compared to controls, cases were slightly younger by about one year (owing to the longer time
3.toResults
recruit controls), less educated, more often of European or African ancestries, while less often of
Asian or Greater Middle Eastern ancestries, and a greater proportion had a first-degree family history
3.1. Study Population
of prostate cancer. Most controls (76%) had gone through a screening test carried out by PSA and/or
DREThewithin the previous
characteristics of two
1919years.
cases There were
and 1991 little differences
controls in terms
are displayed of family
in Table 2. income, education,
cigarette smoking, physical activity, and total calories intake two years before the index date.Nutrients 2020, 12, 637 6 of 12
Table 2. Selected characteristics of cases and controls participating in PROtEuS, Montreal, Canada
(2005–2012).
Characteristics Cases (n = 1919) Controls (n = 1991)
Age in years, mean (SD) 64 (7) 65 (7)
Ethnicity, n (%)
French 1316 (69) 1154 (58)
Black 126 (7) 86 (4)
Asian 22 (1) 67 (3)
Other European 371 (19) 530 (27)
Greater Middle Eastern 42 (2) 100 (5)
Latino 33 (2) 31 (2)
Family income in $ CAD, n (%)
80,000 425 (22) 428 (22)
Unknown 142 (7) 194 (10)
Education, n (%)
Primary school of less 443 (23) 426 (21)
High school 572 (30) 578 (29)
College 313 (16) 375 (19)
University 588 (31) 610 (31)
Other 3 (0.2) 2 (0.1)
Body mass index 2 years ago (kg/m2 ), mean (SD) 26.8 (4) 27.1 (4)
Ever smoked, n (%)
No 514 (27) 514 (26)
Yes 1404 (73) 1477 (74)
Overall physical activity, n (%)
Not very active 431 (23) 488 (25)
Moderately active 522 (27) 558 (28)
Very active 965 (50) 945 (47)
Timing of last prostate screening test by PSA 1 or DRE 2 , n (%)
5 years before index date 0 (0) 81 (4)
Never screened 2 (0.1) 190 (10)
Unknown 13 (0.7) 56 (3)
First-degree relative with prostate cancer, n (%)
No 1409 (73) 1736 (87)
Yes 447 (23) 199 (10)
Total calories/day 2 years before index date, mean
(SD) 1989 (663) 1917 (646)
History of type 2 diabetes, n (%)
No 1627 (85) 1593 (80)
Yes 289 (15) 395 (20)
1 PSA, prostatic specific antigen. 2 DRE, digital rectal exam.
3.2. Association between Food Classification and Prostate Cancer Risk
Table 3 present results for the association between the consumption of foods according to different
categories of food processing and the risk of prostate cancer, overall and by disease aggressiveness,
after adjusting for potential confounders identified in the DAG.Nutrients 2020, 12, 637 7 of 12
Table 3. Adjusted 1 odds ratios (ORs) and 95% confidence intervals (CIs) for the association between food processing scores and prostate cancer risk in PROtEuS,
Montreal, Canada (2005–2012).
Consumption Score by All Prostate Cancers 1917 Low-Grade Prostate Cancers 3 High-Grade Prostate Cancers 4
1991 Controls n
Category of Food Processing 2 Cases 5 n Cases OR (95% CI) 1386 Cases n Cases OR (95% CI) 530 Cases n Cases OR (95% CI)
Unprocessed/minimally
processed foods
Q1 (lower score) 498 527, 1.00 (reference) 376, 1.00 (reference) 150, 1.00 (reference)
Q2 497 509, 0.98 (0.81–1.19) 362, 0.97 (0.78–1.20) 146, 1.01 (0.77–1.32)
Q3 498 497, 0.95 (0.78–1.15) 366, 0.98 (0.79–1.21) 130, 0.88 (0.67–1.17)
Q4 (higher score) 498 386, 0.86 (0.70–1.07) 282, 0.90 (0.71–1.12) 104, 0.80 (0.59–1.08)
Processed foods
Q1 (lower score) 498 527, 1.00 (reference) 376, 1.00 (reference) 150, 1.00 (reference)
Q2 497 486, 1.18 (0.96–1.45) 346, 1.18 (0.94–1.47) 140, 1.20 (0.90–1.61)
Q3 498 484, 1.09 (0.89–1.34) 361, 1.13 (0.90–1.41) 121, 1.13 (0.90–1.41)
Q4 (higher score) 498 533, 1.29 (1.05–1.59) 381, 1.27 (1.02–1.60) 151, 1.33 (0.99–1.78)
Ultra-processed foods
Q1 (lower score) 498 527, 1.00 (reference) 376, 1.00 (reference) 150, 1.00 (reference)
Q2 497 495, 0.86 (0.66–1.11) 367, 0.85 (0.64–1.13) 128, 0.87 (0.59–1.27)
Q3 499 479, 0.95 (0.74–1.22) 342, 0.98 (0.75–1.29) 135, 0.87 (0.61–1.26)
Q4 (higher score) 497 516, 0.92 (0.72–1.17) 364, 0.89 (0.68–1.16) 151, 0.97 (0.68–1.38)
1 Adjusted for age, ethnicity, education, first-degree family history of prostate cancer and timing of last prostate screening. 2 Score taking into account the portions consumed by category of
the NOVA classification presented by quartiles. 3 Prostate cancer cases with a Gleason score of 6 or lower or of 7 with a primary score of 3. 4 Prostate cancer cases with a Gleason score of 7
with a primary score of 4, or 8 or higher. 5 For one case, we had no information on Gleason’s primary and secondary patterns precluding classification into low- or high-grade cancer.Nutrients 2020, 12, 637 8 of 12
Consumption of unprocessed or minimally processed foods showed a slight, inverse association
with prostate cancer overall (OR = 0.86, 95%CI 0.70–1.07, comparing the fourth quartile of the
consumption score to the first). By contrast, a higher consumption of processed foods was associated
with a higher risk of overall prostate cancer (OR = 1.29 and 95%CI = 1.05–1.59, after comparing
the fourth to the first quartile). Finally, consumption of ultra-processed foods and drinks was not
associated with risk.
Results from analyses based on cancer aggressiveness showed a slightly lower risk of high-grade
cancers with consumption of unprocessed/minimally processed foods, as compared to low-grade
tumours. Contrastingly, the risk estimate associated with higher consumption of processed foods was
slightly more pronounced for high- than for low-grade cancers.
In the sensitivity analysis, we excluded controls not screened for prostate cancer in the previous
two years (24%), which were more likely to have an undiagnosed prostate cancer than those who had
recently been screened, meaning results remained largely unchanged (data not shown).
4. Discussion
In this study, we observed that consumption of processed foods was associated with a higher
risk of prostate cancer. Higher levels of consumption of unprocessed or minimally processed foods
was associated with a slightly lower risk of this cancer. To our knowledge, this is the first study to
document such associations.
As the consumption of ultra-processed food increases in industrialized countries, such as
Canada [14], the overall quality of diets decreases. Based on this, we would have expected that the
consumption of ultra-processed foods would have been associated with an increased risk of prostate
cancer. However, similarly to our study, the NutriNet-Santé prospective cohort of 104,980 participants,
including 281 incident cases of prostate cancer, observed no association [13]. In the latter study, the
only one to assess links with cancer, ultra-processed food consumption was associated with higher
overall and breast cancer risks. We expanded on this by examining not only the ultra-processed NOVA
food group but also the unprocessed/minimally processed and processed food groups.
We found that consumption of processed foods was associated with a higher risk of prostate
cancer. This is an original finding. Processed foods are industrial products made by adding salt, sugar,
fat and other foods found in group 2 (processed culinary ingredients) to unprocessed or minimally
processed foods (group 1). Thus, our result pertaining to processed foods might be explained by the
presence of fat, salt, sugar, in processed food along with low fibre and vitamin density. The absence of
an association with ultra-processed foods in our study may possibly indicate that the food items listed
in our FFQ under this food group contained limited amounts of contaminants and additives such as
acrylamide, heterocyclic amines, polycyclic aromatic hydrocarbons, emulsifiers, artificial sweeteners,
and bisphenol A, although it is not possible for us to confirm this.
4.1. Potential Mechanisms
It is noteworthy that consumption of unprocessed or minimally processed foods in our population
included a lot of fruits and vegetables, meat, poultry, fish or seafood, rice, and milk. This would result in
a diet rich in vitamins and antioxidants, with better nutritional value than a diet rich in ultra-processed
food and drink products [14]. Vitamins are essential nutrients for human metabolism [24]. In in vitro
and in vivo experiments [25], vitamin A and retinoids were shown to modulate malignant cell growth
by apoptosis, growth arrest and redifferentiation and in prostate cancer, the homeostasis of vitamin A
and retinoids is altered [26]. Vitamin C is an antioxidant that prevents the formation of reactive oxygen
species (ROS), and has an effect on tumor cells [27,28]. It is possible that 1,25-dihydroxy vitamin
D3 decreases cell proliferation in the prostate [5]. Vitamin E might play a role in cancer defenses
by preventing DNA damage, enhancing DNA repair, and by enhancing the immune response [5].
Vitamin K may initiate apoptosis through a nonoxidative mechanism and might involve transcription
factors [24,29]. Finally, polyphenols, which include a wide family of molecules bearing multipleNutrients 2020, 12, 637 9 of 12
phenolic rings, such as flavonoids and phenolic acids, may have a role in the prevention of cancer by
reducing oxidative stress and inflammation [30,31].
On the other hand, a higher consumption of processed foods was associated with a higher risk of
overall prostate cancer. According to the World Cancer Research Fund and the American Institute
for Research on Cancer, there is currently limited, inconclusive evidence that saturated fatty acids,
mono-unsaturated fatty acids, and poly-unsaturated fatty acids influence the risk of prostate cancer [5].
Nevertheless, prostate cancer development could be related to abnormal steroid receptor signaling
which are composed of lipids. Indeed, recent studies using human prostate regeneration models have
shown a carcinogenic effect of steroids [32]. Thus, a diet rich in fat, compatible with a diet high in
processed foods, could perhaps contribute to the pathogenesis of prostate cancer [33].
4.2. Methodological Considerations
The sample size of our study, including 1919 incident cases, is a definite advantage, thereby
improving the ability to detect potentially modest associations with dietary factors. Despite
this, sub-group analyses such as those based on high-grade cancers can be hampered by limited
statistical power. The participation rate was relatively good as compared to several previous similar
investigations [34]. Nevertheless, non-responses could have introduced a selection bias, although
comparisons of participants and non-participants in terms of census-derived indicators suggested that
this would have been minimal.
Given the retrospective nature of the study, differential recall bias between cases and controls
might have occurred, where participants could have been more attentive to their food consumption
before their diagnosis, and over or under-reported it. The FFQ focused on the two years prior to the
index date, thereby reflecting recent intakes. These would be especially relevant for cancer progression
and for initiation if they reflected stable intakes over several years. While the FFQ necessarily entailed
some degree of misclassification, it is a superior method to food records to assess usual food habits [35].
Misclassification might have occurred when categorizing items from the dietary questionnaire into the
processed food group and the ultra-processed food and drink products group. Indeed, we decided to
classify spaghetti, lasagna, or other pastas with tomato sauce into the processed food group because
we assumed that these foods were a combination of unprocessed or minimally processed foods group
and processed culinary ingredients group, but it might occur that these foods were ultra-processed in
reality. If misclassification occurred, then the ORs for ultra-processed food would have leaned towards
the null value. Another example is that we chose to classified yogurt into the ultra-processes food
because we assumed that it was most often “fruit” yogurt with sugar instead of plain yogurt. As the
plain yogurt is an unprocessed or minimally processed food, misclassification would have attenuated
associations with ultra-processed foods.
From a nutritional point of view, an advantage of studying food processing through food groups
is that it considers that foods are ingested together, as part of meals, rather than being consumed
individually. Nutrients and food combinations can result in food synergy and interactions [36] which in
turn may be associated with health and outcomes. Moreover, food processing may be more amenable
to health promotion and disease prevention than individual nutrients, since food processing is more
closely aligned with overall dietary habits. As a result, it may be more easily translated into public
health recommendations.
5. Conclusions
Our study documents that higher intakes of processed foods are associated with an increased risk
of prostate cancer. This is a noteworthy finding given that food processing is ubiquitous. There was
also suggestion that consumption of unprocessed or minimally processed foods was associated with a
lower risk of this cancer. Finally, these findings are important as they enhance the understanding of the
relation between dietary habits and prostate cancer, which can inform public health recommendations.Nutrients 2020, 12, 637 10 of 12
Author Contributions: K.T. devised and conducted the analysis, interpreted the results and prepared the
manuscript. M.-É.P. designed and conducted the PROtEuS study. M.-É.P. and M.-C.R. contributed to the
interpretation of data and to the writing of the manuscript. All authors have read and approved the final version
of the manuscript.
Funding: This work was supported financially through grants from the Canadian Cancer Society
(13149,19500,19864,19865), the Cancer Research Society, the Fonds de la recherche du Québec—Santé (FRQS),
the FRQS-RRSE, and the Ministère du Développement économique, de l’Innovation et de l’Exportation du
Québec. Marie-Claude Rousseau held a New Investigator Award from the Canadian Institutes of Health Research.
Marie-Elise Parent and Marie-Claude Rousseau held career awards from the FRQS. Karine Trudeau holds a
doctoral training award from the FRQS.
Acknowledgments: The authors would like to acknowledge the entire fieldwork team at the Centre
Armand-Frappier Santé Biotechnologie of the Institut national de la recherche scientifique who were involved in
the data collection for PROtEuS.
Conflicts of Interest: The authors declare no conflict of interest.
References
1. Société Canadienne du Cancer. Comité consultatif de la Société canadienne du cancer. In Statistiques
Canadiennes sur le Cancer 2019; Société Canadienne du Cancer: Toronto, ON, Canada, 2019.
2. Poirier, A.E.; Ruan, Y.; Walter, S.D.; Franco, E.L.; Villeneuve, P.J.; King, W.D.; Volesky, K.D.; O’Sullivan, D.E.;
Friedenreich, C.M.; Brenner, D.R. The future burden of cancer in Canada: Long-term cancer incidence
projections 2013–2042. Cancer Epidemiol. 2019, 59, 199–207. [CrossRef] [PubMed]
3. Hsing, A.W.; Chokkalingam, A.P. Prostate cancer epidemiology. Front. Biosci. 2006, 11, 1388–1413. [CrossRef]
[PubMed]
4. Schottenfeld, D.; Fraumeni, J.F. Cancer Epidemiology and Prevention, 3rd ed.; Oxford University Press: Oxford,
UK, 2006.
5. World Cancer Research Fund International/American Institute for Cancer Research. Diet, Nutrition, Physical
Activity, and Prostate Cancer; Continuous Update Project Report; World Cancer Research Fund International:
London, UK, 2014.
6. Wilson, K.M.; Giovannucci, E.L.; Mucci, L.A. Lifestyle and dietary factors in the prevention of lethal prostate
cancer. Asian J. Androl. 2012, 14, 365–374. [CrossRef] [PubMed]
7. Masko, E.M.; Allott, E.H.; Freedland, S.J. The Relationship between Nutrition and Prostate Cancer: Is More
Always Better? Eur. Urol. 2013, 63, 810–820. [CrossRef] [PubMed]
8. Platz, E.A. Energy imbalance and prostate cancer. J. Nutr. 2002, 132 (Suppl. 11), 3471S–3481S. [CrossRef]
9. Deschasaux, M.; Huybrechts, I.; Murphy, N.; Julia, C.; Hercberg, S.; Srour, B.; Kesse-Guyot, E.; Latino-Martel, P.;
Biessy, C.; Casagrande, C.; et al. Nutritional quality of food as represented by the FSAm-NPS nutrient profiling
system underlying the Nutri-Score label and cancer risk in Europe: Results from the EPIC prospective cohort
study. PLoS Med. 2018, 15, e1002651. [CrossRef]
10. Monteiro, C.A.; Cannon, G.; Levy, R.B.; Moubarac, J.-C.; Jaime, P.; Martins, A.P.; Canella, D.; Louzada, M.L.;
Parra, D.; Ricardo, C.; et al. NOVA. The star shines bright. World Nutr. 2016, 7, 28–38.
11. Monteiro, C.A.; Cannon, G.; Moubarac, J.C.; Levy, R.B.; Louzada, M.L.C.; Jaime, P.C. The UN Decade of
Nutrition, the NOVA food classification and the trouble with ultra-processing. Public Health Nutr. 2018, 21,
5–17. [CrossRef]
12. Rauber, F.; da Costa Louzada, M.L.; Steele, E.M.; Millett, C.; Monteiro, C.A.; Levy, R.B. Ultra-Processed
Food Consumption and Chronic Non-Communicable Diseases-Related Dietary Nutrient Profile in the UK
(2008–2014). Nutrients 2018, 10, 587. [CrossRef]
13. Fiolet, T.; Srour, B.; Sellem, L.; Kesse-Guyot, E.; Alles, B.; Mejean, C.; Deschasaux, M.; Fassier, P.;
Latino-Martel, P.; Beslay, M.; et al. Consumption of ultra-processed foods and cancer risk: Results
from NutriNet-Sante prospective cohort. BMJ 2018, 360, k322. [CrossRef]
14. Moubarac, J.C.; Martins, A.P.; Claro, R.M.; Levy, R.B.; Cannon, G.; Monteiro, C.A. Consumption of
ultra-processed foods and likely impact on human health. Evidence from Canada. Public Health Nutr. 2013,
16, 2240–2248. [CrossRef] [PubMed]
15. Monge, A.; Lajous, M. Ultra-processed foods and cancer. BMJ 2018, 360, k599. [CrossRef]Nutrients 2020, 12, 637 11 of 12
16. Schnabel, L.; Kesse-Guyot, E.; Alles, B.; Touvier, M.; Srour, B.; Hercberg, S.; Buscail, C.; Julia, C. Association
between ultraprocessed food consumption and risk of mortality among middle-aged adults in France. JAMA
Intern. Med. 2019, 179, 490–498. [CrossRef]
17. Rudel, R.A.; Gray, J.M.; Engel, C.L.; Rawsthorne, T.W.; Dodson, R.E.; Ackerman, J.M.; Rizzo, J.; Nudelman, J.L.;
Brody, J.G. Food Packaging and Bisphenol A and Bis(2-Ethyhexyl) Phthalate Exposure: Findings from a
Dietary Intervention. Environ. Health Perspect. 2011, 119, 914–920. [CrossRef] [PubMed]
18. World Cancer Research Fund International/American Institute for Cancer Research. Wholegrains, Vegetables
and Fruit and the Risk of Cancer; Continuous Update Project Expert Report; World Cancer Research Fund
International: London, UK, 2018.
19. Blanc-Lapierre, A.; Spence, A.; Karakiewicz, P.I.; Aprikian, A.; Saad, F.; Parent, M.E. Metabolic syndrome
and prostate cancer risk in a population-based case-control study in Montreal, Canada. BMC Public Health
2015, 15, 913. [CrossRef] [PubMed]
20. Pan, S.Y.; Ugnat, A.M.; Mao, Y.; Wen, S.W.; Johnson, K.C. Canadian Cancer Registries Epidemiology Research
G: A case-control study of diet and the risk of ovarian cancer. Cancer Epidemiol. Biomark. Prev. 2004, 13,
1521–1527.
21. Monteiro, C.A.; Cannon, G.; Levy, R.B.; Moubarac, J.C.; Louzada, M.L.; Rauber, F.; Khandpur, N.; Cediel, G.;
Neri, D.; Martinez-Steele, E.; et al. Ultra-processed foods: What they are and how to identify them. Public
Health Nutr. 2019, 22, 936–941. [CrossRef]
22. Gleason, D.F.; Mellinger, G.T. Prediction of prognosis for prostatic adenocarcinoma by combined histological
grading and clinical staging. J. Urol. 1974, 111, 58–64. [CrossRef]
23. Chan, T.Y.; Partin, A.W.; Walsh, P.C.; Epstein, J.I. Prognostic significance of Gleason score 3+4 versus Gleason
score 4+3 tumor at radical prostatectomy. Urology 2000, 56, 823–827. [CrossRef]
24. Mamede, A.C.; Tavares, S.D.; Abrantes, A.M.; Trindade, J.; Maia, J.M.; Botelho, M.F. The role of vitamins in
cancer: A review. Nutr. Cancer 2011, 63, 479–494. [CrossRef]
25. Lotan, R. Retinoids and apoptosis: Implications for cancer chemoprevention and therapy. J. Natl. Cancer Inst.
1995, 87, 1655–1657. [CrossRef]
26. Fontana, J.A.; Rishi, A.K. Classical and novel retinoids: Their targets in cancer therapy. Leukemia 2002, 16,
463–472. [CrossRef]
27. Heaney, M.L.; Gardner, J.R.; Karasavvas, N.; Golde, D.W.; Scheinberg, D.A.; Smith, E.A.; O’Connor, O.A.
Vitamin C antagonizes the cytotoxic effects of antineoplastic drugs. Cancer Res. 2008, 68, 8031–8038.
[CrossRef]
28. Parent, M.-E.; Richard, H.; Rousseau, M.-C.; Trudeau, K. Vitamin C intake and risk of prostate cancer: The
Montreal PROtEuS Study. Front. Physiol. 2018, 9, 1218. [CrossRef]
29. Cantoni, O.; Fiorani, M.; Cattabeni, F.; Bellomo, G. DNA breakage caused by hydrogen peroxide produced
during the metabolism of 2-methyl-1,4-naphthoquinone (menadione) does not contribute to the cytotoxic
action of the quinone. Biochem. Pharmacol. 1991, 42 (Suppl. 1), S220–S222. [CrossRef]
30. Silva, R.F.M.; Pogacnik, L. Polyphenols from food and natural products: Neuroprotection and safety.
Antioxidants 2020, 9, 61. [CrossRef] [PubMed]
31. Ramirez-Garza, S.L.; Laveriano-Santos, E.P.; Marhuenda-Munoz, M.; Storniolo, C.E.; Tresserra-Rimbau, A.;
Vallverdu-Queralt, A.; Lamuela-Raventos, R.M. Health effects of resveratrol: Results from human intervention
trials. Nutrients 2018, 10, 1892. [CrossRef]
32. Testa, U.; Castelli, G.; Pelosi, E. Cellular and Molecular Mechanisms Underlying Prostate Cancer Development:
Therapeutic Implications. Medicines 2019, 6, 82. [CrossRef]
33. Labbé, D.P.; Zadra, G.; Yang, M.; Reyes, J.M.; Lin, C.Y.; Cacciatore, S.; Ebot, E.M.; Creech, A.L.; Giunchi, F.;
Fiorentino, M.; et al. High-fat diet fuels prostate cancer progression by rewiring the metabolome and
amplifying the MYC program. Nat. Commun. 2019, 10, 4358.
34. Xu, M.; Richardson, L.; Campbell, S.; Pintos, J.; Siemiatycki, J. Response rates in case-control studies of cancer
by era of fieldwork and by characteristics of study design. Ann. Epidemiol. 2018, 28, 385–391. [CrossRef]Nutrients 2020, 12, 637 12 of 12
35. Willet, W. Nutritional Epidemiology, 2nd ed.; Oxford University Press: New York, NY, USA, 1998.
36. Jacobs, D.R., Jr.; Gross, M.D.; Tapsell, L.C. Food synergy: An operational concept for understanding nutrition.
Am. J. Clin. Nutr. 2009, 89, 1543S–1548S. [CrossRef] [PubMed]
© 2020 by the authors. Licensee MDPI, Basel, Switzerland. This article is an open access
article distributed under the terms and conditions of the Creative Commons Attribution
(CC BY) license (http://creativecommons.org/licenses/by/4.0/).You can also read