Fatal Encounters Between Native Americans and the Police - THE CENTER FOR INDIAN COUNTRY DEVELOPMENT
←
→
Page content transcription
If your browser does not render page correctly, please read the page content below
THE CENTER FOR INDIAN COUNTRY DEVELOPMENT

Fatal Encounters Between Native Americans
               and the Police

        CSWEP Summer 2019 Economics Fellow
                Matthew HARVEY

                   March 2020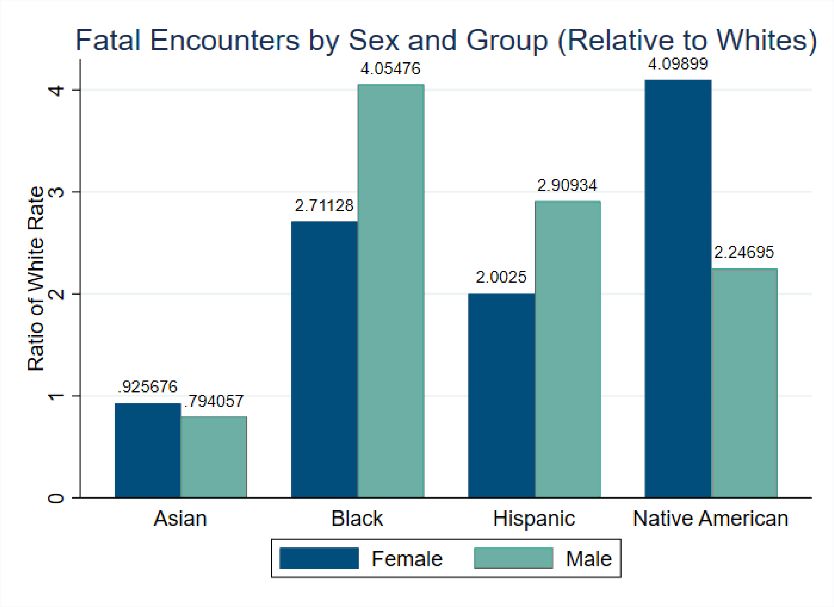
Abstract
           This article documents the number of fatal encounters per population
        for Native Americans across the country and in the Ninth Federal Reserve
        District, which is made up of Minnesota, Montana, North Dakota, South
        Dakota, northwestern Wisconsin, and the Upper Peninsula of Michigan.
        Both male and female Native Americans have more fatal encounters per
        population than their white counterparts. In the Ninth District, Native
        American males have 14 times as many fatal encounters as white males;
        Native American females have 38 times as many fatal encounters as white
        females. Fatal encounters per population for Native Americans are generally
        lower in tribal statistical areas, except for those affected by Public Law 280.

The views expressed here do not reflect those of the Federal Reserve Bank of Minneapolis
                or the Board of Governors of the Federal Reserve System.

                                              2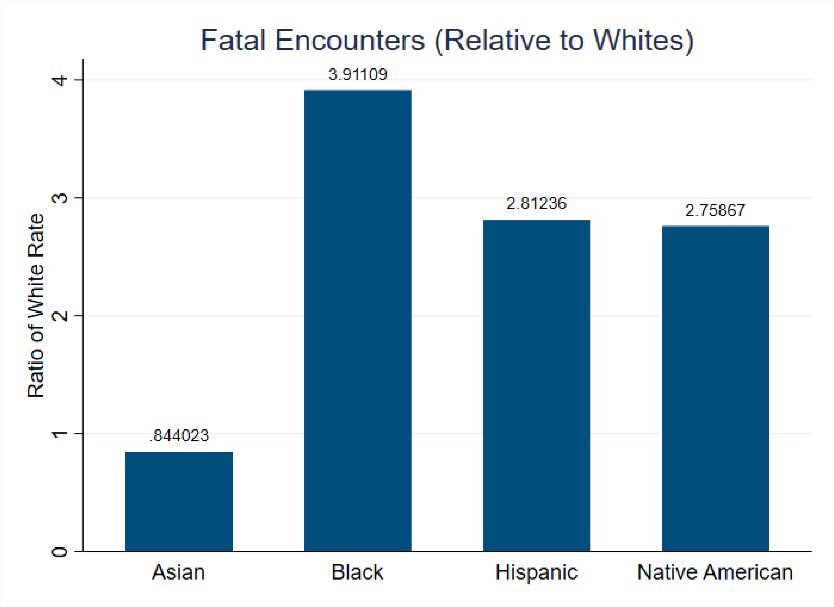
1. Introduction

Most of the discussion of racial bias in policing has centered around black victims of fatal
encounters. Though begun in response to the death of Trayvon Martin, the Black Lives Matter
movement gained increasing attention after the deaths of Eric Garner and Michael Brown (Garza,
2014). Both the movement and subsequent discussions have focused on the policing of black
individuals, particularly men. While attention directed toward police treatment of blacks is certainly
warranted, fatal encounters between police and Native Americans have failed to receive comparable
attention. Despite the high population-adjusted counts of Native American deaths at police hands,
many of these incidents escape media attention (Schroedel and Chin, 2017).
    To my knowledge, this article is the first to present fatal encounter statistics for Native Americans
relative to other groups in the states that make up the Ninth Federal Reserve District (Ninth District).
I also present statistics for Native American fatal encounters in relation to tribal statistical areas
and by Public Law 280 status. I begin by looking at national statistics by minority group and sex.
I then repeat this exercise for the Ninth District. The final section looks specifically at Native
American fatal encounters by tribal statistical area, the jurisdictional agency involved, and Public
Law 280 status.
    In this article, I consider both police-induced deaths (such as a fatal shootings) and police-involved
deaths (such as those where police were involved and the cause of death is an overdose, suicide, or
vehicular), collectively defined as fatal encounters. I discuss how this distinction influences the results
presented and suggest the importance of future research for limiting both police-induced and police-
involved deaths.

2. Background

    Using Centers for Disease Control (CDC) data, Hansen (2017) shows that Native Americans
had the highest population-adjusted rates of fatal encounters with law enforcement of any minority
group from 1995 to 2015. The elevated rates of Native American fatal encounters with officers and
several infamous deaths of Native American individuals sparked the Native Lives Matter movement
(Hansen, 2017). Despite the increased awareness from the movement, police-related deaths for
Native American individuals receive less press. Both Hansen (2017) and Schroedel and Chin
(2017) note that fatal encounters for Native American individuals often garner little media
attention, despite their relatively high population-adjusted frequency.

                                                    3
Bias in interactions between Native Americans and the criminal justice system is not new. A
study conducted in Iowa found that Native American juvenile offenders received harsher
punishments than their white counterparts when controlling for offender background and legal
history (Leiber, 1994). Perry (2006) presented evidence from 278 individual interviews with eight
separate Native Nations that police action toward Native people ranged from ignoring victims to
outright brutality against suspects. A study of police stops in Minneapolis found Native American
individuals experience more stops and searches relative to their population frequency (Busker et
al., 2018). Officers often stop Native American individuals, particularly women, for being
“suspicious persons,” especially in areas with a high Native American population and sex-work
activity (Busker et al., 2018).
Despite evidence of racial bias in police interactions, there is less evidence of bias in police
use of fatal force for any population. For example, Fryer Jr. (2016) uses New York stop-and-
frisk data to show that police officers exhibit racial bias against black and Hispanic suspects in
non-fatal force encounters. However, when Fryer Jr. examined the use of fatal force, he found
no evidence of racial bias (Fryer Jr., 2016). In contrast, Goff et al. (2016) conclude that
controlling for racial disparities in arrest rates, there are racial biases in police use of lethal force,
and the level of bias may even be underestimated.
3. Native Americans and Criminal Law Enforcement
The Reservation System and Delineation of Jurisdiction
To properly discuss police interactions with Native Americans throughout the United States, one
must first discuss the reservation system and trust lands. Reservations are permanent homelands
for Native Americans, initially established through treaties during the eighteenth and nineteenth
centuries between tribal nations and the federal government and later through statutes. In these
treaties, tribal nations ceded vast territories to the federal government in exchange for promises
of protection and support, while reserving for themselves the right to occupy and inhabit smaller
land bases, hence the term “reservation” (as in a reservation of rights). For the United States, the
ostensible goals of the federal reservation system were to both acquire land in the most efficient
manner and avoid hostile interactions between the settlers and Native Americans (Canby Jr.,
2014) (Fletcher, 2016).
4By the late 1880s, under pressure to acquire more land for western expansion, the federal
government sought to reduce the reservation footprint and its treaty obligations. To accomplish
this, Congress passed the General Allotment Act of 1887, also called the Dawes Act, which called
for communally held reservation lands to be allotted into parcels assigned to individual members
of the tribe. The land remaining after allotment, the so-called “surplus lands,” were opened up for
non-Native settlement. Thus, reservations became interspersed with Native and non-Native
landowners, government and private lands, and a mix of jurisdictional authority.
The allotment period ended in 1934 with a new federal policy called the Indian Reorganization
Act that sought to preserve Native-owned landholdings and encourage tribes to put their lands to
productive use and restore self-sufficiency. However, the Dawes Act had resulted in the loss of
more than 90 million acres of Native American land and created a patchwork of land tenure on
reservations. This patchwork of land tenure (fee simple, tribal trust, and individual trust) is
important, because it dictates law enforcement authority: either the tribe and the federal
government, or the tribe and the state government. Tribes generally have criminal jurisdiction
over tribal members on reservation lands, including the authority to establish police forces and to
adjudicate crimes in tribal courts (subject to federal statutory restrictions). States generally have
no criminal jurisdiction on reservation lands—the default authority is the federal government
unless that authority has been otherwise transferred.
Unlike reservations or trust lands, tribal statistical areas are used by the U.S. Census Bureau
to identify a substantial Native American population associated with a geographic area. While
tribal statistical areas are not the same as trust lands or reservations, there is significant overlap
among trust lands, reservations, and tribal statistical areas. Tribal statistical areas often
incorporate more area than reservations or trust lands because they are based on Native American
population rather than legal jurisdiction. Oklahoma is unique in many ways, because it has one of
the largest Native populations in the country, but the status of the reservations there is a legal
issue pending before the U.S. Supreme Court. I treat tribal statistical areas in Oklahoma the same
as all other tribal statistical areas. I use tribal statistical areas as a proxy for trust lands and
reservations because there are no reliable shape files for strictly trust lands.
5Public Law 280: Transfer of Jurisdiction over Reservations from Federal to State
Governments
In 1953, Congress again wanted to reduce its obligations over Indian affairs, both financial and
administrative (Canby Jr., 2014) (Fletcher, 2016). This time, it sought to transfer the federal
government’s civil and criminal jurisdictional responsibilities over individual actions to the states,
which significantly changed the division of legal authority among tribal, federal, and state
governments. Through Public Law 83-280 (commonly referred to as Public Law 280 or PL280),
Congress effectively transferred its criminal and civil jurisdiction over tribal lands to six so-called
“mandatory states”: initially to California, Minnesota, Nebraska, Oregon, and Wisconsin, and
then Alaska upon statehood. PL280 also permitted the other states to acquire jurisdiction at their
option. In 1968, Congress authorized any non-mandatory state to assume civil and/or criminal
jurisdiction over Indian Country within its borders. It also required that tribes consent to the
imposition of such state jurisdiction. No tribe has since consented to the expansion of state
authority over its lands.
PL280 has had several significant impacts in Indian Country, notably: an increased role for
state law enforcement and criminal systems, a virtual elimination of the special federal criminal
justice role (and a consequent diminishment of the relationship between tribes and the federal
government around public safety), numerous obstacles to individual Native Nations in their
development of tribal criminal justice systems, and an increased and confusing state role in civil-
related matters. Consequently, PL280 presents a series of important issues and concerns for Indian
Country crime victims and for those involved in assisting these crime victims.
While PL280 mandated the transfer of federal jurisdiction to the specific states, the tribes
impacted by the law had no choice in the matter. They suddenly had to deal with substantially
increased state authority and state control over a broad range of reservation activities without any
tribal consent or coordination.
Before PL280, the federal government and tribal courts shared jurisdiction over most civil and
criminal matters involving Indians in Indian Country. The states had no jurisdiction. PL280
authorized state criminal jurisdiction over reservation Indians (for offenses involving Native
perpetrators and/or victims). Consequently, tribes saw the erosion of their control over many
criminal and related civil matters within their territories, particularly through the withdrawal of
federal law enforcement services and support. Challenges to the scope of powers given to the
states and the methods of enforcing that authority have persisted.
6PL280 conferred criminal and civil jurisdiction on six specifically listed states, the so-called
mandatory states, as follows:
Mandatory States PL280 Originally Applied to...
California All Indian Country
Minnesota All Indian Country, except the Red Lake Reservation
Nebraska All Indian Country
Oregon All Indian Country, except the Warm Springs Reservation
Wisconsin All Indian Country
Alaska (10) All Indian Country, except the Metlakatla Reservation
criminal jurisdiction
Table 1: List of PL280 mandatory states.
The original exceptions of the Red Lake, Warm Springs, and Metlakatla Reservations were
due to those tribes’ effective objections to being subjected to state jurisdiction (Canby Jr., 2014).
Several tribes have successfully advocated for the retrocession of state jurisdiction back to the
federal government, including the Menominee Tribe in Wisconsin, in connection with the
Menominee Restoration Act; the Winnebago and Omaha Tribes in Nebraska; the Bois Forte Band
of Chippewa in Minnesota; and the Umatilla Tribe in Oregon (partial retrocession jurisdiction
over the Umatilla Reservation.)
While PL280 expanded the realm of non-Indian control over reservation activities through the
application of state criminal laws on Indian reservations and relieved the federal government of
its law enforcement role, it exacerbated the already confusing maze of jurisdiction in Indian
Country. For the purposes of this work, Native people on reservations in PL280 states are more
likely to interact with state and local police forces, rather than tribal police forces. This may have
implications for the use of lethal force.
74. Data
The data for this article come from several sources: the Fatal Encounters database, National
Historical Geographic Information Systems, and the U.S. Census Bureau.
Fatal Encounters
FatalEncounters.org represents an attempt to consolidate all police-induced and police-involved
deaths since 2000 into a single data set. Unlike a database created by the Washington Post, the
Fatal Encounters database contains all police-related deaths, not just shootings. This means that
the data contain civilian deaths where officers were present, but did not employ fatal force. For
example, suicides, drug overdoses, and vehicular deaths appear in the Fatal Encounters data set.
Unlike the CDC data, these data allow users to identify a victim’s precise location. We exploit
this facet of the data to track the location of Native American deaths relative to tribal statistical
areas and to determine all deaths that occurred in the Ninth District.
An examination of fatal encounters as opposed to officer-involved shootings or police use of
fatal force automatically raises the question of officer role. In work not presented here, I create a
ratio of induced over incidental deaths for each group by sex. I count a death as induced if an
individual’s cause of death is: asphyxiated/restrained, beaten/bludgeoned with instrument,
chemical agent/pepper spray, gunshot, or tasered. All other deaths count as incidental: vehicular
deaths, falls from height, overdoses, suicides, etc. For all males, regardless of race, induced deaths
are much more frequent than incidental deaths. For black and white females, induced deaths are
more likely than incidental deaths, while the opposite is true for Native American, Hispanic, and
Asian females. A decomposition of induced and incidental fatalities reveals that most of the
induced fatalities come from shootings, while most of the incidental fatalities are vehicular.
Shootings account for slightly more than 70 percent of the total number of fatal encounters
regardless of group or sex.
The major weakness of the data set is its reporting. The Fatal Encounters data represent the
efforts of a private individual, journalist D. Brian Burghart. He receives and cross-checks record
submissions that he supplements with web scraping, information from police departments, and
death certificates to create the data set’s records. Thus, the data are subject to policy or sentiment
changes that could affect reporting. Conditional on all events being reported, there is still the issue
that there is no race information for many victims or for any of the involved officers. Because of
8this article’s particular interest in Native American individuals, the statistics I present are
conditional on knowledge of the victim’s race. Thus, I drop individuals of unknown race for all
calculations.
For this particular study, the data methodology for determining race is of paramount
importance. While Fatal Encounters relies on photos to determine race for most individuals, for
Native Americans, photos are supplemented with official police reports or news reports, or
obituaries are used to determine a victim’s Native American heritage. It is unlikely that the
creators of news reports or obituaries would have an incentive to misreport racial information,
though such sources may be subject to inconsistencies (Hansen, 2017). However, the same cannot
be said of police reports. In fact, recent evidence suggests that officers often hide ethnicity in
traffic-stop reports to doctor the data (Luh, 2019). If the same issue is occurring in police reports,
then it is definitely possible that the statistics I present are merely the lower bound for fatal
encounters between Native Americans and the police.
For the purposes of this article, I treat Hispanic individuals as a single group; in the subsequent
statistics, Hispanic individuals are a single minority group that I do not further subdivide by race.
The primary reason for this particular grouping is that the Fatal Encounters database lists the race
of Hispanic individuals as “Hispanic.” Thus, the lack of racial information for these individuals
necessitates treating Hispanic individuals as a separate race.
National Historical Geographic Information Systems
I make use of National Historical Geographic Information Systems shape files to map tribal
statistical areas. It is important to note that tribal statistical areas are not the same as reservation
or trust lands. Due to overlap in areas that are trust lands and tribal statistical areas, I use tribal
statistical areas as a proxy for trust lands. I combine this mapping data with the geocoded Fatal
Encounters data to attain population-adjusted counts of fatal encounters for Native Americans.
PL280
In order to determine whether PL280 affects individuals in a tribal statistical area, I use the
information in Table 1 from Anderson and Parker (2008). The law affects individuals on tribal
lands in Alaska, California, Minnesota, Nebraska, Oregon, and Wisconsin; however, there are
numerous tribal lands in these states that were not affected at the time of the law’s passage or
9were later removed from the law’s effects. Using Anderson and Parker (2008) as a guide, I code
tribal statistical areas where PL280 would affect individuals as “PL280.” I code fatal encounters
in tribal statistical areas where individuals would not be affected as “Non-PL280.” Thus, fatal
encounters in Alaska, California, Minnesota, Nebraska, Oregon, and Wisconsin are coded as
“PL280” and “Non-PL280” otherwise. Tribal statistical areas not in these states, but where PL280
applies are coded as “PL280.” Similarly, tribal statistical areas that were retroceded or exempt are
coded as “Non-PL280.” The list of “special cases” is given below.
It is important to note that this article focuses only on the criminal jurisdiction as a result of
PL280 and, in particular, how that relates to where federal, state, local, or tribal police are allowed
to operate.
U.S. Census
I employ U.S. Census Bureau data to construct national and Ninth District population counts by
group and sex. I use annual population estimates for non-census years rather than simply using
the census counts from 2000 and 2010.
PL280 Status
Tribal Land Name PL280 Code
Bois Forte Non-PL280
Devil’s Lake PL280
Flathead Non-PL280
Menominee Non-PL280
Metlakatla Non-PL280
Nez Perce PL280
Omaha Non-PL280
Port Madison PL280
Quinalt PL280
Red Lake Non-PL280
Sac and Fox PL280
Umatilla Non-PL280
Warm Springs Non-PL280
Winnebago Non-PL280
Table 2: Coding of tribal areas as PL280 applying or not when when the application
of the law differs from the general application of PL280 in Alaska, California,
Minnesota, Nebraska, Oregon, or Wisconsin.
105. Totals by Group and Sex
I begin with a comparison of the rate of fatal encounters for minorities to those of whites. The
metric for each group is a result of dividing the number of fatal encounters per hundred thousand
for each minority by the number of fatal encounters per hundred thousand for whites.
Figure 1: This graph depicts the number of fatal encounters per population for each
minority group divided by the number of fatal encounters per population for whites
from 2000 to 2017.
The data in Figure 1 indicate that all minorities except Asians experience more fatal
encounters per population than whites. This discrepancy is largest for blacks, with nearly four
times as many fatal encounters per population as whites. Both Native Americans and Hispanics
have about a 3 to 1 ratio relative to the number of fatal encounters per population for white
individuals. At the national level, Asian individuals actually have slightly fewer fatal encounters
per population than their white counterparts.
11I now take the number of per-population fatal encounters for males and females of each
minority group and divide by the per-population number of fatal encounters for white males and
white females, respectively.
Figure 2: This figure displays the number of fatal encounters per population for each
minority group and sex combination divided by the number of fatal encounters for
whites of the relevant sex from 2000 to 2017.
From Figure 2, one can see both Asian males and females have fewer fatal encounters per
population than their white counterparts. Regardless of sex, all other minority groups have more
fatal encounters per population than white individuals. Most notably, black males and Native
American females have more than 4 times the number of fatal encounters per population as their
white counterparts. The ratios for black males and Native American females are the highest for
males and females, respectively.
It is important to contextualize the above figure with the ratio of induced vs. incidental fatal
encounters for each sex and group pairing. For Native American, Asian, and Hispanic females,
there are more incidental than induced fatal encounters. The fact that Native American females
have such a high ratio relative to their white counterparts is not the result of police use of fatal
force. It is due to a higher rate of incidental deaths that involved police contact.
126. The Role of Location and Criminal Jurisdiction
The Ninth District
Having looked at the national trends, I now restrict the data to just the Ninth District. There is a
large Native American population in the Ninth District; however, the level of fatal encounters per
population in the Ninth District is lower than the national average.
I begin by presenting the ratio of the number of fatal encounters per population for each
minority relative to white individuals. Though the number of fatal encounters per population for
all groups is lower in the Ninth District than at the national level, the divide between Native
Americans and whites is much greater, as Figure 3 indicates.
Figure 3: This figure graphs the number of fatal encounters per population for
minorities over the number of fatal encounters for whites from 2000 to 2017.
All minority groups have more fatal encounters per population than whites. Relative to the
national statistics, the ratio for Asian individuals is much higher and the ratios for Black and
Hispanic individuals are lower in the Ninth District. While the national ratios for Native
Americans and Hispanics are similar, this is not the case in the Ninth District. Native Americans
in the Ninth District have 18 times as many fatal encounters per population as whites.
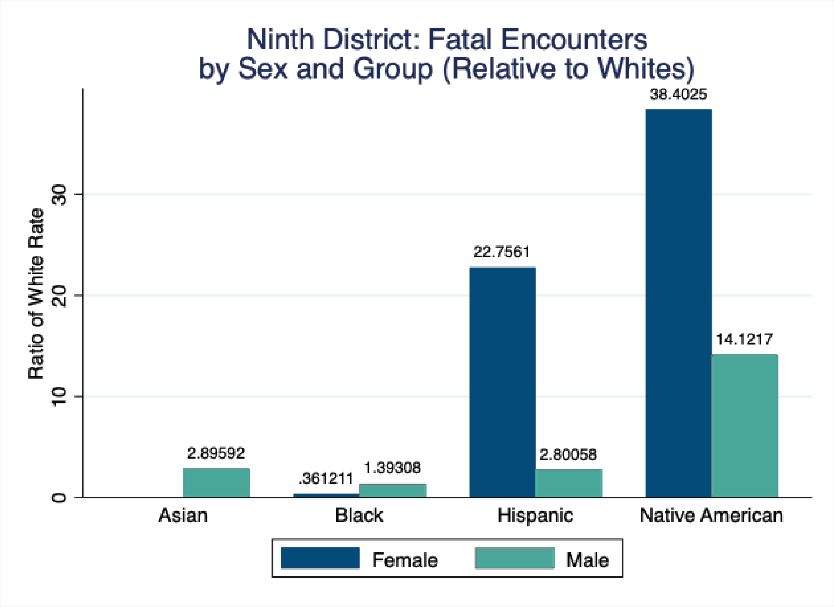
13As with the national statistics, I now subdivide Figure 3 by sex to produce Figure 4.
Figure 4: This figure graphs the number of fatal encounter per population for
minorities over the number of fatal encounters for whites by sex from 2000 to 2017.
Native American women have the highest number of fatal encounters per population, more
than 38 times as many as white females. The ratio for Native American men is more than 14 times
the number of fatal encounters per population for white males. The number of fatal encounters
per population for Hispanic females is similarly high, at more than 22 times the number of fatal
encounters for white females. Black males, Asian males, and Hispanic males also all have higher
numbers of fatal encounters per population than their respective white counterparts. The opposite
is true for Black and Asian females. In fact, for Asian females, from 2000 to 2017 there are no
recorded fatal encounters in the Ninth District.
Though the number of fatal encounters per population is lower than the national average in
the Ninth District, both Figures 3 and 4 indicate a vast disparity for Native American individuals.
Relative to the rest of the nation, the numbers of fatal encounters per population for Native
Americans is much higher. One should also note that the gap between Native American females
and males is about the same size in relative terms for both the nation and the Ninth District.
Recall that for Native American and Hispanic females, incidental deaths outnumber police-
induced deaths. Native American and Hispanic females have more fatal encounters per population
than their white counterparts, but the greater prevalence of fatal encounters is due to something
other than a disproportionate use of fatal force against Native American and Hispanic females.
14Tribal Statistical Area and Agency
Having looked at the rates of fatal encounters at the national level and in the Ninth District, I now
examine fatal encounters specifically for Native Americans. The following map depicts the
United States with an overlay of tribal statistical areas. The black dots represent Native American
fatal encounters with officers. The map shows that many of the fatalities occurred in the Midwest
and West, often adjacent to tribal statistical areas.
Figure 5: This map shows the location of all Native American fatal encounters with
police from 2000 to 2017. Fatal encounters are depicted in black. The grey regions
represent tribal statistical areas.
The map also shows that there is a high concentration of fatal encounters in and around tribal
statistical areas in Oklahoma. Though not presented here, when adjusted for population the counts
in Oklahoma are much lower than the map would suggest due to the greater prevalence of Native
American individuals.*
*
One should also note that Hawaii is omitted from the map because there are no fatal encounters
between Native Americans and officers in Hawaii.
15The table below shows the count of fatal encounters by sex, both within and outside tribal
statistical areas. As the map indicates, there are fewer fatal encounters between 2000 and 2017
within tribal statistical areas for both males and females.
Tribal Statistical Area
Outside In Total
Female 19 10 29
Male 131 79 210
Total 150 89 239
Table 3: This table presents the raw counts of fatal encounters for males and females
within and outside tribal statistical areas from 2000 to 2017.
Despite the sizable ratio of fatal encounters for Native American females to white females,
the overall raw count of fatal encounters for Native American females is only 29, covering a 17-
year period. The ratio of fatal encounters outside tribal statistical areas to in tribal statistical areas
is higher for females than males.
It is possible that some of the disparity in the number of fatal encounters outside tribal
statistical areas is associated with the type of law enforcement agency involved. The number of
fatal encounters may differ among tribal, local, state, or federal agencies. Below, I document the
raw count of Native Americans’ fatal encounters with police by the type of agency. On the whole,
fatal encounters between Native Americans and tribal police occur less often than fatal encounters
between Native Americans and non-tribal police.
Tribal Statistical Area
Agency Outside In Total
Federal 0 7 7
Local 133 37 170
State 13 12 25
Tribal 4 33 37
Total 150 89 239
Table 4: This table presents the raw counts of fatal encounters by agency and location
relative to tribal statistical area from 2000 to 2017.
16Most of the fatal encounters for Native Americans occurred outside tribal statistical areas by
either local or state police, with the highest counts of fatal encounters occurring outside tribal
statistical areas at the hands of local police. Within tribal statistical areas, local police still have
the highest count of fatal encounters, followed by tribal police. There is some anecdotal evidence
from my conversations with multiple federal criminal law experts that tribal police may actually
have lower counts than local forces due to lower contact (Heffelfinger, 2019) (Johnson, 2019).
Tribal police departments are often underfunded, which means both less training and fewer
officers (Heffelfinger, 2019). In some cases, tribal officers must even work alone without a partner
or backup (Heffelfinger, 2019).
Though tribal police do not operate outside tribal lands, on four occasions there were fatal
encounters with a coalition of police forces that included tribal police. All four cases were
incidental vehicular deaths that resulted from chasing suspects.
Further dividing fatal encounters by type and by sex shows that tribal police have fewer
induced and incidental deaths than non-tribal police. Here one might think that the opioid
epidemic would lead to an inflated number of fatal encounters. However, medical emergency only
accounts for one of the fatal encounters.
Cause of Death
Asphyxiated/ Beaten/ Medical Undeter-
Gunshot Tasered Vehicle Total
Restrained Bludgeoned Emergency mined
Agency
Federal 0 0 4 0 0 0 3 7
Local 1 2 136 1 5 1 24 170
State 0 0 20 0 1 0 4 25
Tribal 0 1 28 0 1 0 7 37
Total 1 3 188 1 7 1 38 239
Sex
Female 0 0 14 0 0 0 15 29
Male 1 3 174 1 7 1 23 210
Total 1 3 188 1 7 1 38 239
Table 5: The above table tabulates type of fatality by agency and sex from 2000 to
2017.
17For all causes of death, Native American males have higher counts than females. The gap is
the smallest in instances of vehicular deaths. In fact, more than half of fatal encounters for Native
American females are vehicular in nature. The total counts differ greatly across agency type, yet
within each agency most of the deaths are the result of gunshots or vehicular fatalities. However,
it is worth noting that most of the deaths from beaten/bludgeoned and the only death from
asphyxiated/restrained occured at the hands of local police.
The Role of PL280
The change in criminal jurisdiction as a result of PL280 allows state agencies to operate in Indian
Country (Canby Jr., 2014). In other words, PL280 gives states criminal jurisdiction over Native
Americans in Indian Country in the six mandatory PL280 states (Canby Jr., 2014).
To examine the role of PL280, I use tribal statistical area as a proxy for tribal lands and code
statistical areas outside the six PL280 states as “Non-PL280.” I code tribes that were never under
PL280 but reside in PL280 states as “Non-PL280.” Tribes that gained freedom from the
application of PL280 after its passage are also coded as “Non-PL280.”
PL280 Status
Tribal Statistical Areas PL280 Non-PL280 Total
Counts
Off 55 95 150
On 21 68 89
Total 76 163 239
Number per Population
Off 0.01920 0.02543 0.02317
On 0.00336 0.00196 0.00224
Total 0.01541 0.01564 0.01557
Table 6: The above table shows the counts and rates of Native American fatal
encounters with law enforcement both in and outside tribal statistical areas and by
PL280 status from 2000 to 2017. Areas that were never under PL280 or gained that
exemption count as Non-PL280.
Unsurprisingly, PL280 enforcement does not seem to affect the rate of Native American fatal
encounters, except in tribal statistical areas. While the count of Native American fatal encounters
in tribal statistical areas with PL280 is lower than the count of fatal encounters in exempt tribal
statistical areas, the number of fatal encounters per population is higher. In other words, tribal
18statistical areas with PL280 have a higher number of fatal encounters per population. It is also
noteworthy that outside tribal statistical areas, PL280 is associated with a lower raw and per-
population count of fatal encounters.
It is important to note that the statistics for both the type of agency and PL280 include
Oklahoma. Studies often treat Oklahoma as an outlier and therefore omit it. I have foregone a
formal presentation and discussion of the statistics omitting Oklahoma, because such a change
makes little qualitative difference. If anything, the patterns of fewer fatal encounters in tribal
statistical areas, fewer deaths at the hands of tribal police, and a lower death rate in tribal statistical
areas in PL280-exempt areas become clearer in the absence of Oklahoma data.
7. Conclusion
The rates of fatal encounters for Native American individuals differ substantially by location
and criminal jurisdiction. At the national level, the highest population-adjusted rates of fatal
encounters between Native Americans and police officers occur just outside tribal statistical areas.
Looking specifically at rates in tribal statistical areas, the rates are lower when the area is not
under PL280 enforcement.
A specific examination of the Ninth District shows that relative to their white counterparts,
Native American males have more than 14 times as many population-adjusted fatal encounters
with officers. Native American females have 38 times as many population-adjusted fatal
encounters with officers as white women. Both these ratios eclipse those of other minorities (with
the notable exception of Hispanic women) in the Ninth District.
The stark disparity in fatal encounters for Native American individuals in the Ninth District
warrants further study. Despite lower population-adjusted rates of fatal encounters in the Ninth
District, the gap in rates for Native Americans is sizable. This prompts several questions. What
created this gap in the rates of fatal encounters for Native Americans and their white counterparts?
What causes the higher rates of fatal encounters we observe for Native American women? Why
is this disparity so large, if most of the Native American female deaths are not the result of police
use of fatal force?
The location of fatal encounters for Native American individuals is also a topic that demands
further attention. That many of the encounters occur just outside tribal statistical areas leads one
to wonder if changes in environment or jurisdiction lead to changes in the rates of fatal encounters.
The role of jurisdiction further raises the question of why tribal statistical areas not under PL280
19have lower rates of fatal encounters. Is this difference due to tribe-specific characteristics or
reporting, or is there some facet of the way states operationalize PL280 that explains the difference
in rates?
Though not explicitly explored in this article, the rates of fatal encounters for all races have
been rising since 2014. This rise has been most persistent for Native Americans, with most of the
change coming from an increase in the rates of fatal encounters for males. Such data beg the
question of what is causing this increase in the rate of fatal encounters. Moreover, why are the
rates of fatal encounters for Native American males increasing, while the rates for Native
American females exhibit no trend, yet remain high?
While this work offers no causal conclusions to these questions, my hope is that this will be
the first step in thoughtful examination of the issue of fatal encounters between officers and Native
Americans. Such questions are of paramount importance to Native Americans, the officers who
serve them, and the government’s role as a defender of its citizens and their rights.
20References
Anderson, T.L. and Parker, D.P. (2008). “Sovereignty, Credible Commitments, and Economic
Prosperity on American Indian Reservations.” The Journal of Law and Economics, 51(4):641–666.
Busker, N., Gorsuch, M.M., and Rho, D. (2018). “ American Indian women were disproportionately
stopped, searched and arrested by police in Minneapolis in 2017.” Justice Quarterly, 5.
Canby Jr., W. (2014). American Indian Law in a Nutshell, 6th. West Academic.
Fletcher, M.L.M. (2016). Federal Indian Law. LEG Inc.
Fryer Jr., R.G. (2016). An Empirical Analysis of Racial Differences in Police Use of Force. Technical
report, National Bureau of Economic Research.
Garza, A. (2014). “ A Herstory of the #BlackLivesMatter Movement by Alicia Garza.” The Feminist
Wire, 7.
Goff, P.A., Lloyd, T., Geller, A., Raphael, S., and Glaser, J. (2016). The Science of Justice: Race,
Arrests, and Police Use of Force. Center for Policing Equity.
Hansen, E. (2017). “The forgotten minority in police shootings.” CNN. November 13.
Heffelfinger, T. (2019). Interview. Matthew Harvey.
Johnson, B. (2019). Interview. Matthew Harvey; Jim Colombe.
Leiber, M.J. (1994). “ A Comparison of Juvenile Court Outcomes for Native Americans, African
Americans, and Whites.” Justice Quarterly, 11(2):257–279.
Luh, E. (2019). Not So Black and White: Uncovering Racial Bias from Systematically Masked Police
Reports. Available at SSRN 3357063.
Perry, B. (2006). “ Nobody trusts them! Under- and over-policing Native American communities.”
Critical Criminology, 14(4):411–444.
Schroedel, J.R. and Chin, R.J. (2017). “Whose Lives Matter: The Media’s Failure to Cover Police
Use of Lethal Force Against Native Americans.” Race and Justice, pages 150–175.
21You can also read


