Features of electrical conductivity of complex Cu-Mn-ceria-based electrolytes
←
→
Page content transcription
If your browser does not render page correctly, please read the page content below
Letters on Materials 11 (2), 2021 pp. 152-157                                                       www.lettersonmaterials.com

https://doi.org/10.22226/2410-3535-2021-2-152-157                                                       PACS: 82.33.Pt, 82.45.Gj

                      Features of electrical conductivity of complex
                            Cu-Mn-ceria-based electrolytes
                                   I. V. Zagaynov†, S. V. Fedorov, O. S. Antonova
                                                    igorscience@gmail.com
                                                    †

                       A. A. Baikov Institute of Metallurgy and Materials Science, Moscow, 119334, Russia

Fuel cells are the most efficient means to directly convert stored chemical energy to usable electrical energy (an electrochemical
reaction). Doped ceria is considered to be a promising electrolyte for operation at intermediate temperatures (500 – 600°C).
It has been reported that a reduction of ceria can be neglected at this temperature. However, such temperatures are not suitable
for singly doped ceria as an electrolyte in a SOFC or other devices due to high electrical resistance. Structural modification of
ceria-based solid solutions by co-doping is one of the possible ways to improve their electrical conductivity at this temperature
range. In this work, tri-doped ceria based solid electrolyte materials for intermediate temperature solid oxide fuel cell were
synthesized by the co-precipitation method with sonication. The materials were characterized via thermogravimetric
analysis, X-ray diffraction, scanning electron microscopy, Wagner’s polarization technique, and electrochemical impedance
spectroscopy. The powders were isostatically pressed at 150 MPa and sintered at 1000°C for 4 h in air to form electrolyte
discs for testing. The relative densities of all the samples were more than 90 % after sintering at 1000°C. The electrical
conductivity of these materials was measured by an impedance spectroscopy in the temperature range of 500 – 750°C in air.
The conductivity increased with the increasing oxygen vacancies that were induced by charge compensation. It was shown that
the Cu0.08Mn0.02Nd0.05Ce0.85O2 ceramics can become a promising electrolyte.

Keywords: ceria, electrolyte, ionic conductivity.

                                                                                                               УДК: 544.6.018.4

    Особенности электропроводности сложных электролитов
               на основе Cu-Mn-диоксид церия
                                Загайнов И. В.†, Федоров С. В., Антонова О. С.
             Институт металлургии и материаловедения имени А. А. Байкова РАН, Москва, 119334, Россия

Топливные элементы являются наиболее эффективным средством прямого преобразования накопленной
химической энергии в полезную электрическую энергию (электрохимическая реакция). Допированный диоксид
церия считается перспективным электролитом для работы в среднетемпературных областях (500 – 600°C).
Показано, что при этой температуре восстановлением диоксида церия можно пренебречь. Однако такие тем-
пературы не подходят для однократно допированного диоксида церия в качестве электролита в твердооксидных
топливных элементах (ТОТЭ) или других устройствах из‑за высокого электрического сопротивления. Структурная
модификация твердых растворов на основе диоксида церия путем совместного легирования является одним
из возможных способов улучшения их электропроводности в этом диапазоне температур. В данной работе твердые
электролитные материалы на основе трехкомпонентного диоксида церия для среднетемпературных твердооксид-
ных топливных элементов (ТОТЭ) были синтезированы методом соосаждения с использованием ультразвуко-
вого (УЗ) воздействия. Материалы охарактеризованы с помощью термогравиметрического анализа, дифракции
рентгеновских лучей, сканирующей электронной микроскопии, метода поляризации Вагнера и спектроскопии
электрохимического импеданса. Порошки изостатически прессовали при 150 МПа и спекали при 1000°C в течение
4 ч на воздухе с образованием дисков электролита для испытаний. Относительные плотности всех образцов после
спекания при 1000°C составили более 90 %. Электропроводность этих материалов измерялась методом импедансной
спектроскопии в диапазоне температур 500 – 750°C на воздухе. Электропроводность увеличивалась с увеличением
кислородных вакансий, вызванных компенсацией заряда. Показано, что керамика Cu0.08Mn0.02Nd0.05Ce0.85O2 может
стать перспективным электролитом.
Ключевые слова: диоксид церия, электролит, ионная проводимость.

                                                               152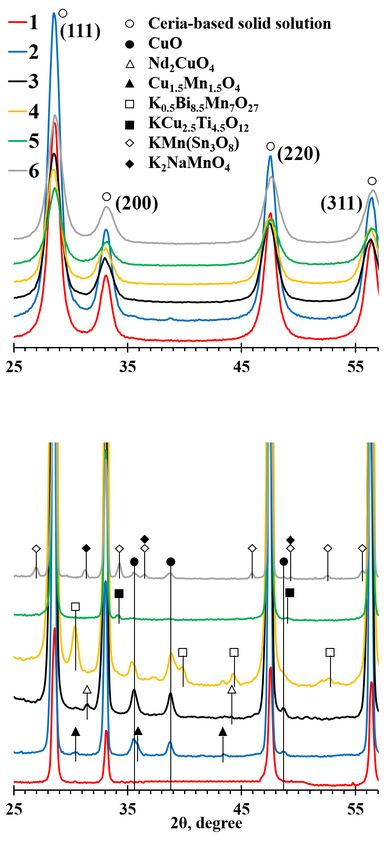
Zagaynov et al. / Letters on Materials 11 (2), 2021 pp. 152-157
1. Introduction synthesized by the co-precipitation method. Stoichiometric
amounts of precursor salts (Ce(NO3)3· 6H2O, Cu(NO3)2∙ 3H2O,
Most attention is paid to the development of electrolytes for Mn(NO3)2 ∙ 4H2O, Nd(NO3)3 ∙ 6H2O, SnCl2 ∙ 6H2O, TiCl4,
intermediate temperature solid oxide fuel cell (IT-SOFC). Bi(NO3)3 ∙ 5H2O, Sm(NO3)3 · 6H2O, Acros Organics, 99.99)
The properties of the electrolyte have a major impact on were dissolved in concentrated nitric acid (68 %) with a total
fuel cell performance, and this electrolyte should have salt concentration of 0.667 M. After dissolution of salts, this
the following characteristics: high oxide ion conductivity mixture was added to distilled water, giving a concentration
(>10−3 S / cm) and low electronic conductivity; excellent of 0.1 M. Then, the co-precipitation was carried out by the
thermal and chemical stability in relation to the reactant addition of 2.5 M KOH solution up to pH =11. Ultrasonic
environment and the contacting electrode materials; low processing (35 kHz, 150 W) was used during the entire
cost and environmentally benign [1, 2]. Until now, two process at 30°C under stirring. The resulting precipitates
routes have been extensively exploited to reduce the ohmic were filtered, washed with distilled water-ethanol solution
resistance of the electrolyte for SOFC: reduction of the (volume ratio of H2O / C2H5OH = 9), dried at 150°C for 12 h
electrolyte thickness and development of new electrolyte and calcined in static air by heating at a rate of 4°C / min from
materials with higher ionic conductivity at intermediate room temperature to 500°C and kept at 500°C for 1 h in a
temperatures [3]. The high operation temperature causes muffle furnace [16,17].
a series of problems including the electrode-electrolyte The as-obtained powders were pressed into pellets (with
interface reactions, anode sintering, difficult sealing material 10 wt.% binder made of 5 wt.% aqueous solution of polyvinyl
selection, and challenging conditions for SOFC assembly. alcohol) with a diameter of 10 mm a thickness of 1 mm at
Ceria-based materials with a fluorite structure and oxygen 150 MPa. The pressed pellets were sintered at 1000°C for 4 h
vacancies resulting from the replacement of Ce4+ with in air with a heating rate of 4°C / min.
trivalent rare-earth ions have been studied extensively as All powders and ceramics were characterized by XRD
electrolytes for IT-SOFC. Typical systems include gadolinia- (DRON-3M, CuKα-radiation). Thermal analyses were
doped ceria (GDC) and samaria-doped ceria (SDC), the performed using TG-DTA (Netzsch STA449F3) and the
conductivities of which are remarkably higher than that of samples were heated to 1300°C at a rate of 10°C / min in air. The
YSZ. The potential of co-doping for the enhancement of the microstructure of the sintered samples was investigated using
ionic conductivity of doped ceria-based electrolytes should SEM-EDS (TESCAN VEGA II SBU with INCA Energy 300
be further explored by selecting suitable co-dopants. Thus, energy dispersive spectrometers). The relative density of each
it is necessary to investigate ceramics based on ceria solid sintered sample was determined by the Archimedes method.
solutions (using low-cost dopants) as a promising electrolyte. Symmetric cells for the impedance studies (Elins Z-350M
The ionic radius of transition metal cations is much smaller impedance meter, the frequency range from 0.1 Hz to 4 MHz
than that of Ce4+, resulting a significant tensile-strained ceria at the amplitude of AC signal of 30 mV) were prepared by
lattice and a decreased oxygen vacancy formation energy [4]. deposition (brushing) of platinum paste onto both sides of
Adding 1– 5 mol.% these oxides into the electrolyte powder the electrolyte pellets, drying at 150°C for 1 h and annealing
could greatly lower the densification temperature and exerts at 900°C for 4 h in air. A platinum wire was used as a current
no corruption on the ionic conductivity. The results of collector. To separate the ionic contribution from the total
studies of the influence on the sintering and the conductivity conductivity, the Wagner’s polarization technique with an
of GDC of cobalt, copper, manganese, iron, bismuth, electrical loader (Solartron 1285A Potentiostat) was used
samarium, titanium, nickel, and other oxides were obtained. to calculate the ionic transport number by imposing an
It is shown that the introduction of these additives in the external fixed DC voltage (1.5 V) across the electrolyte (DC
amount of 1– 5 mol.% significantly increases the rate of current was monitored as a function of time by applying a
shrinkage, reduces the sintering temperature, and increases fixed DC voltage across the symmetric C | electrolyte | C cell).
in the total conductivity [5 –13]. Co-doped ceria exhibits The evidence of the adequacy of the selected models and the
high ionic conductivity compared to solely doped ceria, accuracy of the modeling were included in supplementary
because the co-doping process encourages the formation material.
and mobility of oxygen vacancies. Besides, it was reported
that some dopants reduced the total ionic conductivity 3. Results and Discussion
of co-doped solid electrolytes compared to solely doped
ceria, owing to the high ionic radius mismatch and hence The designation of the samples and their main characteristics
diminishing the formation of oxygen vacancies [14]. are presented in Table 1 (the numbers of the samples in the
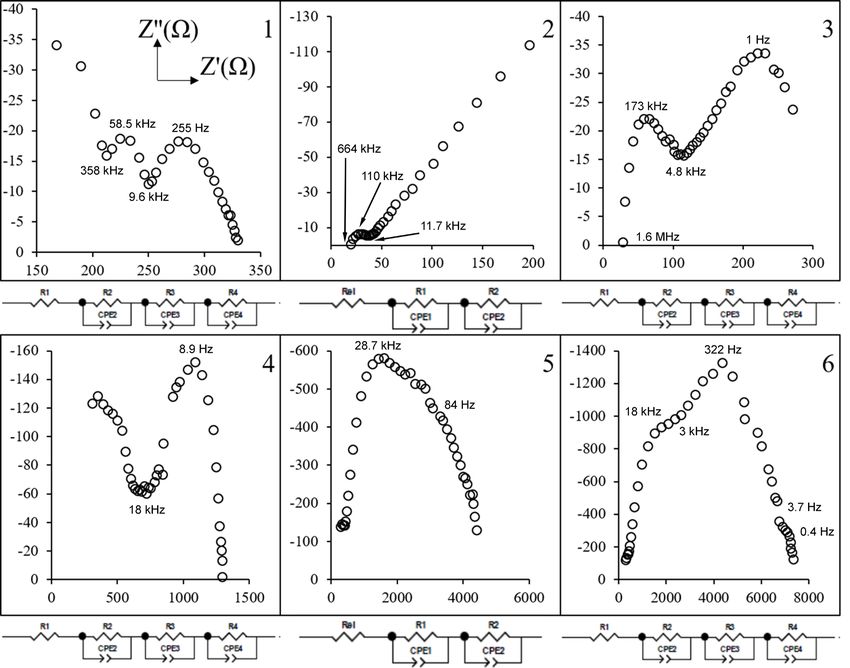
Earlier, a simple and promising electrolyte Cu0.08Mn0.02Ce0.9O2 table and in the figures correspond to each other). Fig. 1a
was proposed [15], which showed good electrical conductivity. shows the XRD spectra of powders where a single fluorite
This paper will show the effect of additives on the indicated phase of ceria was detected that confirms the complete
characteristics of the selected electrolyte and possible further dissolution of dopants into the ceria lattice and also the purity
improvement. of the final products. There are obvious deviations in the
diffraction peak positions, indicating the formation of a solid
2. Material and methods solution. The thermal stability of solid solutions in air was
estimated by the TG-DTA method (Fig. S1, supplementary
Co-doped ceria ceramic powders with different compositions material). The endothermic peak at 1050 –1300°C is
(Cu0.08Mn0.02M0.05Ce0.85O2, where M = Sm, Nd, Bi, Ti, Sn) were associated with the formation of additional phases. XRD
153Zagaynov et al. / Letters on Materials 11 (2), 2021 pp. 152-157
Table 1. Some characteristics of samples: powders (Tcalc = 500°C) and ceramics (Tsint =1000°C).
dXRD, nm a, nm a, nm σ600°C, Relative
No. Sample Ea, eV
(powder) (powder) (ceramics) 10−3 S/cm density, %
1 Cu0.08Mn0.02Ce0.9O2 9 5.4064 5.4092 0.63 1.61 93
2 Cu0.08Mn0.02Sm0.05Ce0.85O2 10 5.4078 5.4093 1.62 0.12 96
3 Cu0.08Mn0.02Nd0.05Ce0.85O2 8 5.4156 5.4174 1.33 1.19 89
4 Cu0.08Mn0.02Bi0.05Ce0.85O2 8 5.4130 5.4102 1.01 0.04 94
5 Cu0.08Mn0.02Ti0.05Ce0.85O2 7 5.4005 5.4092 0.75 0.09 94
6 Cu0.08Mn0.02Sn0.05Ce0.85O2 7 5.3991 5.4087 1.01 0.04 94
*sample numbers in the table and in the figures correspond to each other
pattern of the calcined powders at 1300°C (Fig. 1b) shows
that both phases of the ceria solid solution and other phases
were formed. All peaks reflect the typical fluorite structure of
ceria. In all samples, there is a phase of CuO. Initial system
1 has only this phase, in turn, the spinel Cu1.5Mn1.5O4 is
formed in system 2, indicating that samarium “extrudes”
copper and manganese out of the ceria lattice; while other
dopants form with copper or manganese the corresponding
phases shown in the figure. In general, the addition of a
third dopant, leading to a complication of the solid solution,
reduces the stability of the solid solution (the appearance of
additional phases shifts from 1250 to 1050°C). Therefore,
based on this, a sintering temperature of 1000°C is selected
(Fig. S2, supplementary material). The relative density of
the ceramic obtained at this temperature calculated as the
ratio of the densities determined by hydrostatic weighing
and by XRD data on the basis of cell parameters was more
than 90 % (Table 1). The formation of an additional phase
and its melting at higher temperature range (>1300°C) leads
to densification. The ceria grain was covered by a solidified
melted phase [18].
Scanning electron microscopy (SEM) analysis of a sample a
plays a vital role in the investigation of surface morphologies.
The sintered doped ceria pellet was sputtered with gold
coating in order to enable the SEM characterization. After
sintering at 1000°C for 4 hours, all the sintered samples were
composed of nearly fully dense structures and had a uniform
structure (Fig. 2). This is in good agreement with the relative
density of the samples. The mean grain size was found to be
1 μm according to the SEM results. All samples prepared
from the synthesized powders had good sinterability and
relatively uniform grain size distribution. In samples 1, 2,
and 4, the intercrystalline fracture was observed, and in 3, 5
and 6, it was transcrystalline. Energy dispersive spectroscope
characterization was used to study the elemental distribution
of all the compositions and presence as well as the percentage
of elements within the compositions. The sintering approaches
influence the final ceramics properties, so for this goal EDS
analysis was used to characterize the stability of the chemical
composition being described by the following formulas:
1 — Cu0.083Mn0.023Ce0.894O2, 2 — Cu0.072Mn0.025Sm0.042Ce0.861O2,
3 — Cu0.060Mn0.040Nd0.070Ce0.830O2,4 —Cu0.071Mn0.024Bi0.056Ce0.849O2,
5—Cu0.089Mn0.028Ti0.047Ce0.836O2,6—Cu0.078Mn0.022Sn0.044Ce0.856O2.
In this study, the conductivity of the samples was
calculated from their resistances obtained by the AC b
impedance measurements (Fig. 3). The conductivity without Fig. 1. (Color online) XRD patterns of powders calcined at 500 (top
adding any dopants is higher, which is apparently associated figure) and 1300°C (bottom figure).
154Zagaynov et al. / Letters on Materials 11 (2), 2021 pp. 152-157
Fig. 2. SEM images of cross-sectional fracture surfaces of ceramics (cleavage, scale bar 10 μm).
with low activation energies (Table 1, using the Arrhenius-
Frenkel relation), however, as the temperature rises, the
conductivity of samples 2 and 3 begins to increase rapidly,
and at a temperature of 670 – 700°C it already exceeds.
The conductivity of the electrolyte is related to the relative
density, grain size, and oxygen vacancy concentration [19].
The higher the relative density of the electrolyte, the greater
the conductivity. It is possible that asymmetric voids may
alter the transport properties of oxygen ions and thus
reduce the conductivity. For the electrolyte samples studied
here, the relative density is almost the same, so we ignored
the influence of the relative density on the conductivity.
The influence of the grain size on electrical conductivity
is mainly determined by grain resistance and grain
boundary resistance. When the grain size is too large and
is accompanied by non-uniform growth, a large number of
lattice mismatches is generated in the grain, thus preventing
the movement of oxygen ions (that is, the grain resistance
increases) and reducing the conductivity; when the grain size
is small, the grain boundary resistance will increase, thereby
reducing the conductivity. However, this parameter can be Fig. 3. (Color online) The Arrhenius total conductivity plots of the
ignored as the grain size is almost uniform and the same for doped ceria ceramics.
all samples. It may be attributed to the increase in the defect
interactions, which consequently reduce the mobile oxygen in the ceria lattice as charge compensating defects, which
vacancy concentration, but, as mentioned, with increasing increase the ionic conductivity. The study has shown that
temperature the conductivities are higher than that of doped ceria-based electrolytes exhibit electronic conductivity
sample 1 [6]. Increasing the dopant concentration initially mainly at high temperatures (>900°C). Moreover, the oxide
enhances the ionic conductivity. However, at a certain doping ion transference number of co-doped ceria electrolytes
level, the conductivity reaches its maximum value and then was estimated. For samples 1, 5, 6 this value at 600°C was
decreases due to the low mobility of defect associates. The 0.86 – 0.87, for samples 2, 3 it was 0.94, and for sample 4 it was
extent of formation of these associates increases with the about 0.98. Thus, the increased conductivity of sample 1 is
increasing ionic-radii mismatch of dopant cations with associated with a larger fraction of the electronic component,
respect to the host cation. rather than the oxygen ionic conductivity, which is necessary in
The ionic conductivity is related to the number of oxygen electrolytes. When compared with other electrolytes, sintered
vacancies and the oxide ion mobility. Pure ceria is a poor even at a higher temperature, the electrical conductivity of
oxide ion conductor. However, doping it with trivalent or the developed systems is comparable with samples doped by
divalent dopant cations introduces oxygen vacancies (VO··) REE [20 – 22] at 600°C. However as known, CuO can form
155Zagaynov et al. / Letters on Materials 11 (2), 2021 pp. 152-157
a ceria-CuO in the grain boundary. This phase, can melt at of three or uncompleted semicircle for different samples,
a definite temperature and promote liquid phase sintering. which corresponds to the contribution of the grain, grain
As a consequence, dense bodies can be formed quickly boundary, and electrode polarization, respectively. There is
due to the diffusion of liquid phase under capillary action, no semicircle of the grain interior at high frequencies due to
along with grain rearrangement with an effect on the total the limitation of the frequency range of the test equipment
conductivity, thus creating only a REE-ceria solid solution as (from 0.1 Hz to 4 MHz). The total impedances decreased
an electrolyte [23]. The comprehensive data on the effects on with increasing temperature and shifted to a higher
the electronic and grain boundary transport characteristics frequency (at temperatures of 500 – 750°C). In some samples,
will ameliorate the prediction of the effect of interdiffusion of the contributions of bulk resistance (Rg) and grain boundary
metal cations in complex ceria-based systems. In the future, resistance (Rgb) were not well resolved due to their similar
the effect of different transition metal cations could possibly relaxation times of charge carriers both in the bulk and at
be exploited to improve the performance of ceria-based grain boundaries [24, 25].
materials by deliberately choosing a metal, depending on the
required characteristics of a ceria-based compound (high 4. Conclusions
oxygen ion conductivity, high mixed conductivity, etc.).
The impedance graph of the sintered sample at a The doped ceria electrolytes were successfully prepared
temperature of 600°C is shown in Fig. 4 (and Fig. S3, by a simple co-precipitation method and sintered at a low
supplementary material). Generally, impedance spectra temperature of 1000°C for 4 h in air. In this study, all samples
consist of graphs with real part Z' on the x-axis and had cubic fluorite phases and no secondary phase was
negative imaginary part Z'' on the y-axis known as complex observed in the XRD analysis. It has been shown that using
impedance spectra. The complex impedance plot (Nyquist tri-doped ceria can increase oxygen vacancies, therefore,
plot) of an electrolyte material is generally characterized by demonstrate an increase in the oxygen ionic conductivity
three successive semicircles: grain (bulk) (higher frequency), of the material. Overall results indicate that co-doped ceria
grain boundary (moderate frequency), and electrode (lower sintered at a temperature of 1000°C and below is a promising
frequency) contributions. This figure reveals the presence material for application as solid oxide fuel cell electrolyte.
Fig. 4. Complex impedance spectra of samples at 600°C in air with equivalent circuits.
156Zagaynov et al. / Letters on Materials 11 (2), 2021 pp. 152-157
Supplementary material. The online version of this paper 12. G. Accardo, J. K. Bae, S. P. Yoon. Appl. Sci. 10, 4573 (2020).
contains supplementary material available free of charge at the Crossref
journal's Web site (lettersonmaterials.com). 13. S. Xu, J. Liu, K. Li, Y. Zhou, D. Xu. J. Alloy. Compd. 780,
711 (2019). Crossref
References 14. A. K. Devi, G. Ram kumar, C. Prerna, K. A. Bhabu,
C. Daniel, V. Sabarinathan, T. R. Rajasekaran. JOM
1. D. J. L. Brett, A. Atkinson, N. P. Brandon, S. J. Skinnerd. (2021). Crossref
Chem. Soc. Rev. 37, 1568 (2008). Crossref 15. I. V. Zagaynov, S. V. Fedorov, M. A. Goldberg. Process.
2. J. B. Goodenough. Annu. Rev. Mater. Res. 33, 91 (2003). Appl. Ceram. 13, 244 (2019). Crossref
Crossref 16. I. V. Zagaynov, A. A. Konovalov, E. A. Koneva. Lett. Mater.
3. Z. Shao, M. O. Tadé. Intermediate-Temperature Solid 8 (2), 135 (2018). Crossref
Oxide Fuel Cells: Materials and Applications. Springer 17. I. V. Zagaynov, A. V. Naumkin, Yu. V. Grigoriev. Appl.
(2016) 266 p. Crossref Cat. B. 236, 171 (2018). Crossref
4. Y.‑Q. Su, L. Zhang, V. Muravev, E. J. M. Hensen. 18. Z. Zhang, W. Sigle, M. Rühle, E. Jud, L. J. Gauckler. Acta
Chinese J. Catal. 41, 977 (2020). Crossref Mater. 55, 2907 (2007). Crossref
5. C. Zhang, J. Sunarso, Z. Zhu, S. Wang, S. Liu. Solid State 19. Y. Xue, S. An, S. Li, J. Peng, C. Cai, Y. Liu. J. Solid State
Ionics. 310, 121 (2017). Crossref Electrochem. 24, 1639 (2020). Crossref
6. A. Arabaci. Mater. Sci. Eng. B. 260, 114646 (2020). 20. N. Tian, Y. Qu, H. Men, J. Yu, X. Wang, J. Zheng. Solid
Crossref State Ionics. 351, 115331 (2020). Crossref
7. Y. Dong, S. Hampshire, J. Zhou, X. Dong, B. Lin, G. Meng, 21. J. Koettgen, M. Martin. Am. Ceram. Soc. 103, 3776
J. Eur. Ceram. Soc. 31, 2365 (2011). Crossref (2020). Crossref
8. E. Yu. Pikalova, A. N. Demina, A. K. Demin, 22. N. Jaiswal, K. Tanwar, R. Suman, D. Kumar, S. Upadhyay,
A. A. Murashkina, V. E. Sopernikov, N. O. Esina. Inorg. O. Parkash. J. Alloy. Compd. 781, 984 (2019).
Mater. 43, 735 (2007). Crossref Crossref
9. A. Arabaci. Metall. Mater. Trans. A Phys. Metall. Mater. 23. K. Neuhaus, R. Dolle, H.‑D. Wiemhöfer. J. Electrochem.
Sci. 48, 2282 (2017). Crossref Soc. 167, 044507 (2020). Crossref
10. X. Chen, X. Sun, J. Zhou, D. Zhou, X. Zhu, J. Meng. 24. Y.‑C. Wu, C.‑C. Lin. Int. J. Hydrogen Energ. 39, 7988
Ceram. Int. 46, 22727 (2020). Crossref (2014). Crossref
11. J. Myung, T. H. Shin, X. Huang, G. Carins, J. T. S. Irvine. 25. I. V. Zagaynov, S. V. Fedorov, A. A. Konovalov,
Int. J. Hydrogen Energ. 40, 12003 (2015). Crossref O. S. Antonova. Mater. Lett. 203, 9 (2017). Crossref
157You can also read