Fifteen Years of Genetically Modified Crops in Argentine Agriculture - Eduardo J. Trigo - ChileBIO
←
→
Page content transcription
If your browser does not render page correctly, please read the page content below
Fifteen Years of Genetically
          Modified Crops in
      Argentine Agriculture

                Eduardo J. Trigo

                 November 2011
Fifteen Years of Genetically Modified Crops in Argentine Agriculture

The present study was financed by the Argentine Council for Information and
Development of Biotechnology - ArgenBio

                                            About the author:
Dr. Eduardo J. Trigo is a Senior Researcher with the FORGES Foundation and Grupo CEO, both
institutions focusing on the provision of research and advisory services to the agricultural sector. The
author wishes to thank Dr. Eugenio J. Cap, Director of the Institute of Economics and Sociology of INTA,
for his contributions, suggestions and comments; as well as Federico Villarreal, Associate Researcher
with the FORGES Foundation, for his contribution to developing this document.

                                            About ArgenBio:

ArgenBio (Argentine Council for Information and Development of Biotechnology) is a non-profit
organization whose mission is to disseminate information on biotechnology, contributing to its
understanding through education and promoting its development.

                   This is an English version of the original paper written in Spanish

                                                   2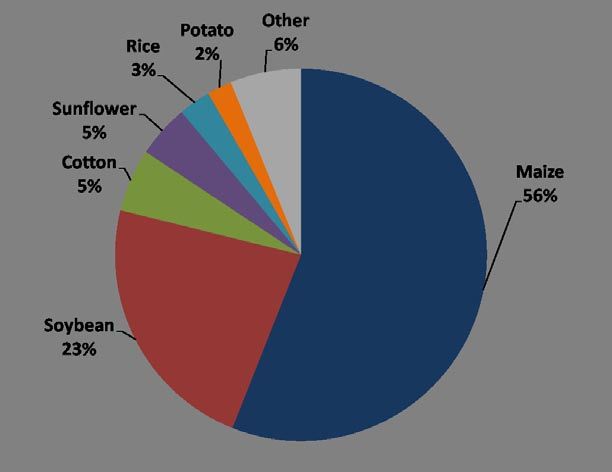
Fifteen Years of Genetically Modified Crops in Argentine Agriculture

                                      TABLE OF CONTENTS
EXECUTIVE SUMMARY                                                                                         4
CHAPTER 1
GM CROPS IN ARGENTINE AGRICULTURE                                                                         6
CHAPTER 2
ECONOMIC IMPACTS OF GM CROPS ON ARGENTINE AGRICULTURE                                                     13
    2.1 Introduction and methodological approach                                                          13
    2.2 GM soybeans: A retrospective analysis of its adoption impacts (1996-2010)                         14
         2.2.1 Direct economic impacts at the national level                                              14
             2.2.1.1 Benefits from the reduction of production costs                                      14
             2.2.1.2 Benefits from the expansion of planted area                                          15
         2.2.2 Impacts at the global level                                                                20
    2.3. GM maize. A retrospective analysis of its adoption impacts (1998-2010)                           22
         2.3.1 Benefits from lepidopteran-resistant (Bt) maize                                            22
         2.3.2 Benefits from lepidopteran-resistant and herbicide-tolerant (Bt+HT) maize                  22
         2.3.3 Summary of impacts from Bt and Bt+HT maize                                                 22
    2.4 GM cotton. A retrospective analysis of its adoption impacts (1998-2010)                           24
         2.4.1 Benefits from lepidopteran-resistant (Bt) cotton                                           24
         2.4.2 Benefits from HT cotton                                                                    24
         2.4.3 Summary of impacts from Bt and HT cotton                                                   24
    2.5. Summary of economic benefits and job creation generated by GM crops                              27
         2.5.1. Summary of economic benefits from GM crops                                                27
         2.5.2. Indirect economic impact at the national level: Job creation                              27
CHAPTER 3
EVENTS STILL PENDING APPROVAL IN ARGENTINA:
A PROSPECTIVE ANALYSIS OF ITS ADOPTION IMPACTS (2011-2022)                                                29
        3.1 Insect-resistant and herbicide-tolerant soybeans (Bt+HT)                                      29
                  3.1.1 Benefits from Bt+HT technology adoption                                           29
                  3.1.2 Summary of impacts                                                                29
        3.2 Drought-tolerant (DT) wheat                                                                   32
                  3.2.1 Benefits from DT technology adoption                                              32
                  3.2.2 Summary of impacts                                                                32
CHAPTER 4
SOME ENVIRONMENTAL IMPACTS FROM NEW TECHNOLOGIES                                                          34
        4.1. Synergies between GM technologies and no-till farming practices                              34
        4.2. Other benefits related to environmental and human health                                     36
        4.3. The impact on soil phosphorus balance in farmland dedicated to growing soybeans              37
CHAPTER 5
THE CHALLENGE OF REMAINING AN EARLY ADOPTER                                                               40
REFERENCES                                                                                                42
APPENDIX I                                                                                                45
APPENDIX II                                                                                               49

                                                  3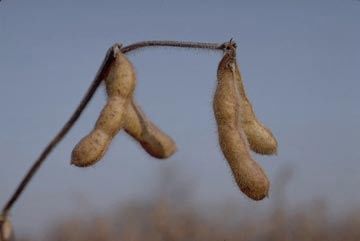
Fifteen Years of Genetically Modified Crops in Argentine Agriculture

                                    EXECUTIVE SUMMARY

        Argentina is one of the leading countries in the use of genetically modified crops in
agriculture, with more than 22 million hectares dedicated to soybeans, maize and cotton crops
using this type of technologies. The process of adoption of GM technologies began in 1996 with
the introduction of glyphosate herbicide-tolerant soybeans, and has evolved until the present
with an almost unprecedented adoption dynamics at world scale that has made GM
technologies to be now used in nearly all soybeans crops, in 86% of maize crops, and 99% of
cotton crops. This process has implied cumulative gross benefits for Argentina amounting to US$
72,645.52 million. Out of that total figure, US$ 65,435.81 million accounted for herbicide-
tolerant soybeans, US$ 5,375 million to (Bt) insect-resistant and herbicide-tolerant maize (single
and combined events) and US$ 1,834 million to insect-resistant and herbicide-tolerant cotton
(single and combined events).
        Additionally to the above-mentioned benefits, it has also been estimated the impact that
GM technologies have had in terms of job creation, between the time of their introduction and
the last crop season (2010/2011). According to estimates made within the 15-year period after
their adoption, total jobs created by the Argentine economy that could be attributed to such
technologies would be over 1.8 million.
        The above-mentioned benefits have been estimated on the basis of a mathematical
model developed by INTA (SIGMA), which uses information obtained from the Technological
Profile Study of the Argentine Agricultural Sector, supplemented by information from MAGyP,
ArgenBio, INDEC and FAO. The model allows the calculation of gross benefits, as well as the
manner in which these benefits have been distributed among the various productive players and
the Government. In this respect, in the case of herbicide-tolerant soybeans, the gross value of
benefits obtained from the reduction of production costs was US$ 3,518.66 million, and from the
expansion of planted area was US$ 61,917.15 million. Regarding the distribution of such
benefits, 72.4% went to farmers, 21.2% to the National Government –through export taxes and
other duties-, and the remaining 6.4% to technology suppliers (seeds and herbicide, distributed
approximately in equal shares). In the case of maize, 68.2% of the cumulative benefits went to
farmers, 11.4% to the National Government, and 20.4% to technology suppliers (with 19% going
to the seed sector). Finally, in the case of cotton, benefits largely went to farmers (96%), with 4%
being distributed to technology providers (3% to seed suppliers and the rest to agrochemical
suppliers).
        Given the importance of Argentine soybeans production worldwide, using the same
information as the one generated for the economic impact analysis concerning Argentina, it has
been estimated the global impact in terms of savings that the adoption of GM technology by
Argentine farmers has had on consumer expenditure (by reducing the global price). The total
cumulative figure for the period 1996-2010 was estimated at about US$ 89 billion which, added
to the cumulative gross benefits in Argentina (US$ 65 billion), would result in a total herbicide-
tolerant soybeans benefits of about US$ 154 billion. In terms of prices, the estimated figures
show that if this adoption process had not occurred, the international price of soybeans in 2011
would have been 14% higher than it actually was.
        This paper is divided into five chapters. Chapter 1, designed to be an introduction,
summarizes the highlights on the process of introduction of genetically modified crops in
Argentine agriculture, through the history of approvals for field trials and commercial plantings,

                                                 4
Fifteen Years of Genetically Modified Crops in Argentine Agriculture

the composition (by crop and trait), and their origin, as well as the adoption dynamics compared
to other technologies of significance at national and international level.
        Chapter 2 represents the core part of this study, which is the analysis of the economic
impact of GM technologies introduced in Argentine agriculture. Based on the same
methodology, Chapter 3 shows an estimate of the potential future benefits that could be
generated from the commercial cultivation of an herbicide-tolerant and insect-resistant soybean
(combined traits) and a drought-tolerant wheat, for three possible scenarios relating to prices
and GM technology adoption. Results show that, if such technologies were released as from the
next crop season, cumulative benefits in the following ten years would amount to US$ 9,131-
26,073 million in the case of soybeans, and US$ 526-1,923 million in the case of wheat,
depending on the different scenarios.
        Chapter 4 analyzes some environmental impacts related to the new technologies, with
emphasis on the particular existing synergy between the expansion of GM varieties and the
practice of no-till farming, as well as the positive impact of the latter on the soil structure and
energy efficiency of agricultural practices. These practices have led to a 38% reduction in fuel
consumption for such crops, as well as a substantial reduction in the use of residual herbicides,
which meant a significant positive impact on the environment. However, these practices have
also raised many questions such as, for example, those associated with the expansion of
soybeans monoculture and the implication of such circumstance in terms of “export” of soil
nutrients, and the expansion of agriculture towards the non-pampean region with more “fragile”
resources. All these aspects are very important and they should be monitored, but there is no
doubt that the herbicide-tolerant + no-till farming package is a compelling alternative regarding
the previous situation, even though it cannot solve by itself all the sustainability problems that
are implied in the process of agricultural intensification.
        Finally, Chapter 5 offers a perspective on past and future benefits as an overall
conclusion to the paper. The emphasis is in the benefits that Argentina has been able to have as
an early adopter of the new technologies and the challenge of maintaining such a position.
Stemming from the information presented throughout this paper, there is a description of the
advantages that Argentina was able to internalize by being at the forefront of such type of
innovative processes and, additionally, of the risks –or opportunity costs- that may affect
Argentina if a process of technology adoption in the future were less dynamic than it has been in
the past. Drifting apart from the innovation frontier may have disturbing consequences for
Argentina, perhaps of a much more serious nature in the future than the impact that the country
may have suffered in the past. Therefore, preserving the early adopter status may seem to be a
strategic matter of discussion, where it should be appropriate to include issues such as
developing mechanisms for commercial releases, promoting investments in the agricultural
sector, and redistributing benefits in the areas of innovation, economic growth and welfare
assistance.

                                                 5
Fifteen Years of Genetically Modified Crops in Argentine Agriculture

                                         CHAPTER 1
                             GM CROPS IN ARGENTINE AGRICULTURE

         The first genetically-modified (GM) crop introduced in Argentine agriculture was
glyphosate herbicide-tolerant soybeans, which was incorporated in the course of the 1996/1997
crop season. However, the process of introducing GM technologies is institutionally rooted in a
previous period, precisely in 1991, when Argentina’s National Advisory Commission on
Agricultural Biotechnology (CONABIA) was created under the scope of the then Secretariat of
Agriculture, Livestock, Fisheries and Food (SAGPyA). At that time, CONABIA was responsible for
the regulatory process governing the testing and commercial release of GM events, and it largely
facilitated that the new technologies be rapidly incorporated into Argentina’s productive
systems. Ever since its inception, within the CONABIA framework, approval has been granted to
1,721 applications for field trials; maize, soybeans, cotton and sunflower being the crops with
the greatest number of executed trials, followed by wheat, rice, potato and forage crops
(alfalfa), among others (Figure 1.1). As to the technology traits (Figure 1.2), there has been a
significant evolution from single traits (herbicide tolerance, insect resistance) to combined traits,
which clearly prevails towards the end of such period, thus showing the trend followed by GM
technologies elsewhere around the world (James, 2010). Finally, as to their origin (Figure 1.3),
there is a clear dominance of foreign technologies, which account for the bulk of field trials all
over the period.

Figure 1.1. Field trials by crop (1991-2010)

Source: Ministry of Agriculture, Livestock and Fisheries

                                                           6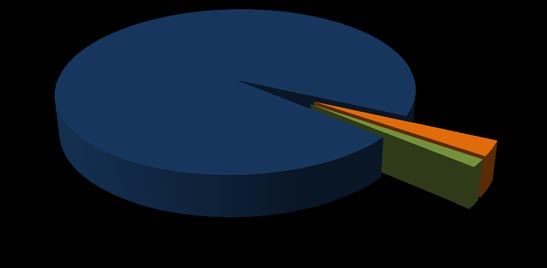
Fifteen Years of Genetically Modified Crops in Argentine Agriculture
Figure 1.2. Evolution of the trait type of GM technologies subject to field trials in Argentina (1991-2010)
250
Number of applications for field trials
200
150
100
50
0
1991
1992
1993
1994
1995
1996
1997
1998
1999
2000
2001
2002
2003
2004
2005
2006
2007
2008
2009
2010
More than one trait Herbicide tolerance Insect resistance Yield Other
Source: The authors, based on data from the Ministry of Agriculture, Livestock and Fisheries
Figure 1.3. Origin of field trials authorized in Argentina (1991-2010)
250
Number applications for field trials
200
150
100
50
0
1991
1992
1993
1994
1995
1996
1997
1998
1999
2000
2001
2002
2003
2004
2005
2006
2007
2008
2009
2010
Private Multinational Private National Public National
Source: The authors, based on data from the Ministry of Agriculture, Livestock and Fisheries
At commercial level, after the approval of the glyphosate-tolerant soybeans, other
twenty events have been approved for planting, food and feed consumption and
commercialization, including 15 maize, 3 cotton and 2 soybeans (Table 1.1). These technologies
were used in nearly 22.9 million hectares in the last crop season (2010/2011), of which 19
million were grown with herbicide-tolerant soybeans, 3.5 with GM maize (1.6 million insect-
resistant, 300 thousand herbicide-tolerant, and 1.6 million having both traits combined); and
614 thousand hectares with GM cotton (56 thousand herbicide-tolerant, 8 thousand insect-
resistant, and 550 thousand having both traits combined) (ArgenBio, 2011). These figures
approximately represent 100%, 86% and 99%, respectively, of the total area grown with each of
these species (Figure 1.4). These numbers put Argentina third, behind the USA and Brazil, as to
7Fifteen Years of Genetically Modified Crops in Argentine Agriculture
GM crop area at world level; India and Canada being the countries ranked in the immediately
following positions (James, 2010).
Table 1.1. GM events authorized for planting, food/feed, and commercialization in Argentina
Crop Traits Applicant Year
Soybeans Glyphosate tolerance (40-3-2) Nidera S. A. 1996
Glufosinate ammonium tolerance (A2704-12) Bayer S.A. 2011
Glufosinate ammonium tolerance (A5547-127) Bayer S.A. 2011
Cotton Lepidopteran resistance (MON 531) Monsanto Argentina S.A.I.C. 1998
Glyphosate tolerance (MON 1445) Monsanto Argentina S.A.I.C. 2001
Lepidopteran resistance and glyphosate tolerance
Monsanto Argentina S.A.I.C. 2009
(MON 531x MON 445)
Maize Lepidopteran resistance (176) Ciba-Geigy S. A. 1998
Lepidopteran resistance (MON 810) Monsanto Argentina S.A.I.C. 1998
Glufosinate ammonium tolerance (T25) AgrEvo S. A. 1998
Lepidopteran resistance (Bt11) Novartis Agrosem S.A. 2001
Glyphosate tolerance (NK 603) Monsanto Argentina S.A.I.C. 2004
Glyphosate tolerance (GA 21) Syngenta Seeds S.A. 2005
Lepidopteran resistance and glufosinate ammonium Dow AgroSciences Argentina
2005
tolerance (TC 1507) S.A., Pioneer Argentina S.A
Lepidopteran resistance and glyphosate tolerance
Monsanto Argentina S.A.I.C. 2007
(NK 603 x MON 810)
Lepidopteran resistance and glufosinate ammonium Dow AgroSciences Argentina
2008
and glyphosate tolerance (1507 x NK 603) S.A., Pioneer Argentina S.R.L.
Lepidopteran resistance and glyphosate tolerance
Syngenta Agro S.A. 2009
(Bt11 x GA21)
Lepidopteran resistance (MON 89034) Monsanto Argentina S.A.I.C. 2010
Glyphosate tolerance and Coleopteran resistance
Monsanto Argentina S.A.I.C. 2010
(MON 88017)
Glyphosate tolerance and Lepidopteran and
Monsanto Argentina S.A.I.C. 2010
Coleopteran resistance (MON 89034 x MON 88017)
Lepidopteran resistance (MIR162) Syngenta Agro S.A. 2011
Lepidopteran resistance and glyphosate tolerance
Syngenta Agro S.A. 2011
(Bt 11 x GA21 x MIR 162)
Source: Ministry of Agriculture, Livestock and Fisheries
8Fifteen Years of Genetically Modified Crops in Argentine Agriculture
Figure 1.4. Evolution of GM crop share in the total area for each crop
100%
80%
60%
40%
20%
0%
96/97 97/98 98/99 99/00 00/01 01/02 02/03 03/04 04/05 05/06 06/07 07/08 08/09 09/10 10/11
Maize Cotton Soybean
Source: ArgenBio
This adoption dynamics represents an almost unprecedented process at world level, only
comparable to what happened with hybrid maize in the State of Iowa (USA) in the 1930s, but
much more expedite than what it occurred with GM technologies in other American Corn Belt
States and, later on, in other parts of the world with the so-called “Green Revolution”
technologies. Even within the Argentine experience, the evolution of the adoption of GM
technologies into productive processes compares very positively against other previous cases,
such as hybrid maize and wheat with Mexican germplasm (Figure 1.5). It took hybrid maize 27
years to reach the percentage of acceptance now enjoyed by GM maize after only 13 years, and
it took Mexican wheat 12 years to be as widely adopted as soybeans in only 4 crop seasons (90%
market share).
9Fifteen Years of Genetically Modified Crops in Argentine Agriculture
Figure 1.5. Rate of adoption for different GM technologies in Argentina and the US
Hybrid maize Wheat with Mexican Bt cotton
Iowa germplasm Argentina
(8 years - 100%) Argentina (13 years - 99%)
100 (12 years -90%)
80
Hybrid maize HT soybean Bt maize
Wisconsin Argentina Argentina
% of the total area
(17 years - 96%) (8 years -100%) (13 years -
86%)
60
Hybrid maize
Argentina
(27 years - 88%)
40
20
0
1932
1935
1938
1941
1944
1947
1950
1953
1956
1959
1962
1965
1968
1971
1974
1977
1980
1983
1986
1989
1992
1995
1998
2001
2004
2007
2010
Source: The authors, based on Trigo and Cap 2006, and ArgenBio 2011
Besides the institutional framework, which, as mentioned, was key for the development
of GM technologies to evolve successfully, other aspects that also had an impact on the
adoption process were the similarity of the agro-ecological conditions for which such
technologies had been developed originally and, upon the emergence of such innovations, the
existence of a consolidated technology services infrastructure, particularly regarding the seed
industry (Trigo et al., 2002; Trigo and Cap, 2006). The similarity of agro-ecological conditions
facilitated the transfer of new concepts, in a clear process of taking advantage of technology
“spillovers”, and the seed industry played a key role in the subsequent and quick spread of the
new technologies, once they were available on the domestic scenario. In this regard, the
commercial success of GM varieties is very much associated with the possibility of incorporating
the new genes into a genetic background that is well adapted agronomically to local conditions,
and the existence of a seed industry able to deliver the new varieties to farmers quickly and
effectively. In the case of Argentina, both conditions were met (Trigo et al., 2002).
By the time the first glyphosate-tolerant soybeans came along, there had been a
significant plant breeding activity in Argentina, both in the public and private sectors, with a
total of 203 registered soybean varieties, about 10% originating in the public sector (mainly
INTA) and the remainder in the private sector which allowed the new genes to be rapidly
incorporated into the productive cycle. From 1996 onwards, there has been a quantitative
10Fifteen Years of Genetically Modified Crops in Argentine Agriculture
leap forward in the number of registered varieties (Figure 1.6), most of them being GM
varieties.
Figure 1.6. Evolution of GM and non-GM soybean varieties in Argentina’s National Registry of Cultivars
(as a % of the total amount)
50
40
30
20
10
0
1990
1991
1992
1993
1994
1995
1996
1997
1998
1999
2000
2001
2002
2003
2004
2005
2006
2007
2008
2009
2010
Non-GM GM
Source: INASE
In the case of maize, the registration process has been similar to the one required for
soybean varieties. As from 1998, GM hybrids started to be registered and, since then, they
became the rule, not the exception, in the Registry of Cultivars (Figure 1.7).
Figure 1.7. Evolution of GM soybean varieties and GM maize hybrids in Argentina’s National Registry of
Cultivars (as a % of the total amount)
90
80
70
60
50
40
30
20
10
0
1996 1997 1998 1999 2000 2001 2002 2003 2004 2005 2006 2007 2008 2009 2010
Maize Soybean
Source: INASE
11Fifteen Years of Genetically Modified Crops in Argentine Agriculture
Finally, the dynamism of the adoption process also reflects the synergy between
herbicide-tolerant soybeans and no-till farming (NTF) 1 practices and, further along the cycle, the
significant drop in the price of glyphosate as a result of the expiration of the patent and the rapid
expansion of the supply sources following such circumstance. Regardless of these technical and
economic aspects, it should also be underscored the role played in this process by the
organizational changes occurring in the agriculture of the Pampas region from the mid-1980s
onwards. In this regard, the widespread use of the so-called “network agricultural” practices
rendered several aspects flexible, such as access to resources (land, knowledge and capital), and
also facilitated a professional management of the agricultural operation and, through such
mechanisms, these practices became a major driver for the adoption of new technologies (Trigo
et al., 2010). This aspect, as well as the environmental impact implications of the existing
synergy among these technologies, will be addressed further on in Chapter 4 of this document.
1
No-till farming (NTF) basically consists in placing the seed in the soil at the required depth with minimal
disturbance to the soil structure. This is performed by using machinery specifically designed for such purpose, which
eliminates the need for plowing and minimizes tillage practices required for implanting the crop.
12Fifteen Years of Genetically Modified Crops in Argentine Agriculture
CHAPTER 2
ECONOMIC IMPACTS OF GM CROPS IN ARGENTINE AGRICULTURE
2.1 Introduction and methodological approach
The analytical tool used to estimate the economic impacts of GM events availability in
Argentina’s agricultural sector is a dynamic simulation model (SIGMA), developed by INTA
(National Institute of Agricultural Technology). The model replicates, through simulations, the
situations that occur in the field in countries like Argentina, that show a great diversity of
technological and productive realities, that cannot be attributed to agro-ecological differences
but to socio-economic factors.
The key component of the model is the replication of the farmer’s adoption process of
technological innovations that introduce changes in the production function, inducing a more
efficient use of resources, which in turn leads to an increase in crop yields and/or to a reduction
in unit costs and/or to an improvement in the quality of the product and/or to an expansion of
the area potentially suitable for its commercial production.
The model may be used for ex-ante and ex-post studies, and the final result is an estimate
of the effects of alternative technology generation and adoption scenarios (regional or national)
on aggregate production. This means that SIGMA calculates social benefits (rather than private
benefits). That is to say, how much more it could be produced (in volume and value) compared
with a defined baseline owing to the adoption (through pathways that vary according to farmer’s
profile) of technologies already available on the market or to be generated in the future by the
R&D system (for further details, see Appendix I).
The data (unbundled at the level of homogeneous agro-ecological zone) used in the
simulation runs included in this Chapter were obtained from the Technological Profile Study of
the Argentine Agricultural Sector (INTA, 2002), supplemented by information taken from the
Ministry of Agriculture, Livestock and Fisheries of Argentina (MAGyP), ArgenBio, the National
Institute for Statistics and Censuses (INDEC), and the United Nations Food and Agriculture
Organization (FAO).
13Fifteen Years of Genetically Modified Crops in Argentine Agriculture
2.2 GM soybeans: A retrospective analysis of its adoption impacts (1996-2010)
2.2.1 Direct economic impacts at the national level
2.2.1.1 Benefits from the reduction of production costs
It was assumed (on a conservative basis because we preferred to underestimate it) that
the adoption of GM varieties containing the glyphosate tolerance gene implies an average cost
reduction amounting to USD 20/ha (Penna and Lema, 2003). This reduction is applicable to both
first-crop and second-crop soybeans (following wheat), and it mainly originates in the
elimination of tilling practices and inputs associated with the use of pre- and post-emergence
selective herbicides, which are indeed required by conventional varieties. These benefits are
applicable to the whole area planted with soybeans every year, always adjusting for the
adoption percentage relevant to each particular year. Table 2.1 presents a summary of
aggregate values at national level.
Table 2.1. Evolution of gross benefits from the adoption of GM soybeans due to the reduction of
production costs
AREA WITH GM
GROSS BENEFITS
SEASON SOYBEANS
(HA) (M USD)*
1996/97 370,000 7.40
1997/98 1.800,000 36.00
1998/99 4.875,396 97.51
1999/00 6,870,511 137.41
2000/01 8,783,542 175.67
2001/02 10,381,943 207.64
2002/03 11,756,084 235.12
2003/04 13,057,989 261.16
2004/05 14,407,585 288.15
2005/06 15,859,058 317.18
2006/07 16,141,337 322.83
2007/08 16,603,525 332.07
2008/09 18,032,805 360.66
2009/10 18,343,272 366.87
2010/11 18,650,000 373.00
TOTAL 1996-2010 3,518.66
*M: million
Source: The authors, based on estimates from ArgenBio, data from the Ministry of Agriculture, Livestock
and Fisheries (MAGyP), and SIGMA v2.0 simulation runs (2011).
14Fifteen Years of Genetically Modified Crops in Argentine Agriculture
2.2.1.2 Benefits from the expansion of planted area
After the approval of the herbicide-tolerant event in 1996, there was a dramatic upward
change in the expansion of the area planted with soybeans. For the period 1971-1996, the area’s
annual increase rate was 3.5%. However, for the period 1996-2010, the rate went up to 9.4%. In
order to estimate the magnitude and evolution of the gross benefits flow resulting from the
adoption of GM soybeans, we have applied a counterfactual approach, contrasting the time-
series of the area actually planted with this oilseed, as published by SAGPyA (Secretariat for
Agriculture, Livestock, Fisheries and Food), and since 2007 by MAGyP (Ministry of Agriculture,
Livestock and Fisheries), with the results of a SIGMA simulation run, with an annual expansion
rate of 3.5% for the whole period (reconstructing a sequence of events that did not occur, due to
the availability of GM materials) (Figure 2.1).
Figure 2.1. Evolution of the actual planted area vs. planted area without the release of GM soybeans,
simulated by SIGMA
21
19 ACTUAL AREA
Million hectares
17 (MAGyP)
15
13
11
9
7 AREA WITHOUT GM
SOYBEAN, SIMULATED
5
1995/96
1996/97
1997/98
1998/99
1999/00
2000/01
2001/02
2002/03
2003/04
2004/05
2005/06
2006/07
2007/08
2008/09
2009/10
2010/11
Source: The authors, based on MAGyP data and SIGMA V2.2 runs (2011)
15Fifteen Years of Genetically Modified Crops in Argentine Agriculture
Table 2.2 shows the evolution of the increase in the area planted with soybeans in the
period 1996-2010, attributable to the adoption of GM materials.
Table 2.2. Actual area planted with soybeans since the introduction of GM varieties (MAGyP data) and
simulated planted area without GM soybeans (SIGMA)
PLANTED AREA (HA)
SIMULATED GM
SEASON
MAGYP WITHOUT GM DIFFERENCE
SOYBEANS
1996/1997 6,669,500 6,291,689 377,811
1997/1998 7,176,250 6,369,623 806,627
1998/1999 8,400,000 7,107,989 1,292,011
1999/2000 8,790,500 6,950,402 1,840,098
2000/2001 10,664,330 8,206,674 2,457,656
2001/2002 11,639,240 8,487,098 3,152,142
2002/2003 12,606,845 8,675,062 3,931,783
2003/2004 14,526,606 9,720,962 4,805,644
2004/2005 14,399,998 8,616,285 5,783,713
2005/2006 15,329,000 8,451,997 6,877,003
2006/2007 16,141,337 8,749,387 7,391,950
2007/2008 16,603,525 9,055,615 7,547,910
2008/2009 18,032,805 9,372,562 8,660,243
2009/2010 18,343,272 9,700,602 8,642,670
2010/2011 18,650,000 10,040,123 8,609,877
Source: The authors, based on MAGyP data and SIGMA V2.2 runs (2011).
16Fifteen Years of Genetically Modified Crops in Argentine Agriculture
Table 2.3 shows the evolution of gross benefits (measured in US dollars) which was
estimated by making, based on average Buenos Aires FOB prices for the period 1996-2010, a
valuation of the production obtained in each crop season that is attributable to the expansion of
the area planted with soybeans as a result of the adoption of GM materials.
Table 2.3. Evolution of gross benefits from the introduction of GM soybeans due to the expansion of
the planted area
PLANTED AREA
YIELD FOB PRICE GROSS BENEFITS
SEASON GM DIFFERENCE
(HA) (T/HA) (USD/T) (M USD)
1996/97 377,811 1.72 296.50 192.81
1997/98 806,627 2.69 221.83 481.99
1998/99 1,292,011 2.45 175.33 553.86
1999/00 1,840,098 2.33 187.42 803.96
2000/01 2,457,656 2.58 171.50 1,089.38
2001/02 3,152,142 2.63 198.00 1,641.70
2002/03 3,931,783 2.80 238.42 2,627.95
2003/04 4,805,644 2.21 268.08 2,843.92
2004/05 5,783,713 2.73 230.67 3,640.17
2005/06 6,877,003 2.64 225.56 4,098.36
2006/07 7,391,950 2.97 270.33 5,936.92
2007/08 7,547,910 2.82 486.00 10,348.23
2008/09 8,660,243 1.85 424.67 6,796.42
2009/10 8,642,670 2.91 362.67 9,105.46
2010/11 8,609,877 2.70 505.33 11,756.02
Total 1996-2010 61,917.15
Source: The authors, based on MAGyP data and results from SIGMA simulation runs (2011).
17Fifteen Years of Genetically Modified Crops in Argentine Agriculture
Table 2.4 shows the evolution, for the period 1996-2010, of gross benefits due to cost
reduction and the expansion of planted area, as well as total gross benefits.
Table 2.4. Evolution of total gross benefits from GM soybeans release
GROSS BENEFITS GROSS BENEFIT DUE
TOTAL GROSS
DUE TO COST TO EXPANSION OF
SEASON BENEFITS
REDUCTION CULTIVABLE AREA
(M USD) (M USD) (M USD)
1996/97 7.40 192.81 200.21
1997/98 36.00 481.99 517.9
1998/99 97.51 553.86 651.37
1999/00 137.41 803.96 941.37
2000/01 175.67 1,089.38 1,265.05
2001/02 207.64 1,641,70 1,849.33
2002/03 235.12 2,627.95 2,863.07
2003/04 261.16 2,843.92 3,105.08
2004/05 288.15 3,640.17 3,928.32
2005/06 317.18 4,098.36 4,415.55
2006/07 322.83 5,936.92 6,259.75
2007/08 332.07 10,348.23 10,680.30
2008/09 360.66 6,796.42 7,157.08
2009/10 366.87 9,105.46 9,472.32
2010/11 373.00 11,756.02 12,129.02
Total 1996-2010 3,518.66 61,917.15 65,435.81
Source: The authors, based on data from SIGMA v2.0 simulation runs (2011).
Table 2.5 shows the distribution of the total gross benefits flow for the period 1996-2010,
among the main sector players: farmers, suppliers of GM technology-related inputs, and the
National Government (revenues from export duties, in full force since the 2002/2003 crop
season).
18Fifteen Years of Genetically Modified Crops in Argentine Agriculture
Table 2.5. Distribution of benefits from GM soybeans
TOTAL GROSS AREA WITH TECHNOLOGY SUPPLIERS NATIONAL
FARMERS
SEASON BENEFITS GM (M USD) GOVERNMENT
(M USD) (ha) (M USD) SEEDS (*) GLYPHOSATE (M USD)
1996/97 200 370,000 189 6 5 -
1997/98 518 1,800,000 467 27 23 -
1998/99 651 4,875,396 526 74 51 -
1999/00 941 6,870,511 722 110 109 -
2000/01 1,265 8,783,542 1,062 72 131 -
2001/02 1,849 10,381,943 1,641 83 125 -
2002/03 2,863 11,756,084 2,132 83 122 526
2003/04 3,105 13,057,989 2,322 94 120 569
2004/05 3,928 14,407,585 2,928 88 184 728
2005/06 4,416 15,859,058 3,296 134 165 820
2006/07 6,260 16,141,337 4,920 234 213 893
2007/08 10,680 16,603,525 8,436 226 287 1,731
2008/09 7,157 18,032,805 3,784 202 240 2,931
2009/10 9,472 18,343,272 6,559 356 190 2,367
2010/11 12,129 18,650,000 8,383 281 154 3,311
2,070 2,121
Total 65,436 47,369 13,876
4,191
PERCENTAGE 72.4% 3.2% 3.2% 21.2%
(*) For the first ten crop seasons, the computed amount was equal to 20% of the area grown with GM soybeans (the
remaining 80% is distributed as follows: proprietary use, 32%, and illegal seed, 48%). However, for the last five crop
seasons, the computed amount was equal to 50% of the area grown with GM soybeans (the remaining 50%
corresponding to proprietary seed use and illegal seed).
Source: The authors, based on data from Márgenes Agropecuarios, Costamagna, O. (2004), National Institute for
Statistics and Censuses (INDEC), and SIGMA v2.0 simulation runs (2011).
19Fifteen Years of Genetically Modified Crops in Argentine Agriculture
Figure 2.2 summarizes the distribution of cumulative gross benefits for the period 1996-
2010, among different players.
Figure 2.2. Distribution of cumulative benefits generated by GM soybeans during the 1996-2010 period.
FARMERS
SEEDS
TECHNOLOGY
3.2%
SUPPLIERS
GLYPHOSATE 6.4%
3.2%
NATIONAL
GOVERNMENT
21.2%
TOTAL BENEFITS 1996-2010: 65.44 BILLION USD
Source: Table 2.5
2.2.2 Impacts at the global level
World soybeans production in 1996 amounted to 130.2 million tons. Cumulative annual
increase for the period 1996-2010 was 959.1 million tons. Considering that the cumulative
soybeans production increase in Argentina attributable to the availability of GM technology was
216.1 million tons (Table 2.6), the adoption of this technology in our country would account for
22.53% of the total amount resulting from world soybeans expansion. But, what is the impact of
this increased volume of soybeans supply on the international price of such oilseed?
The global impact of the adoption of GM soybeans materials in Argentina has been very
significant. Table 2.6 shows the evolution of the contribution to the increase in domestic
soybeans production on the world output attributable to the GM technology package, and
estimates the price effect on the actually observed values. This means that a counterfactual
comparison was made between vectors such as the average FOB prices at Argentine Ports
recorded for the period under study (1996-2010) and the estimates obtained according to the
procedure described in Appendix II. Strictly expressed in terms of savings in consumer
expenditure, the total cumulative figure for the period 1996-2010 reaches USD 89 billion. This
figure should be added to the gross benefits in Argentina estimated in a preceding section (USD
65.44 billion)2, thus reaching an aggregate amount, for the total impact of GM soybeans
technology since its availability in our country, of USD 154.43 billion.
2
According to Trigo and Cap (2006), the increased productivity of sectors that reduced their planted area due to the
expansion of soybeans has exceedingly offset the area reduction and, therefore, gross benefits can approximately
be equal to net benefits.
20Fifteen Years of Genetically Modified Crops in Argentine Agriculture
Table 2.6. Soybeans: Evolution of world production, contribution of Argentina due to GM materials,
impact on world prices, and reduction in consumer expenditure at global level
Δ PRODUCTION FOB IMPACT ON
WORLD Δ CONSUMER
DUE TO GM IN SOYBEANS
SEASON PRODUCTION PRICE EXPENDITURE
ARGENTINA PRICE
(TONS) (TONS) (USD/T) (%) (M USD)
1996/97 130,209,870 774,870 296.50 -0.74 -280.24
1997/98 144,412,830 2,512,725 221.83 -2.17 -970.54
1998/99 160,098,390 3,842,527 175.33 -3.00 -1,088.72
1999/00 157,800,470 4,935,955 187,42 -3.91 -1,028.32
2000/01 161,405,690 7,897,136 171,50 -6.12 -1,895.31
2001/02 177,935,970 10157,698 198.00 -7.14 -2,014,61
2002/03 181,735,440 13,230,491 238.42 -9.10 -2,927,25
2003/04 190,595,630 13,209,410 268.08 -8.66 -3,649,10
2004/05 206,461,490 17,385,401 230.67 -10.53 -6,454,33
2005/06 214,347,289 19,725,414 225.56 -11.39 -5,656,36
2006/07 236,233,000 22,987,589 270.33 -12.16 -7,767.89
2007/08 220,406,000 23,688,477 486.00 -13.43 -14,390.75
2008/09 211,964,000 16,699,679 424.67 -9.85 -8,864.75
2009/10 260,270,000 29,696,480 362.67 -14.26 -13,462.40
2010/11 258,402,000 29,361,930 505.33 -14.20 -18,546.95
Total 1996-2010 2,912,278,069 216,105,782 -88,997.52
Source: The authors, based on data from USDA Official Estimates, MAGyP, and SIGMA v.2.0 simulation runs (2011)
21Fifteen Years of Genetically Modified Crops in Argentine Agriculture
2.3 GM maize. A retrospective analysis of its adoption impacts (1998-2010)3
2.3.1 Benefits from lepidopteran-resistant (Bt) maize
Trigo and Cap (2006) describe the methodological approach and specify in detail the
assumptions used to estimate the benefits of adopting Bt technology for maize. In particular, the
authors consider that the benefit of adopting Bt technology consists in preventing yield losses
caused by the attack of certain pests, mainly Diatraea saccharalis and Spodoptera frugiperda, in
their larval state. This means that the net final result of the crop-pest-Bt germplasm interaction
is a stochastic variable and, therefore, modeling its impact is more complex than in a
deterministic case, like improvements in productivity indicators, reduction in costs or increase in
crop yield, where the random component is associated almost exclusively with “climate risk”,
that is to say, with temperatures on the one hand, as well as time of year and volume of rainfall
on the other.
Ianonne (2002) estimated that, for the “maize-belt” region, the level of damage ranges
between 10 and 50%, depending on the severity of the attack and the time of sowing (the later
the sowing, the more severe the damage; double-cropping maize being the hardest hit). In his
paper, the authors estimated total annual losses for the Pampas region at USD 170 million.
2.3.2 Benefits from lepidopteran-resistant and herbicide-tolerant (Bt+HT) maize
In the case of materials with stacked Bt+HT events, in addition to the Bt maize effects
described in the foregoing section, there is a cost reduction of 20 USD/ha.
2.3.3 Summary of impacts from Bt and Bt+HT maize
Maize with combined Bt+HT events represents an improvement compared to those which
only contain single Bt events and, therefore, starting from the 2007/2008 crop season, there has
been a gradual replacement of Bt with Bt+HT maize, maintaining the desirable features of the
single Bt event. Considering the limitations of the SIGMA simulation model, in the sense of
assuming that the adoption of a technology that improves on the pre-existing state of the art is
irreversible, it was necessary to introduce an adjustment coefficient on the Bt estimated area for
the 2007/2008 – 2010/2011 seasons, in order not to overestimate the impact of the availability
of both technologies, and make the results from simulation runs on the area planted with each
one of the two technology consistent with those reported by ArgenBio.
Table 2.7 shows the evolution of gross benefits generated by the adoption of Bt and
Bt+HT technologies, as well as their distribution among the main sector players: farmers,
suppliers of GM technology-related inputs, and the National Government (revenues from export
duties) (also see Figure 2.3).
3
This paper examines Bt and Bt+HT maize only, since the adoption of maize with single HT events has been little
significant, and its usefulness has rapidly been superseded by maize hybrids with combined Bt+HT events.
22Fifteen Years of Genetically Modified Crops in Argentine Agriculture
Table 2.7. Evolution and distribution of benefits from the adoption of Bt and Bt+HT maize
TOTAL AREA WITH NET BENEFIT (M USD)
GROSS Bt AND
SEASON BENEFITS Bt+HT TECHNOLOGY PROVIDERS NATIONAL
FARMERS
GOVERNMENT
(M USD) (HA) SEEDS (*) GLYPHOSATE
1998/99 8 113,738 5.3 2.3 - 0,0
1999/00 17 270,884 11.2 5.4 - 0,0
2000/01 32 557,665 20.6 11.2 - 0,0
2001/02 48 944,280 43.7 4.7 - 0,0
2002/03 72 1,315,787 33.9 23.7 - 14.4
2003/04 95 1,574,408 36.3 39.4 - 18.9
2004/05 119 1,713,267 36.8 58.3 - 23.8
2005/06 92 1,777,478 20.4 53.3 - 18.4
2006/07 595 2,409,521 402.8 94.0 - 98.1
2007/08 1,131 3,169,328 787.4 180.7 14.2 148.9
2008/09 673 2,621,191 365.6 196.6 28.2 82.9
2009/10 788 2,975,404 479.2 169.6 17.1 122.2
2010/11 1,706 3,176,327 1,422.0 181.1 16.5 86.7
Total 5,375 3,665 1,020 76 614
PERCENTAGE 68.2% 19% 1.4% 11.4%
(*) The benefit to seed suppliers was computed on the basis of the price differential between the GM seed price and
the conventional hybrid maize price, that is to say, the additional direct cost per hectare associated with the
adoption of the new technology available. Source: The authors, based on data from Márgenes Agropecuarios,
MAGyP, Comtrade and SIGMA v2.2 simulation runs (2011)
Figure 2.3. Distribution of cumulative benefits resulting from the adoption of Bt and Bt+HT maize
FARMERS
68.2%
SEEDS
19% TECHNOLOGY
SUPPLIERS
GLYPHOSATE
20.4%
NATIONAL 1.4%
GOVERNMENT
11.4%
TOTAL BENEFITS 1998-2010: 5.38 BILLION USD
Source: Table 2.7
23Fifteen Years of Genetically Modified Crops in Argentine Agriculture
2.4 GM cotton. A retrospective analysis of its adoption impacts (1998-2010)
Due to the limitations of the SIGMA model to reproduce non-trend related changes in the
area devoted to a specific activity, as it has been the case of cotton for the last 13 years (as a
result of price volatility, fierce GM soybeans competition, the occurrence of flooding, etc.), the
analysis was tackled by making an assumption which is a major simplification of the real world
situation: the area grown with cotton remained at 400 thousand hectares throughout the period
under study. Anyway, it is understood that even with such restriction, the simulation of the
adoption paths of both, Bt and HT, technologies is a good approximation to the observed reality
and, if there are errors (as it may probably be the case), the conservative nature of the
parameters entered in the model guarantees that the end result would be an underestimation
rather than overestimation of the magnitude of the impacts.
On the other hand, the short period of time elapsed between the availability of materials
with combined (Bt+HT) events as from the 2008/2009 crop season, made it unadvisable to
perform an ex-post analysis of the impact caused by its adoption which, as it happens with
maize, is characterized by a very quick replacement of single events with combined ones.
Therefore, it was decided not to consider the availability of varieties with combined Bt+HT
events and to simulate the continuity of the paths of adoption of single events. Finally, their
impacts were added up, in the understanding that the values estimated in this way are not
significantly different from the ones generated by the adoption of materials with combined
events.
2.4.1 Benefits of lepidopteran-resistant (Bt) cotton
The analysis was based on the assumption that the adoption of Bt cotton varieties
increases yield by 30%, in line with estimates by Elena (2001).
2.4.2 Benefits of herbicide-tolerant (HT) cotton
The analysis was based on the assumption that the adoption of HT materials reduces
production cost by 30 USD/ha, as a result of herbicide savings, net of the seed price differential.
2.4.3 Summary of impacts from Bt and HT cotton
Table 2.8 shows consolidated figures on the evolution of the area planted with GM
cotton, as well as the resulting benefits attributable to the adoption of GM technologies for the
period under study (1998-2010 for Bt, 2002-2010 for HT, and 2008-2010 for Bt+HT, which almost
completely replaced the previous technologies), and the distribution of benefits between
farmers and technology providers.
24Fifteen Years of Genetically Modified Crops in Argentine Agriculture
Table 2.8. Evolution and distribution of benefits from Bt and HT cotton
GROSS AREA WITH Bt NET BENEFIT (M USD)
SEASON BENEFITS AND HT COTTON TECHNOLOGY PROVIDERS
FARMERS
(M USD) (ha) SEEDS (*) GLYPHOSATE
1998/99 0.09 271 0.08 0.01 -
1999/00 0.34 745 0.33 0.01 -
2000/01 0.81 2,033 0.77 0.04 -
2001/02 1.69 5,449 1.58 0.11 -
2002/03 6.62 14,097 6.34 0.28 -
2003/04 17.09 71,163 15.05 1.34 0.70
2004/05 30.19 147,811 24.93 2.78 2.48
2005/06 63.60 252,835 53.72 4.75 5.12
2006/07 119.06 354,975 109.80 6.67 2.59
2007/08 202.72 426,440 190.36 8.01 4.35
2008/09 206.86 464,948 192.18 8.74 5.94
2009/10 425.06 482,909 413.09 9.07 2.90
2010/11 760.19 491,271 748.44 9.23 2.53
Total 1,834.32 1,756.66 51.05 26.62
PERCENTAGE 96% 3% 1%
(*) For the purposes of calculating the benefits to seed suppliers, 34% of the certified seed value was computed in
order to capture the “brown bag” (illegal seed) effect (estimated to cover 66% of the planted area). The seed costs
for Bt and HT cotton were assumed to be 59.02 and 52.00 USD/ha, respectively, and they were estimated as price
differentials between the conventional seed (15.95 USD/ha), and that of the Bt seed (74.98 USD/ha) and the HT
seed (67.95 USD/ha).
Source: The authors, based on results from SIGMA simulation runs, data from the Economic and Social Council of
Chaco Province, Central Bank of Argentina, and Cueto Rúa, P. (2006), personal communication.
Figure 2.4 shows the distribution of gross benefits generated by the adoption of GM
technologies for cotton, between farmers and suppliers of inputs associated with GM
technologies (seed and herbicide), cumulative in the 1998-2010 period for Bt cotton, and in
2002-2010 for HT cotton. The National Government has not been included as a beneficiary
because, as there are no direct benefits due to the increase in production volume attributable to
GM materials, there were no increases in fiscal revenues (even though one may argue that cost
reduction could marginally expand the planted area, but the magnitude of the impact would be
very small).
25Fifteen Years of Genetically Modified Crops in Argentine Agriculture
Figure 2.4. Distribution of cumulative benefits resulting from the adoption of Bt and HT cotton
FARMERS
96%
SEEDS
3% TECHNOLOGY
SUPPLIERS
GLYPHOSATE1% 4%
Total benefits 1998-2010: 1.83 BILLION USD
Source: Table 2.8
26Fifteen Years of Genetically Modified Crops in Argentine Agriculture
2.5 Summary of economic benefits and job creation generated by GM crops (1996-2010)
2.5.1 Summary of economic benefits from GM crops
Table 2.9 summarizes the economic benefits derived from the adoption of GM crops in
Argentina in the 1996/1997-2010/2011 period.
Table 2.9. Summary of the impacts of GM crop adoption in Argentine agriculture in the 1996/1997-
2010/2011 period
IMPACT AT THE NATIONAL LEVEL MILLION USD
GM SOYBEAN 65,435.81
GM MAIZE 5,375.38
GM COTTON 1,834.32
TOTAL NATIONAL LEVEL 72,645.52
IMPACT AT THE GLOBAL LEVEL
SAVINGS IN CONSUMER EXPENDITURES 88,997.52
TOTAL 161,643.04
Source: Tables 2.4, 2.6, 2.7 and 2.8
2.5.2 Indirect economic impact at the national level: Job creation
This section updates the estimates performed in a previous paper (Trigo and Cap,
2006) but making a methodological change in the approach which does not modify the
assumptions. The most significant assumption refers to the fact that, for each additional dollar in
goods generated by the adoption of GM materials (valued at boder price, that is to say, FOB
price at Argentine Ports), another dollar is generated in the services sector (transportation,
storage, etc).
The calculation procedure, the results of which are summarized in Table 2.10, was the
following: stemming from GDP values at market prices (INDEC, 2011), for each year of the period
under study (1996-2010), the actual “cost” of adding one job to the economy was estimated in
terms of GDP, assuming a baseline stock of 10 million jobs in 1996 with an annual cumulative
increase of 330 thousand, but subtracting 500 thousand and 1 million jobs in 2001 and 2002,
respectively, in order to account for the impact of the crisis prior and subsequent to the collapse
of the fixed peso-dollar exchange rate (pegged at a value of one). Such value, denominated in
pesos, was converted into dollars (1 to 1 since 1996 until 2001 inclusive and, from 2002
onwards, based on the annual average of the dollar/peso exchange rate published by the Central
Bank of Argentina (BCRA). Finally, it was taken the gross value of additional production
27Fifteen Years of Genetically Modified Crops in Argentine Agriculture
estimated for each year as a result of the adoption of GM materials (see Tables 2.4, 2.7 and 2.8),
was multiplied by two and divided by the estimated “cost” of one job for each year. The result
was considered an approximation to the contribution of GM technologies to the creation of jobs
throughout the 15 years under study. The resulting total cumulative figure amounts to 1,817,331
jobs. Should this calculation be correct and accepting the validity of the simplifying assumptions
made, during the most critical years (2001 and 2002), the adoption of this technology
contributed to the alleviation of unemployment (58 thousand jobs created in 2001, and 253
thousand in 2002). Likewise, the consequences of the sharp decline in production volume in
2008, as a result of drought, translated into a significant loss of jobs (371 thousand), even
though the net result had been positive that year due to the performance of other sectors in the
economy. It is likely that the construction sector has had the highest exposure to both positive
impacts in 2001 and 2002, as well as negative ones in 2008.
Table 2.10. Correlation between GDP growth, benefits from GM materials, and job creation
GDP AT TOTAL DOLLAR JOBS
MARKET BENEFITS GM EXCHANGE CREATED BY
YEAR PRICES* CROPS RATE** $/JOB USD/JOB THE
ADOPTION OF
(M $) (M USD) ($/USD) GM CROPS
1996 272,150 200.21 1.00 26,345.57 26,345.57 15,199
1997 292,859 517.99 1.00 26,647.76 26,647.76 23,851
1998 298,948 659.04 1.00 25,660.80 25,660.80 10,993
1999 283,523 958.34 1.00 23,031.93 23,031.93 25,991
2000 284,204 1,297.58 1.00 21,912.39 21,912.39 30,963
2001 268,697 1,899.44 1.00 20,464.33 20.464.33 58,820
2002 312,580 2,941.60 3.09 25,433.70 8,226.53 253,367
2003 375,909 3,216.77 2.94 31,456.85 10,694.46 51,459
2004 447,643 4,077.27 2.94 35,499.08 12,071.78 142,565
2005 531,939 4,571.29 2,92 40,085.81 13,718.62 72,021
2006 654,439 6,973.68 3,07 46,980.54 15,284.85 314,350
2007 812,456 12,014.15 3,11 55,685.80 17.888.15 563,554
2008 1,032,758 8,037.29 3,16 67,721.85 21,437.75 -371,014
2009 1,145,458 10,685.47 3,73 71,996.12 19,320.90 274,126
2010 1,442,655 14,595.40 3.91 87,064.30 22,273.25 351,087
TOTAL NEW JOBS (1996-2010) 1,817,331
*INDEC
**BCRA
Source: The authors, based on data from INDEC, BCRA, and results from SIGMA simulation runs (2011).
28Fifteen Years of Genetically Modified Crops in Argentine Agriculture
CHAPTER 3
EVENTS STILL PENDING APPROVAL IN ARGENTINA:
A PROSPECTIVE ANALYSIS OF ITS ADOPTION IMPACTS (2011-2022)
The previous section evaluated the impacts, both direct and indirect ones, at the national
and global levels of the availability and adoption of GM soybeans, maize and cotton varieties in
Argentina. This section estimates the potential impact of the eventual commercial release and
adoption of soybeans materials with insect resistance and herbicide tolerance (Bt+HT) combined
events (particularly, MON 87701 X MON 89788, also called RR2Y+Bt), as well as a drought
tolerance (DT) wheat event.
In order to perform the simulation runs, the SIGMA mathematical model was used in its
ex-ante version (see Appendix I). In each case, alternative scenarios were defined so as to
account for a wide spectrum of situations that could arise during the simulation horizon (10
years), both in the dynamics of adoption paths by farmers and the performance of international
markets (i.e., changes in prices).
In all scenarios so defined, one single trait was selected, associated with productivity
improvements (due to increase in crop yield and/or reduction in biotic or abiotic losses). The
sources of information were highly qualified experts on the performance of the GM materials in
field trials. When data included a range of productivity increases, the smallest value was selected
so as to minimize the risk of overestimating potential impacts. That is, if the actual (future)
performance of the selected agronomic parameters these would deviate from the estimated
values, these deviations would be in the direction of a bigger impact rather than a smaller one.
3.1 Insect-resistant and glyphosate-tolerant (Bt+HT) soybeans
3.1.1 Benefits from Bt+HT technology adoption
The basic assumption behind all ex-ante simulation runs consists of a 10% increase in the
Bt+HT soybeans yield compared to HT soybeans (GTS 40-3-2 event, under study in Chapter 2).
3.1.2 Summary of impacts
Three scenarios were defined and labeled respectively as conservative, moderate and
optimistic, by using the same parameters and variables contained in the previous section. Table
3.1 summarizes the values assigned to the variables that define the three scenarios.
29Fifteen Years of Genetically Modified Crops in Argentine Agriculture
Table 3.1. Bt+HT soybeans: Conservative, moderate and optimistic scenarios
AVERAGE
TECHNOLOGICAL ADOPTION AREA EXPANSION
SCENARIO ADOPTION PRICE
LEVEL CEILING ANNUAL RATE
TIME
(YEARS) (% OF AREA) (%) (USD/T)
Low 6 60
CONSERVATIVE Medium 5 70 0 300
High 4 90
Low 5 70
MODERATE Medium 4 80 1.5 400
High 3 100
Low 4 80
OPTIMISTIC Medium 3 90 3.5 500
High 2 100
Source: The authors.
Tables 3.2 and 3.3 show the results of expected impacts for each of the three previously-
defined scenarios, in terms of the evolution of production increase, attributable to the adoption
of GM technology and gross benefits for the period under study, respectively.
Table 3.2. Estimation of gross benefits from production increase in the 2011/12-2021/22 period
attributable to the adoption of Bt+HT soybeans in three scenarios
GROSS BENEFITS FROM PRODUCTION GROWTH (M USD)
SEASON
CONSERVATIVE MODERATE OPTIMISTIC
2011/12 - - -
2012/13 37.3 159.2 483.0
2013/14 95.2 368.7 983.9
2014/15 222.7 724.6 1,620.1
2015/16 447.6 1,175.7 2,206.5
2016/17 734.7 1,582.7 2,614.5
2017/18 991.0 1,854.4 2,859.3
2018/19 1,156.6 2.004.9 3,011.6
2019/20 1,241.8 2.086.8 3,123.9
2020/21 1,281.6 2,138.2 3,221.6
2021/22 1,301.1 2,177.6 3,315.5
Total 2011/12 - 2021/22 7,509,6 14,272,9 23,440.0
Source: The authors, based on results from SIGMA v.2.0 simulation runs (2011).
30Fifteen Years of Genetically Modified Crops in Argentine Agriculture
Table 3.3. Estimation of gross benefits from production cost reduction in the 2011/12-2021/22 period
attributable to the adoption of Bt+HT soybeans, for three scenarios
GROSS BENEFITS FROM COST REDUCTION (M USD)
SEASON
CONSERVATIVE MODERATE OPTIMISTIC
2011/12 -
2012/13 7.4 21.3 53.1
2013/14 19.1 50.7 109.5
2014/15 45.3 103.9 185.3
2015/16 92.7 174.3 256.9
2016/17 155.1 239.9 305.3
2017/18 212.9 283.8 330.7
2018/19 251.5 306.8 342.3
2019/20 271.6 317.3 347.6
2020/21 280.8 322.2 350.4
2021/22 285.1 324.7 352.1
Total 2011/12 - 2021/22 1,621.6 2,145.0 2,633.2
Source: The authors, based on results from SIGMA v.2.0 simulation runs (2011).
Figure 3.1 shows consolidated results (gross benefits due to production increase + cost
reduction) for all three scenarios defined at the beginning of this section. The figures shown on
the bars represent the values estimated for the last year of the simulation horizon (2021/2022
crop season) and, on the top portion of the chart, the cumulative benefits for the 2011/2012-
2021/2022 period.
Figure 3.1. Gross benefits from production increase and cost reduction due to the adoption of Bt+HT
6,000 Accumulated Accumulated Accumulated
2011/12-2021/22: 2011/12-2021/22: 2011/12-2021/22:
5,000
9,131 M USD 16,418 M USD 26,073 M USD
Million dollars
4,000
3,000
2,000
1,000 2021/22 2021/22 2021/22
1,586 M USD 2,502 M USD 3,668 M USD
-
Conservative Moderate Optimistic
Scenarios
Source: Tables 3.2 and 3.3
31Fifteen Years of Genetically Modified Crops in Argentine Agriculture
3.2 Drought-tolerant (DT) wheat
3.2.1 Benefits from the adoption of DT technology
The expected benefit from the adoption of DT wheat varieties consists of a 28% reduction
in losses expected as a result of an alteration in the rainfall system during the cropping cycle,
compatible with drought conditions. The assumption was made on the basis that this
detrimental climate contingency would happen every 5 years in the period under study (2011-
2022).
3.2.2 Summary of impacts
Three scenarios were defined and labeled conservative, moderate and optimistic, by
using the same parameters and variables described in the previous section. Table 3.4
summarizes the values assigned to the variables that define the three scenarios.
Table 3.4. DT wheat: Conservative, moderate and optimistic scenarios
AVERAGE
TECHNOLOGICAL ADOPTION
SCENARIO ADOPTION PRICE
LEVEL CEILING
TIME
(años) (% del área) (USD/t)
Low 6 60
CONSERVATIVE Medium 5 70 150
High 4 90
Low 5 70
MODERATE Medium 4 80 250
High 3 100
Low 4 80
OPTIMISTIC Medium 3 90 350
High 2 100
Source: The authors.
Table 3.5 shows the results from estimated impacts for each of the three previously-
defined scenarios, in terms of gross benefits due to production increase, attributable to the
adoption of GM technology for the period under study.
32You can also read