FIJI'S DECADE OF ACTION FOR ROAD SAFETY PROGRAM - Transportation ...
←
→
Page content transcription
If your browser does not render page correctly, please read the page content below
Fiji’s Decade of Action for Roads Safety Program   Turner, S, Nicholls, D and Smith, M   Page | 0

FIJI'S DECADE OF ACTION FOR ROAD SAFETY PROGRAM

Dr Shane Turner, National Specialist – Road Safety
PhD, Civil Engineering, University of Canterbury & BE (Hons), University of Auckland
MWH New Zealand Ltd, 6 Hazeldean Road, Hazeldean Business Park, Christchurch
E-Mail: shane.a.turner@mwhglobal.com
Dale Nicholls, former Maintenance and Road Safety Manager
Fiji Roads Authority, Suva, Fiji
E-Mail: Dalen@ihug.co.nz

Mike Smith, National Specialist – Road Safety
MET, University of Canterbury
MWH New Zealand Ltd, 6 Hazeldean Road, Hazeldean Business Park, Christchurch
E-Mail: Mike.smith@mwhglobal.com

ABSTRACT
The Fiji Government have set a target of reducing the number of fatal crashes per 10,000
vehicles by half during the United Nations Decade of Action for Road Safety (2010 to 2020).
The National Road Safety Action Plan includes a number of initiatives across Government
that look to produce safer roads, safer drivers and safer vehicles. The Fiji Road Authority
(FRA) are tasked with improving the safety of roads (and roadsides), which are in a relatively
poor state with poor pavement conditions and very limited safety counter-measures (e.g.
edge marker posts, chevron boards on curves, bridge and culvert guardrails). This paper
outlines the work that FRA and their partners are doing to improve road safety across the
network. Analysis of the Fiji Police Crash data indicates that infrastructure improvements
need to be aimed at both urban and rural areas and at motor-vehicle only and motor-vehicle
versus pedestrian crashes. Pedestrians are involved in approximately 40% of all serious and
fatal crashes, with around 50% of these occuring in rural areas. The road safety program
being implemented in Fiji includes both reactive and proactive components. The reactive
program focuses on black-spots and high crash risk routes. The NeSA web-based crash
analysis platform has been developed to allow more detailed analysis of crashes across the
network using an interactive web-based mapping system. An iRAP assessment has been
used to gain a better understanding of the level of risk across almost 600km of the strategic
network and to support more proactive interventions. The road safety program also includes
safety interventions in rural villages, around town market areas (and bus stations) and traffic
calming in the cities of Lautoka and Suva. As part of the safer system approach The FRA
have supported a more colloborative approach to developing safety improvements by
involving other key road safety partners such as the Police and LTA.

ACKNOWLEDGMENTS
The authors would like to acknowledge the Fiji Roads Authority who fund the ‘safer roads’
program. We also wish to acknowledge the road safety programs being implemented by our
road safety partners in Fiji and in particular the Land Transport Authority and the Fiji Police.
We look forward to working together going forward to make Fiji’s roads safer.

IPENZ Transportation Group Conference Auckland – March, 2016
Fiji’s Decade of Action for Roads Safety Program   Turner, S, Nicholls, D and Smith, M   Page | 1

INTRODUCTION
The Fiji government, like many countries, has committed during the “UN decade for action for
road safety” to reducing the number of motor-vehicle crashes. As outlined in the Fiji Decade
for Action: National Action Plan (Fiji Government, 2009) the government’s primary road safety
target during the decade of action is to reduce the number of deaths per 10,000 vehicles
from 7 in 2010 to less than 4 in 2019. This compares with a rate of 1.0 in New Zealand (in
2012) and 0.76 (in 2012) in Australia (WHO, 2013). Up to the end of 2014 the annual trend in
crashes per 10,000 vehicles has been heading downward.
The Fiji Decade for Action: National Action Plan outlines the roles and actions that are to be
taken over the current decade (2010 to 2019) by the various road safety partners. The key
road safety partners in Fiji include the; Land Transport Authority (LTA), Fiji Police, Fiji Road
Authority (FRA) and various Government ministries. This paper outlines the actions and
programs the FRA and their road safety partners have been implementing to improve road
safety across the network. It also provides details on some of the innovative road safety
tools such as iRAP and NeSA (crash mapping) that have been introduced to Fiji.

Fiji Road Network and Urban Areas
Fiji has two major islands and 333 islands in total, many of which do not have roads. Over
80% of the population live on Viti (Fiji) Levu (Large) with a high proportion of the remainder
living on the other large island (Vanua Levu). The three main population centres of Fiji are
Suva (Capital and largest city), Lautoka (Major port city) and Nadi (Main tourist town and
international airport gateway) which are located on Viti Levu (see Figure 1 for their locations).
Queens and Kings Road circumnavigate Viti Levu. Queens Road is the main connection
between Nadi and Suva to the south (a distance of over 200km). Queens Road also links
Nadi with Lautoka. Kings Road runs through the north of Viti Levu from Lautoka to Suva.
The highest volume/strategic rural routes are shown in Figure 1. As shown the high traffic
volume routes lie between Suva and Nausori (including the Suva international airport at
Nausori), Suva and Navua, Nadi to Sigatoka and Nadi to Ba. Major 4-laning projects are
under construction through Nadi to the Nadi international airport and between Suva and
Nausori (airport turn-off).

              Figure 1- Strategic and High Volume (Subset) Routes on Viti Levu

IPENZ Transportation Group Conference Auckland – March, 2016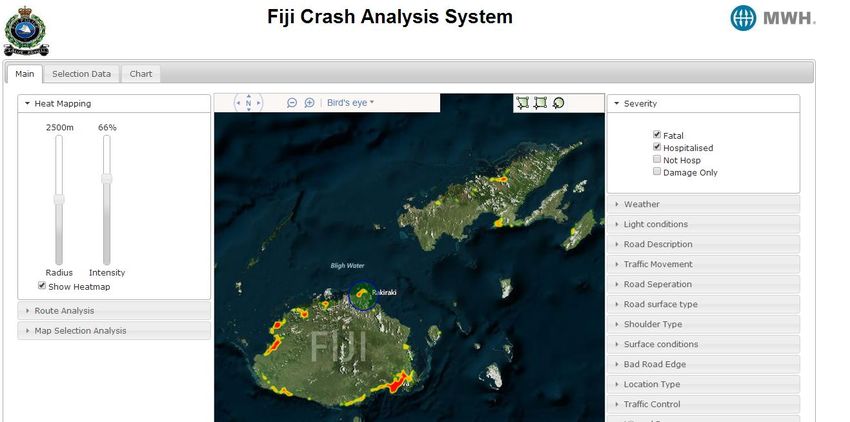
Fiji’s Decade of Action for Roads Safety Program   Turner, S, Nicholls, D and Smith, M            Page | 2

Other key routes are Princes Road, which runs slightly in-land from Kings Road between
Suva City and Nausori and the Transinsular Road on Vanua Levu, which provides a cross
island connection between the main town of Labasa in the north to Savusavu, a tourist town,
in the south. This route has some steep and windy terrain and a history of truck crashes
from loss of control. The majority of other rural routes on Vanua Levu are unsealed.
However, two routes, some 100km, are currently being sealed and widening (30km on
Hibiscus Highway towards Buca Bay and 70km on Naubowalu Road).
While there are a number of cross-island roads on Viti Levu many of these have low traffic
volumes and are unsealed. They provide access to in-land villages. Some routes are in
poor condition. There are some exceptions to this such as Sigatoka Valley Road north of the
town which has recently been upgraded. On Viti Levu there are a number of small and
medium sized towns along Queens and King Roads. Both of the two larger islands have a
large number of villages, many of which are bisected by major roads, like Queens Road.

CRASH TRENDS AND STAR RATING
There are two primary methods being used to assess crash risk in Fiji; 1) reported crash
statistics from the Fiji Police database and 2) Fiji iRAP risk ratings for major roads. The
Police maintain a coded recording of all crashes that Police attend or are reported by the
public. This includes fatal, hospitalised (serious injury), non-hospitalised ((minor) injury) and
damage-only crashes. Like most countries, non-fatal crashes are under-reported. Figure 2
and Table 1 (Fiji Police, 2013) shows the trend in injury crash types between 2003 and
2012/13. They show that there is generally a downward trend in causality numbers in all
injury classes. Since 2004, the number of fatalities and serious injuries has halved.

                       Figure 2 – Crash Casuality Data for Fiji (2003 to 2012)

    Type           2004       2005       2006      2007       2008       2009       2010   2011      2012    2013
Fatal                78         76         89        59         66         47         52    54         41     41
Hospitalised        328        325        326       185        222        243        205   182        182    166
Injury              474        422        575       478        397        379        413   324        284    290
Total               880        823        990       722        685        669        670   560        507    497

                      Table 1 – Road Casualities by injury type (2003 to 2013)

IPENZ Transportation Group Conference Auckland – March, 2016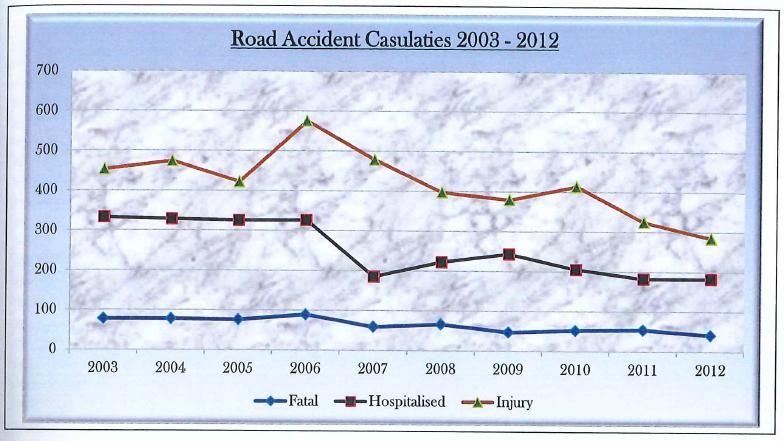
Fiji’s Decade of Action for Roads Safety Program   Turner, S, Nicholls, D and Smith, M   Page | 3

With low levels of car ownership, many Fijians walk or catch public transport. Figure 3
shows that a high proportion of serious and fatal casualities involve pedestrians. In 2012
over 200 of the 507 total casualties involved a pedestrian, including 12 fatalities and 65
hospitalised. The next highest categories were head-on at 65 (15 fatalities and 18
hospitalised) and hit-object off-road (mainly loss-of-control crashes) at 58 (3 fatalities and 65
hospitalised). Any program to improve safety in Fiji needs a major focus on pedestrian crash
causes.

                                   Figure 3 - Proportion of Crash Types

During the period, 2000 to 2013 around a third (32%) of crashes occurred at night and 16%
occurred in the wet. In 39% of crashes darkness and/or wet weather was a factor. The
proportion of wet weather crash is to be expected, given the high intensity rainfall that occurs
in Fiji, especially in the wet season. The high proportion of night-time crashes is far too high
and is likely to be due to a combination of factors including; very limited rural road delineation
(and lack of warning signs), glare caused by headlights not dipping, pedestrians walking on
the road at night and poor lighting in urban areas.
Routes inspections, site observations and existing road safety audits have identified a
number of key road safety issues that are likely contributors to the crashes being observed.
This includes:

    -    Lack of signage and marking or where there is poor maintenance of such signage
         and marking

    -    Limited seal width with narrow or no shoulders on parts of startegic road network plus
         many sections of lower speed alignments (operating speeds below 80kph speed limit)

    -    Large number of road-side hazards (eg. larger trees) close to the road in rural areas

    -    Unsafe overtaking due to the big speed differential between slow (can be as low as
         30km/h) and fast drivers (around or above 100km/h) on rural roads

    -    Excessive speeding (above 80km/h speed limit) on rural roads that have poor
         delineation, narrow shoulders, restricted sight distance and out-of-context curves

    -    Poor state of some vehicles given poor state of network prior to FRA program
         beginning in 2013 (eg.lots of pot holes)

    -    Pedestrians in dark clothes walking on high speed road traffic lanes due to no or
         narrow shoulders often in poor lighting or where visibility is restricted

IPENZ Transportation Group Conference Auckland – March, 2016
Fiji’s Decade of Action for Roads Safety Program   Turner, S, Nicholls, D and Smith, M   Page | 4

Fiji iRAP – Risk Rating from Infrastructure
In many developing countries, like Fiji, crash data can be variable in quality and unreliable.
To assist in understanding crash risk on the current road network an iRAP assessment was
undertaken of almost 600km of major rural and urban roads across Viti Levu and Vanua Levu
in 2014. This included all of Queens Road, Kings Road, Princes Road and the Transinsular
Road. Each route was videoed using go-pro cameras. The safety of each route was then
assessed based on the road infrastructure and roadside condition by the ‘coders’ from the
video in 100m sections. Using the iRAP tools (and risk factors) this was developed into a risk
rating (RPS) and star rating based on the predicted combined risk of serious or fatal head-on,
loss-of-control and intersection crashes occurring on each section.
As shown in Figure 4 and Table 2 the assessment indicated that the majority of the Fiji major
rural road network was classified as 1 and 2 stars for motor-vehicle drivers in early 2014
(98%) and one star for pedestrians (over 90% of routes that have some level of pedestrian
demand). With five stars being, the safest roads (e.g. well-designed motorways) and one star
being the least safe. This poor risk rating of most roads is to be expected given the majority
of Fiji’s major rural roads are 2-lane with numerous unprotected roadside hazards, relatively
poor pavement conditions, poor alignment and very few footpaths and safe crossing places.
This risk assessment helps explain the high incident of serious and fatal crashes per 10,000
vehicles in Fiji compared with other countries.
A major program of road upgrades is planned across the strategic Fiji road network through
to the end of the decade (2019). This includes considerable lengths of major road
rehabilitation, skid resistance improvement and basic delineation upgrades (reflectorised
centre-lines and edge lines). An assessment has been made of what this program is likely to
deliver in terms of improved star ratings by 2020 (called the 2020 baseline). As shown in
Table 2 a number of roads have moved from one to two or three star. The proportion of
major roads with 3 stars (the target level) has increased from around 3% to 15%. While this
is a good outcome, there is still 85% of the major road network that is below 3 stars. Later
we explain how the iRAP software, VIDA, can be used to assess how star rating can be
improved further.

            Figure 4 - Star Rating Map (Viti Levu) for Vehicle Drivers (Early 2014)

IPENZ Transportation Group Conference Auckland – March, 2016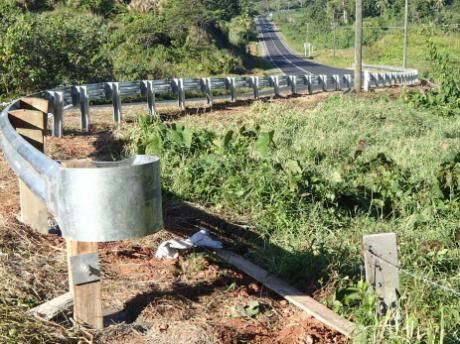
Fiji’s Decade of Action for Roads Safety Program    Turner, S, Nicholls, D and Smith, M                 Page | 5

     Star       Vehicle Drivers 2014               Vehicle Drivers 2020                         Pedestrians 2014
    Rating
                Length (km)        %               Length (km)          %                       Length (km)          %

5                              0           0%                     0.2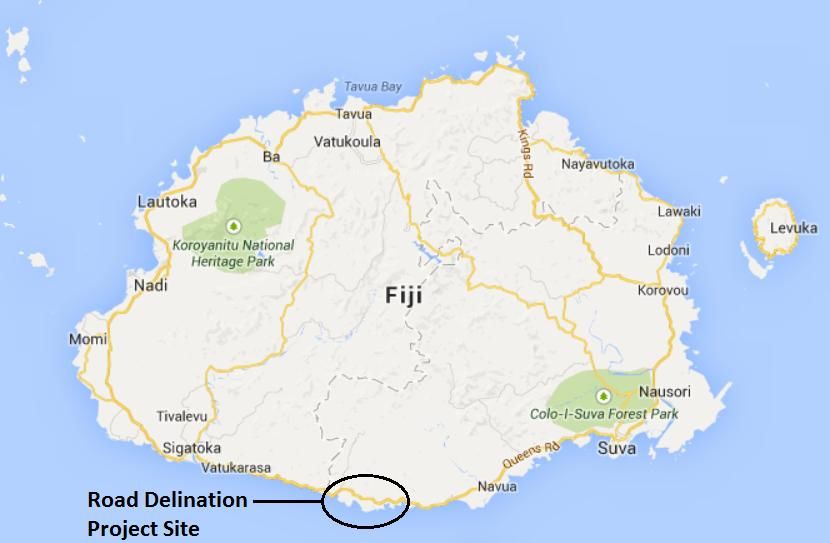
Fiji’s Decade of Action for Roads Safety Program      Turner, S, Nicholls, D and Smith, M                            Page | 6

              b. Better programs for novice and learner drivers

              c. Higher uptake of defensive driving courses

              d. Assessments of current drivers (through employers)

    2. Driver Testing

              a. Better accreditation of examiners

              b. Regular review of driving test

    3. Driver Records – better systems to keep records of drivers that have licences

While most components of a safer system approach are covered by the National Action Plan
one area that needs more focus going forward is ‘safer speeds’. The focus at this stage
around speeds is on enforcing current speed limits and not on whether some of the speed
limits (and hence operating speeds) should be reduced. Of particular concern are the speed
limits along parts of routes with high volumes of pedestrians, such as near market areas, bus
stations and around schools. In such circumstances it would be beneficial to drop speed
limits from 50 to 30 or 40km/h. This is an area that the strategy currently does not consider.
The current discussion in Fiji has been more around increasing speed limits, such as the
open road speed limit increasing from 80 to 100kph, rather than dropping speeds. There is
current dialogue between the FRA and other road safety partners on how speed impacts on
crash occurrence and why speed management is so important.

There is limited understanding of the safe system approach in Fiji. To raise the awareness of
safe system thinking (and their road safety program) the FRA have been hosting a number of
workshops with the various road safety partners, including Police, LTA, FRA, Councils,
Government departments and consultants. The crash chain terminology (see Figure 5) has
been used to help explain the various aspects of a safe system and the multiple causes that
often contribute to crashes. The example shown indicates how various parts of the system
make a contribution to the occurence of a crash and also to the severity of that crash. A safe
system program will look at breaking the crash chain on multiple fronts to either prevent the
crash or as a minimum reduce the severity of that crash.

                                     Car                         Road                      Driver          Weather

                                                                                                Misjudge
                                                                                                bend /
                             Tyres     Windscreen   Power pole      Worn surface   Tired        too fast    Rain

                                     Figure 5 – Crash Chain Terminology

IPENZ Transportation Group Conference Auckland – March, 2016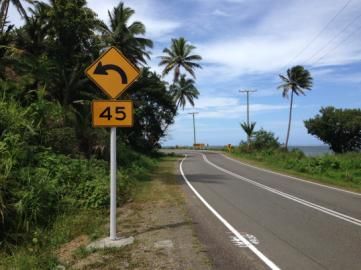
Fiji’s Decade of Action for Roads Safety Program   Turner, S, Nicholls, D and Smith, M   Page | 7

FRA SAFER ROADS PROGRAM
The main focus of the FRA is to improve the safety of the road infrastructure. Under the
National Action Plan this is the first action area (SFA 1). Key components of the safer roads
action plan are:

    1. Accident Prevention

              a. Road Marking and Delineation (600km plus of the network)

              b. Road Safety Auditing (of all new projects and existing roads)

    2. Accident Reduction

              a. Blackspots (upgrade 30 blackspots)

              b. Route Action Plans (upgrade at least 40km with improvements like passing
                 lanes)

              c. Mass Action Plans (new and improved safety barrier and signalised crossings)

              d. Village treatments (upgrades such as improved thresholds, speed humps and
                 footpaths)

    3. Traffic Management (improved traffic management, in turn, improve safety in cities
       and towns)

Since 2014 the safer roads team has been implementing a series of projects within the
following topic areas which are aligned to the National Action Plan:

    1. Traffic Management Program (in 2015 on two major corridors in Suva)

    2. Village Treatment (major and minor upgrades of villages located on main road
       including speed humps, threshold treatment, footpaths and pedestrains crossings)

    3. Market areas (upgrades in towns and cities, such as better pedestrian facilites)

    4. Traffic Calming (upgrades of routes around schools and shopping areas)

    5. Route Action Plans (on high risk routes identified using iRAP)

    6. Blackspots (in 2015 high crash intersections and other sites in Suva)

    7. Mass Action Program (focused on delineation and warning signs of out-of-context
       curves on around 700km of main roads and new and upgraded safety barrier)

    8. Deficiency Database (to record and prioritise safety issues and improvements options
       across Fiji)

    9. Road Safety Forward Works program (using iRAP to assess what the safety benefits
       would be from different levels of investment)

    10. Crash Analysis System (working with Police to upgrade to a better web-based crash
        system that is available to all road safety partners)

IPENZ Transportation Group Conference Auckland – March, 2016
Fiji’s Decade of Action for Roads Safety Program Turner, S, Nicholls, D and Smith, M Page | 8
11. Development of local guidelines (in 2014 Fiji Road Safety Audit guideline and in 2015
guidelines fo marking and traffic signs)
Further details on some of these programs follow.
Mass Action Program
The largest program in terms of cost is the mass action program. During 2014 the safety
team installed a 15km delineation trial through a section of Queens Road (along the coral
coast, Viti Levu) as shown in Figure 6. This section of Queens Road has a high number of
out-of-context curves (ie those where the speed drop from 80km/h is great than 15km/h) and
combination of horizontal and vertical alignments that can catch drivers out. Through this
section the team have trialed centreline and edgeline RRPMs, curve advisory signs and
curve chevrons. Edge Marker Posts were not used as they are frequently damaged or
stolen. In developing the scheme the team were very consious of the maintenence burden
on FRA that may result from replacing or upgrading increased signage and marking. At each
end of the trial section drivers were advised that they were entering or exiting the upgraded
section so they knew there was an improved road layout. In 2014 two safety barrier sites
were upgraded (to meet current standards) and safety barriers was installed around a large
culvert on Queens Road between Suva and the Coral Coast. A key consideration at each
site was that pedestrians had to be able to walk along the road verge and not in the traffic
lane.
Figure 6: Mass action delineation trial (15km) and safety barrier upgrades
Given the popularity of the trial section with drivers, the team were asked in 2015 to
investigate the installation of out-of-context curve delineation on all major roads across Viti
Levu and Vanua Levu, some 700km of major roads. The majority of the roll-out of this
signage occured in 2015, with completion planned in 2016. A number of new safety barrier
sites will also be designed and installed.
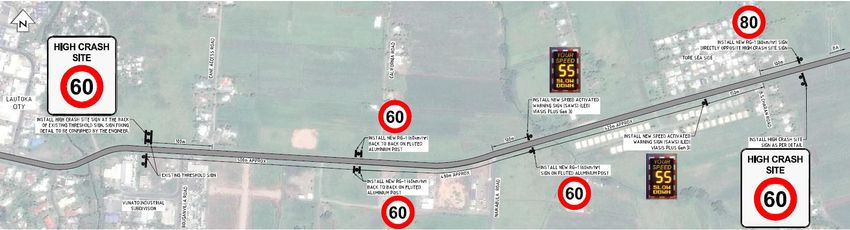
IPENZ Transportation Group Conference Auckland – March, 2016Fiji’s Decade of Action for Roads Safety Program Turner, S, Nicholls, D and Smith, M Page | 9 Blackspots/routes Program During 2014 three of the top 20 blackspots/routes were investigated. Two of the sites were around Lautoka (to the north and south). These sections of Queens and Kings Road had a high number of serious and fatal crashes, many involving pedestrians. Many people walk from the numerous villages around Lautoka into the city, as they don’t own cars. The medium to long term option is to build more footpaths and tracks clear of the highway. Given the limited funding, a number of interim measures have been installed including “high crash site” signage, reduced speed limits and active “speed display” warning signs (a first for Fiji). The imporvements that were installed in late 2014 are shown in Figure 7. During 2015 the focus has moved to major routes and intersections within Suva, including four lane sections of Kings Road (and Ratu Mara Road – which connects Kings to Queens). This includes upgrades to traffic signals to repair pedestrain signal faults, imporved lighting, installation of pedestrians fencing in the median (to encourage pedestrians from buses and school children to cross at the traffic signals) and also installation of pedestrians refuges and kerb extensions. Figure 7 – Reduced speed limit and active signs on Kings Road north of Lautoka Route Action Plans and Forward Work Program A number of strategies and plans have been developed since January 2015 to target crash problems along high risk road corridors. For the route action plans the focus is on the high volume sections of Queens Road from Nadi to Lautoka and from Nadi towards Sigatoka. In Suva the traffic management plan looks at the 4-laning section of Kings Road and the 2-lane section of Granthan Road. Also a traffic calming study focuses on Queens Road from Lami through to the outskirts of Suva, where pedestrian safety is compromised due to poor pedestrians facilites. The Fiji iRAP data is being used in each of these studies, alongside crash data, to help identify the specific infrastructure issues along each routes for motor-vehicles and pedestrians. IRAP is also being used to investigate the level of safety funding that needs to be spent in Fiji overall in the next twenty years to achieve the desired reduction in fatalities and serious injuries. In several countries it has been demonstrated that an improvement in the star rating to the next category (e.g. from middle of 2 stars to middle of 3 star bands) typically results in a reduction in serious and fatal crashes of 50%. A key outcome of the iRAP process, which is generated by iRAP’s VIDA software, is the safer roads investment plans. The VIDA safer roads investment plans are generated based on the BCR of various countermeasures that IPENZ Transportation Group Conference Auckland – March, 2016
Fiji’s Decade of Action for Roads Safety Program    Turner, S, Nicholls, D and Smith, M               Page | 10

have been shown to be effective in reducing serious injuries and fatalities. Countermeasure
examples include:
    -      Improving delineation and warning signs, especially on curves
    -      Removing road-side hazards and installing safety barrier
    -      Improving skid resistance (significant improvement already achieved)
    -      Adding footpaths
    -      Central median barriers on high volume roads
Table 3 and Figure 8 shows the expected improvements in star rating from two safer roads
programs with different BCR cut-offs (as applied to the expected 2020 baseline network).
They show that star ratings that should be achieved for safer road programs with an overall
BCR of 1 and 5 are implemented (minimum BCR of 0.5 and 3 respectively). The cost of
BCR1 and BCR5 programs are in the order of F$90M and F$3.5M respectively over twenty
years with an estimated saving of 475 and 105 fatalities and serious injuries respectively for
each program over 20 years.

             Star          Before 2020       BCR1           BCR5         %NET             %NET       %NET
             Rating                          (km)           (km)         Before           BCR1       BCR5

             5                        0.2            1.2          0.3
Fiji’s Decade of Action for Roads Safety Program Turner, S, Nicholls, D and Smith, M Page | 11
Table 3 shows that under a program BCR of 1 and an investment of $90M, over 300 km of
major road network could be moved into star rating 3 to 5 from current star ratings of 1 and 2.
This is shown in Figure 8 with a lot more of the vehicle bar up as orange (3 stars) and yellow
(4 stars). Under a BCR cut-off of 3 and a more modest investment of $3.5M there are still
good gains to be made with 70km moved from 1 star to mainly 2 stars. While not as
dramatic, these two programs do also improve star rating for pedestrians.
The iRAP VIDA software also includes interactive aerial maps, which can be used to identify
where safety countermeasures are most effective along high-risk corridors and at
intersections. The elements of the infrastructure that increase crash risk such as poor road
alignment can also be integrated using VIDA. This information is to be used in each of the
corridors studies.
Next Generation of Crash Analysis System (NeSA)
The current crash analysis software used by the Fiji Police is dated and can only be used on
one computer at the National Traffic Control Centre (NTCC). Until recently this valuable data
was also not being backed up. To undertake each of the FRA programs listed above, it is
important that the safety team have access to, and can run a variety of, different queries on
the crash data both when in Fiji and in New Zealand. To achive this the NeSA web-based
map system has been developed. NeSA has been developed using open source mapping
and associated software and the Police coded crash data. The new NeSA system has a
number of new features that the old system did not have like heat mapping, a large variety of
tabulations of crash data fields and collision diagrams. Being web-based the system can
also be accessed from multiple Police stations and other road safety partners via the internet.
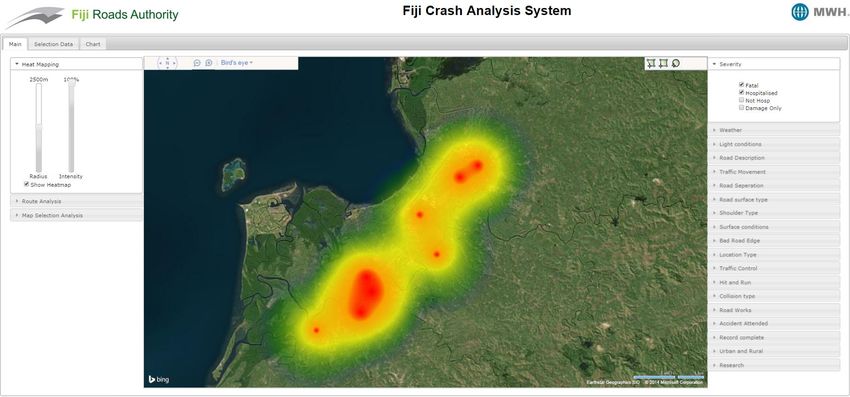
Figure 9 shows how heat mapping can be used to identify the highest concentrations of fatal
and serious injury crashes across the network. As expected this map shows most of these
crashes occur in major urban areas like Suva, Nadi and Latoka. But it also shows specific
problems in other areas like Rakiraki (highlighted), where there are many fatal and serious
injury crashes involving pedestrains walking alongside high speed roads. The tool can be
used to look at variety of factors including the various crash types and crashes occuring in
different weather and daylight conditions.
Figure 9 - Fiji Fatal and Serious Injury crashes heat maps
IPENZ Transportation Group Conference Auckland – March, 2016Fiji’s Decade of Action for Roads Safety Program Turner, S, Nicholls, D and Smith, M Page | 12
Part of a safe system approach to road safety is working with and ecouraging other road
safety partners. In addition to assisting the Police with a more advanced crash analysis
system the NeSA heat mapping feature can abe used to help Police target specific human
factor concerns. For example, as shown in Figure 10, we can identify where drunk driving is
more prevalent on the western side of Viti Levu and down to the detail of where to focus in
and around Nadi.
Figure 10 - Heat Map of drunk driving crashes in Nadi and surrounds
FINAL REMARKS/SUMMARY
Like many developing countries Fiji has a relatively low level of car ownership, but a high rate
of fatalities per 10,000 vehicles compared with higher income countries; in the order of ten
times that of Australia and New Zealand. A contributing factor in this high rate is the high
proportion of vehicle versus pedestrian fatalities (over 40%), given that there a large
proportion of people walking, including pedestrians walking on the narrow shoulder and
within the traffic lane on rural highways. There is also a much higher proportion of fatal and
serious injury crashes at night due to the poor level of delineation and lighting, poor driver
behaviour and poor state of many vehicles, including headlights that don’t dip correctly.
An iRAP assessment of nearly 600km of major roads shows that the majority of the roads
and roadsides are high risk (Star Rating 1) for both vehicle occupants and pedestrians. This
high infrastructure crash risk is exacerbated by poor driver behaviour, the poor state of many
vehicles and the safety impacts of a large range in open road speeds; with many unsafe
passing manoeuvres. To reduce the crash risk, and hence reduce road trauma, a safe
system approach (adapted to Fiji) is being implemented that includes safer roads and
roadside (for all modes), safer vehicles, safer road users and safer speeds.
The Fiji Decade of Action for Road Safety National Action plan contains a number of actions,
to be carried out by various road safety partners, that looks at making improvements across
each of these safe system areas. There are some gaps in the strategy especially with regard
to safer speeds; although enforcement of current speed limits does feature. The concept of
IPENZ Transportation Group Conference Auckland – March, 2016Fiji’s Decade of Action for Roads Safety Program Turner, S, Nicholls, D and Smith, M Page | 13
safe system is not well understood in Fiji, even though the national action plan does call for a
system-wide approach to address road trauma. Fiji would benefit from closer links to New
Zealand and Australia, especially in road safety training, in order to better understand the
safe system approach and to develop and introduce more effective road safety programs.
The Fiji Road Authority is committed to achieving safer roads and road-sides. Key areas of
focus include;
Improving delineation, warning signage and road-side protection on high speed
roads,
Slowing speeds through villages using threshold treatments and speed humps
Reducing vehicle and pedestrian conflicts in busy activity areas in towns and cities,
especially around markets and bus station through better marking, signage,
pedestrian facilities (footpaths and crossing places) and management of speeds.
Making targeted infrastructure improvements on high risk routes and intersection
using both 1) a traditional reactive ‘blackspot’ approach and 2) proactive targeting of
risk using tools like iRAP
The road safety challenges in Fiji are significant (as shown by high number of one star roads)
and it is going to take many years to improve the quality of the roads and road-sides to
acceptable standards, get the large number of sub-standard vehicles off the roads and to
improve driving skills and driver behaviour to suitable levels.
However there is considerable optimism at present given the momentum that is occurring in
road safety across the various road safety programs and in particular the level of investment
that is occurring to make the roads and road-sides safer. If this momentum can be sustained
over a decade or more then major safety gains are possible.
REFERENCES
Fiji Police, 2013, Road Traffic Accident Annual Report 2013, PoliceTraffic Control Division,
Suva, Fiji
Government of the Republic of the Fiji Islands, 2010, Fiji Decade of Action for Road Safety
(2011 – 2020) National Action Plan, Suva, Fiji
World Health Organisation (WHO), 2013, Global status report on road safety,
http://www.who.int/violence_injury_prevention/road_safety_status/2013/en/
IPENZ Transportation Group Conference Auckland – March, 2016You can also read