Financial Transmission Rights market observations - Ensuring arrangements are fit-for-purpose Issues paper
←
→
Page content transcription
If your browser does not render page correctly, please read the page content below
Financial Transmission Rights
            market observations
Ensuring arrangements are fit-for-purpose
                                          Issues paper

               Submissions close: 5pm, Monday 04 July 2022

                                              24 May 2022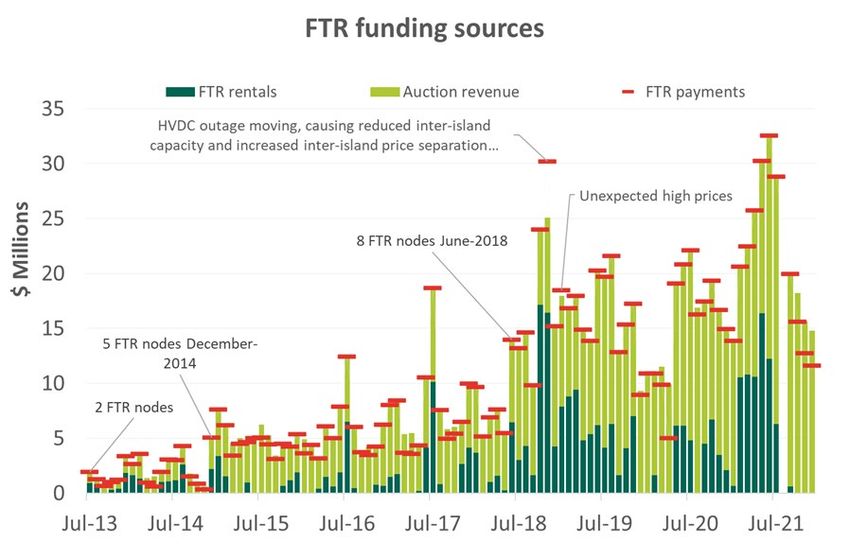
Foreword
The Electricity Authority (Authority) established a financial transmission rights (FTR) market in
2013. FTRs were designed to assist wholesale electricity market participants to manage
locational price risk (LPR). This in turn was expected to benefit consumers by enabling greater
competition in wholesale and retail markets.
Periodic reviews of the FTR market policy settings, including its funding arrangements via the
and Loss and Constraints Excess (LCE), are required to ensure the FTR market promotes
competition in the electricity industry for the long-term benefit of consumers – in accordance
with the first limb of Authority’s statutory objective. This FTR review continues the work on the
Hedge Market Enhancements project, which focussed on delivering enduring market-making
services that are fit for purpose, including by way of aligning costs with beneficiaries.
New Zealand’s transition to a low carbon future requires fit for purpose risk markets that deliver
maximum benefit to consumers. The Authority’s recently published Energy Transition Roadmap
sets out the steps the Authority is taking to support an efficient transition to a low-emissions
energy system, including risk management through the transition, and the recent work of the
Authority’s Market Development Advisory Group to consider generation investment and
reliability under 100% renewable electricity. This FTR review will assist the Authority in its
strategic focus on efficient risk markets to support the transition to a low carbon future.
This paper sets out the Authority’s observations and concerns about the operation of the FTR
market, some of which appear to warrant further investigation. The Authority seeks stakeholder
engagement and feedback on these initial observations to help the Authority to define any
issues that require further consideration.

James Stevenson-Wallace
Chief Executive
Contents
Foreword                                                                                  ii
1   What you need to know to make a submission                                            1
    Purpose of this document                                                              1
    How to make a submission                                                              1
    When to make a submission                                                             1
    Further information                                                                   2
2   Introduction                                                                          3
3   FTRs were introduced in 2013 to help manage locational price risk                     5
       The Authority subsequently introduced the FTR market in 2013, with the first FTR
       auction in June 2013.FTRs are a risk product designed to manage LPR                5
       FTRs are funded by auction revenue and the Loss and Constraint Excess (LCE) 6
       FTR market design aims to maximise LCE use for settling FTRs                       8
       The Authority investigated several options for managing LPR before deciding to
       pursue FTRs                                                                        8
       Options for managing LPR in 2009 were limited                                      8
       Historically it has been more difficult for participants to manage constraint LPR
       than loss LPR                                                                     10
       LPR was impacting retail competition, but other impacts were not considered       11
    LPR will evolve over the next decade                                                 13
4   The Authority has made several observations regarding the current policy settings of
    the FTR market                                                                        15
    Retail competition has improved since the FTR market started, but the FTR market’s
    contribution is not clear                                                             16
        The effect on retail competition in Hawkes Bay from introducing the Redclyffe hub
        is unclear                                                                        19
    There has been no discernible effect on regional generator competition due to FTRs 21
    The costs to support the FTR market are high                                          23
        Increase in FTR hubs sees a higher proportion of LCE made available for the FTR
        market                                                                            25
    Some FTR participants profits may not be directly related to consumer benefit         26
    The FTR market is not tightly targeted at the LPR problem                             30
    Many parties who are subject to LPR are not using the FTR market.                     32
        A UMR survey conducted in 2017 identified complexity and cost as barriers to
        participating in the FTR market                                                   33
        In 2017 the costs to participate were considered a barrier to participation       34
    The Authority identified other aspects of the FTR market that raise potential concerns
                                                                                          34
        The FTR market has generally returned a profit to FTR holders                     34
        Some features of the FTR market may be unintended                                 35
        Regulatory oversight of the FTR market is limited                                 36
        Interactions between auction revenue and revenue adequacy                         36
5   Next steps                                                                           38
6   The Authority wants to hear from stakeholders                                        40
7   Other Authority workstreams considering LCE allocation                               43
        Transmission Pricing Methodology (TPM) Settlement Residual Allocation
        Methodology (SRAM) workstream will not impact this review of the FTR LCE
        allocation                                                                       43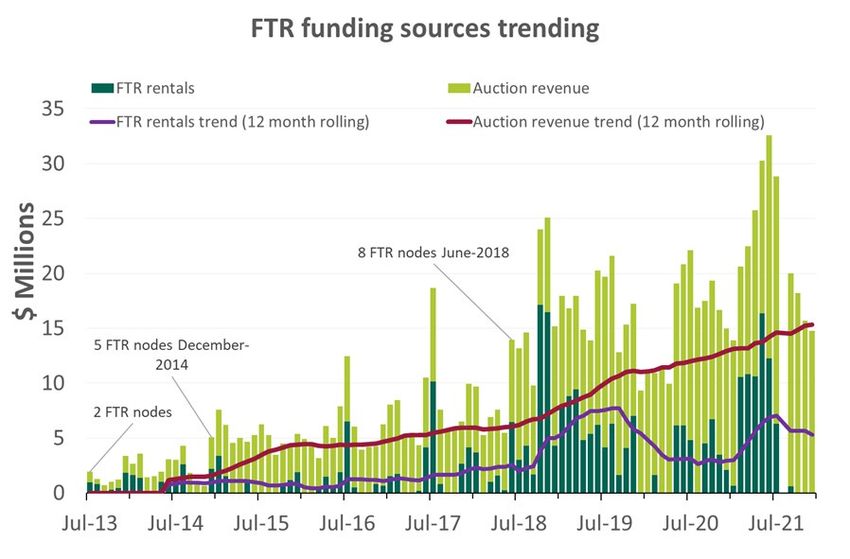
What you need to know to make a submission
      Purpose of this document
1.1   The Authority, as part of its strategic focus on efficient risk markets, has identified a set
      of initial observations from its review of the current Financial Transmission Rights (FTR)
      market and Loss and Constraint Excess (LCE) allocation policy settings.
1.2   The purpose of this document is to seek feedback on the Authority’s initial observations,
      and to receive feedback from stakeholders on the current FTR market and LCE
      allocation policy settings to ensure any issues or opportunities are robustly defined. This
      will assist in ensuring any potential intervention is aligned with the long-term benefit of
      consumers.

      How to make a submission
1.3   The Authority’s preference is to receive submissions in electronic format (Microsoft Word
      or PDF). Submissions in electronic form should be emailed to
      WholesaleConsultation@ea.govt.nz with ‘Financial Transmission Rights market review’
      in the subject line.
1.4   If you cannot send your submission electronically, please contact the Authority
      (WholesaleConsultation@ea.govt.nz or 04 460 8860) to discuss alternative
      arrangements.
1.5   Please note the Authority intends to publish all submissions it receives. If you consider
      that the Authority should not publish any part of your submission, please:
      (a)   indicate which part should not be published,
      (b)   explain why you consider that part should not be published, and
      (c)   provide a version of your submission that can be published (if the Authority agrees
            not to publish your full submission).
1.6   If you indicate there is part of your submission that should not be published, the
      Authority will discuss with you before deciding whether to publish that part of your
      submission.
1.7   However, please note that all submissions received, including any parts that are not
      published, can be requested under the Official Information Act 1982. This means the
      Authority would be required to release material that was not published unless good
      reason existed under the Official Information Act to withhold it. The Authority would
      normally consult with you before releasing any material that you said should not be
      published.

      When to make a submission
1.8   Please deliver your submission by 5pm on Monday 04 July 2022.
1.9   The Authority will acknowledge receipt of all submissions electronically. Please contact
      WholesaleConsultation@ea.govt.nz or 04 460 8860 if you do not receive electronic
      acknowledgement of your submission within two business days.

                                                1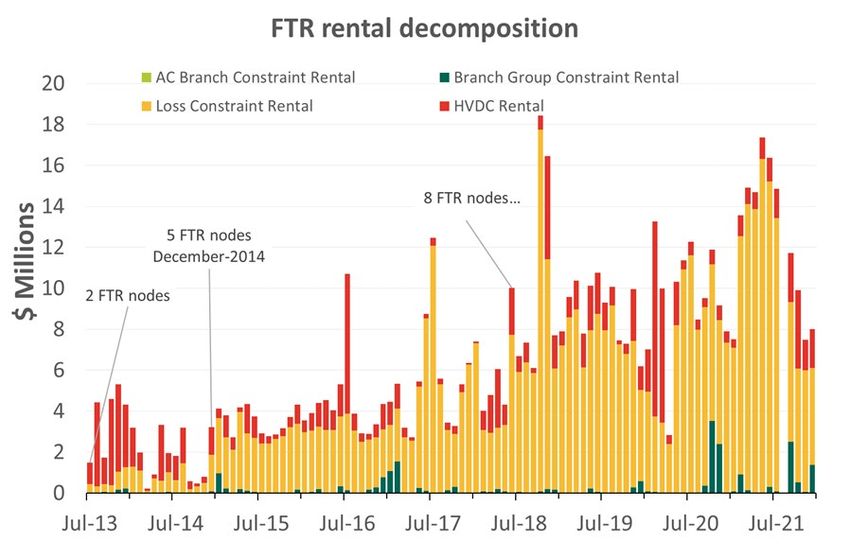
Further information
1.10   The Authority’s website contains useful background material about its previous work, the
       work of its advisory groups, and the work of its predecessor (the Electricity Commission)
       relating to the FTR market and LCE allocations: https://www.ea.govt.nz/about-us/what-
       we-do/our-history/archive/dev-archive/work-programmes/market-wholesale-and-retail-
       work/ftr-development/
1.11   In November 2019 a post-implementation review was completed on the effectiveness of
       the FTR market where participants were interviewed about their use of the FTR market.
       The findings from those interviews can be found here:
       https://www.ea.govt.nz/monitoring/enquiries-reviews-and-investigations/2019-2020/post-
       implementation-review-of-the-ftr-market/
1.12   Please direct any specific questions or queries to: WholesaleConsultation@ea.govt.nz

                                               2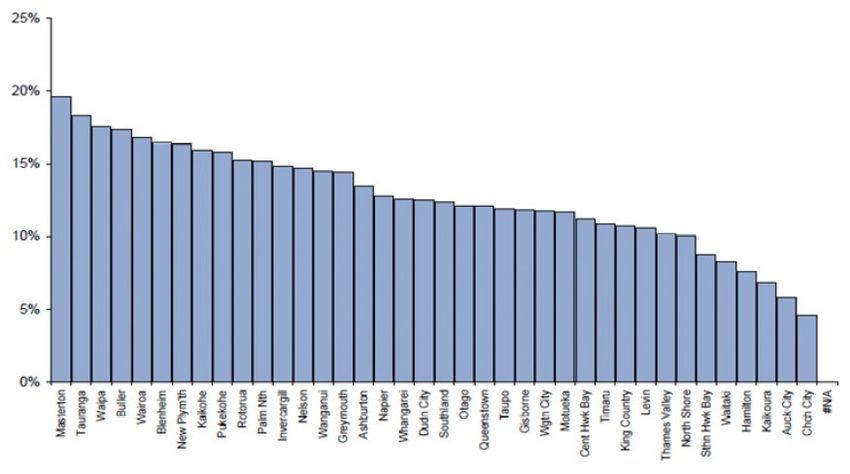
Introduction
2.1   Financial transmission rights (FTRs) were introduced in 2013 to help manage locational
      price risk (LPR), enhance retail and generation competition, and provide long-term
      consumer benefit in line with the Authority’s statutory objective. Since its inception,
      concerns raised by market participants and observations by the Authority suggest the
      FTR market may not be addressing the problems it was created to solve.
2.2   This paper considers issues and opportunities to improve the current policy settings for
      the FTR market and the allocation of loss and constraint excess (LCE). As part of this
      review, the Authority seeks views from market participants and other stakeholders on the
      existing FTR market and LCE allocation policy settings with a particular focus on the
      effectiveness of the FTR market in managing LPR for market participants.
2.3   This paper sets out the Authority’s observations on LPR and the current FTR and LCE
      policy settings. These observations raise some concerns FTRs are not effective at
      addressing the problems they were created to solve, and consequently are not aligned
      with the Authority’s statutory objective:
      (a)   the FTR market is not tightly targeted at the problem – FTRs were created to
            manage risk, but FTRs payout on nodal price differences due to both constraints
            and losses even though losses are relatively predictable,
      (b)   the link between FTRs and the intended improvement in retail and generation
            competition appears to be limited,
      (c)   many parties (particularly direct connect consumers and independent retailers)
            who are subject to LPR are not using the FTR market to manage LPR and are
            choosing to manage LPR in other ways, despite other market solutions for
            managing LPR being limited, and
      (d)   non-physical financial parties appear to be profiting from the FTR market and the
            link to consumer benefit is unclear.
2.4   The Authority is considering FTR and LCE policy settings now because:
      (a)   the Authority has a strategic focus on efficient risk markets to support the transition
            to a greater share of renewable generation. The Authority considers it is important
            that participants have access to effective tools to manage LPR,
      (b)   the Authority needs to consider the methodology Transpower uses to rebate LCE
            as part of proposed transmission pricing methodology (TPM) changes,
      (c)   FTRs have consumed a greater share of available LCE recently, from an average
            of 13% of total LCE per month under two FTR hubs, 17% of total LCE per month
            under five FTR hubs to an average of 47% of total LCE per month under eight FTR
            hubs. The current eight FTR hubs consume approximately $60 to $70 million per
            year from LCE. There may be alternative uses for the LCE that provide greater
            benefit for consumers that better align with the Authority’s statutory objective.
2.5   This consultation is linked to a previous consultation paper on the LCE rebate
      methodology governance, principles, and pass-through because the methodology
      ultimately chosen for rebating LCE may provide a partial LPR hedge for transmission
      customers. The LCE rebate methodology consultation paper, also known as the
      settlement residual allocation methodology (SRAM) is available here:

                                                3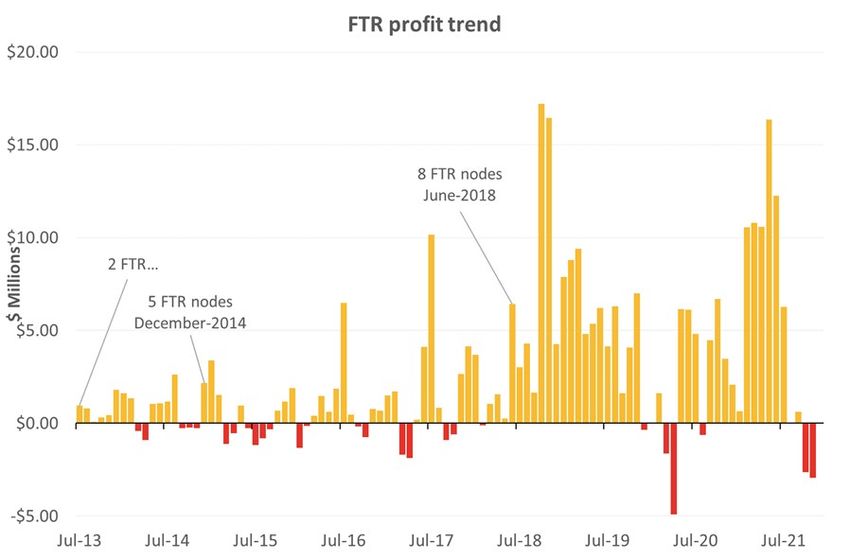
https://www.ea.govt.nz/development/work-programme/pricing-cost-allocation/settlement-
      residual-allocation-methodology-sram/consultation/#c19104 .
2.6   This paper seeks feedback on the Authority’s observations of the FTR market and LCE
      allocations to gather further information from stakeholders to ensure any problems or
      opportunities are robustly defined. A robust problem or opportunity definition will allow
      interventions (if any) to provide maximum benefit to consumers. After considering
      stakeholder feedback and any further analysis on the observations in this paper, the
      Authority will decide whether there are challenges or opportunities of sufficient
      materiality to proceed with its review.

                                               4
FTRs were introduced in 2013 to help manage
      locational price risk
3.1   Sources of electricity generation are often far away from electricity consumers. The
      transmission system used to transport electricity over long distances is subject to:
      (a)    loss of energy (this means more electricity must be generated than is consumed),
      (b)    congestion (where a shortage in the transmission capacity to supply the demand
             leads to more expensive sources of generation being used to supply electricity
             demanded), and
      (c)    risk of failure of critical elements (which means generation or demand reduction
             must be on standby to cover an event, referred to as ‘instantaneous reserves’).
3.2   These factors can result in large and unpredictable price differences across the
      electricity grid resulting in LPR. LPR affects generators and purchasers, and its
      presence, without a management tool, could lead to lower levels of competition in
      wholesale and retail electricity markets.
3.3   Therefore, one of the recommendations from the 2009 Ministerial Review of the
      electricity market was to:
             Introduce, as a priority, a transmission hedging mechanism to assist retailers
             manage risks created by transmission congestion. 1
3.4   This recommendation was captured in Section 42 of the Electricity Industry Act 2010 and
      was required to be reflected in the Code within 12 months of the Authority being
      established in 2010. The focus of the recommendation however was broadened from
      retail to all wholesale market participants:
             mechanisms to help wholesale market participants manage price risks caused by
             constraints on the national grid. 2

      The Authority subsequently introduced the FTR market in 2013, with the
      first FTR auction in June 2013.FTRs are a risk product designed to manage
      LPR
3.5   FTRs are a type of locational risk product covering the price difference between pairs of
      grid nodes (called hubs).
3.6   Participants can manage LPR by purchasing FTRs at an auction. An FTR pays its owner
      the difference in spot price between two nodes on the transmission network. Unlike
      traditional hedge products which have a ‘buyer’ and a ‘seller,’ FTRs only require a buyer.
      In this case, the seller is the FTR manager, who does not take a financial risk in
      operating the sale of FTRs.
3.7   Similar to Contracts for Differences (CFDs), FTRs are purely financial arrangements and
      do not involve the physical delivery of electricity, this means the FTR market may also
      attract participants who do not trade physical electricity.

1     Ministry of Business, Innovation and Employment, Improving electricity market participants: summary notes
      on recommendations taking account of submissions. Available here: Wayback Machine (archive.org)
2     Paragraph 3.1, Electricity Authority, Post implementation review of the FTR market. Available here: Long-
      form report (ea.govt.nz)

                                                       5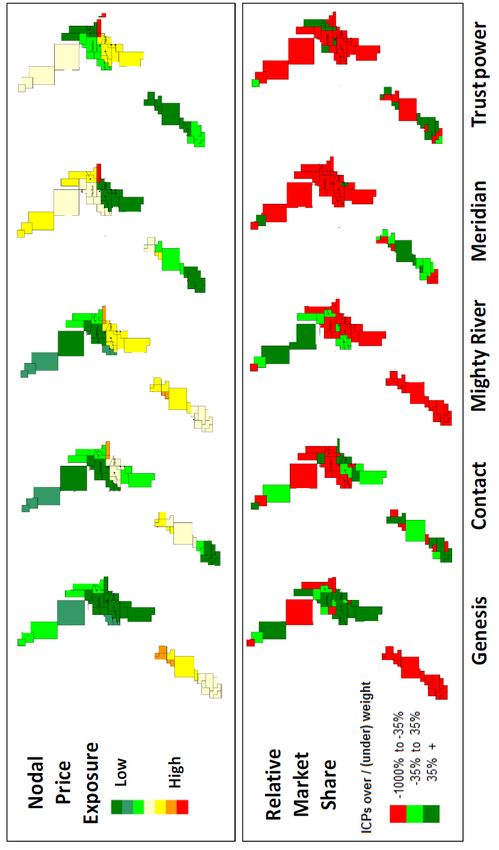
3.8    Hedge contracts are traditionally transacted between a buyer and a seller (occasionally
       involving a third party). With the FTR market, the FTR manager allocates FTRs to FTR
       participants via an auction process and there is no counter party. The FTR auction
       process is voluntary to participate in, and participation is not limited to participants who
       are subject to LPR.

       FTRs are funded by auction revenue and the Loss and Constraint Excess
       (LCE)
3.9    FTR payments are funded first by using the revenue generated from the auction of FTRs
       (ie, money paid by participants purchasing FTRs) and, if the FTR auction income does
       not fully cover FTR payments, then allocated LCE (also known as FTR rentals) is used
       to cover the shortfall. Historically, 30% of payments to FTR holders has come from LCE
       and 70% from auction revenue.
3.10   LCE is the surplus collected from the wholesale electricity spot market once payment is
       collected from buyers and generators are paid for their supply of generation. LCE exists
       because there are price differences between grid nodes from transmission losses and
       grid constraints.
3.11   Any LCE funds not required to fund FTRs are provided to the grid owner (Transpower)
       who allocates 3 the funds to transmission customers. 4 If FTR auction revenue and the
       LCE are not adequate to fund the FTR payments, the FTR payments are scaled to the
       level of FTR auction revenue and LCE available. 5
3.12   When auction income and FTR rentals are adequate to settle the FTR market this is
       referred to as revenue adequate, and when it is insufficient this is referred to as revenue
       inadequate. When revenue is inadequate scaling of FTR payouts are required.
3.13   A summary of the payments made to FTR participants and transmission customers for
       2020 and 2021 is provided below in Table 1.
3.14   FTR participants can be physical participants or non-physical participants. Physical
       participants are ones which generate or consume electricity and are looking to hedge
       operational risks associated with their business. Non-physical participants are financial
       entities that are purely interested in trading electricity products for a profit. Physical
       participants may also engage in trading for profit.
3.15   Figure 1 below, shows the cash flows within the FTR market. Each month LCE is
       calculated. That amount is then subject to a calculation based on Schedule 14.6 of the
       Electricity Industry Participation Code (the Code) that determines what proportion is
       available to settle the FTR market (FTR rentals). The full allocation of FTR rentals is not
       always required to settle the FTR market, with the balance (residual LCE) returned to
       transmission customers.
3.16   Non-FTR rentals are the portion of LCE that are allocated to transmission customers.

3      For more details on the allocation of LCE to transmission customers please refer to the Settlement Residual
       Allocation Methodology (SRAM) consultation - Consultation — Electricity Authority (ea.govt.nz)
4      Transmission customers are typically generators, distributors and large industrial companies that are directly
       connected to the grid. These customers pay transmission charges to Transpower, the grid owner for use of
       the electricity transmission grid. LCE funds from the electricity transmission grid are ultimately borne as a
       cost to transmission customers.
5      The FTR market is designed so that, on average, one in every 12 months would experience revenue
       inadequacy. In the eight years since the FTR market started there have only been two months when there
       was FTR “revenue inadequacy” leading to the scaling of FTR payments.

                                                        6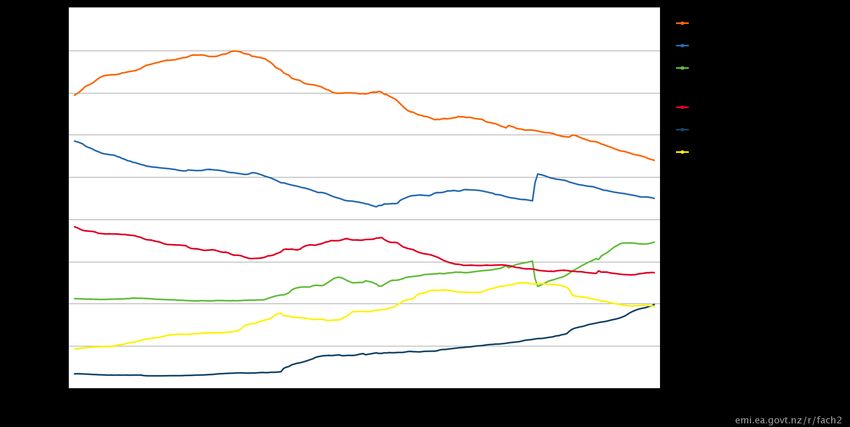
Table 1 Summary of payments to FTR participants and transmission customers (2020
       and 2021)

              FTR participants                                   Transmission customers
              Auction Income           FTR Rentals               Non-FTR                  Residual LCE
                                                                 Rentals
    2020      $155 million             $28 million               $13 million              $86 million
              Total - $183 million                               Total - $99 million
    2021      $175 million             $59 million               $13 million              $77 million
              Total - $234 million                               Total - $90 million

3.17   In 2020 and 2021 there were three months where auction income exceeded FTR
       payments, hence FTR rentals were not required. However, August 2021 is yet to be
       settled due to the 9 August 2021 event, 6 resulting in delays for interim prices becoming
       final.
3.18   The full FTR cashflows for 2020 and 2021 are detailed below in Figure 1.
       Figure 1 FTR cashflows for 2020 and 2021 (excluding August 2021)

6      Reference: https://www.ea.govt.nz/monitoring/enquiries-reviews-and-investigations/2021/electricity-
       authority-review-of-9-august-2021-event-under-the-electricity-industry-act-2010/
       Analysis of potential August 2021 settlement and LCE consumption cashflows using July 2021 power flow
       data and interim prices for trading periods yet to be finalised, indicate the month is likely to be revenue
       adequate. However, this will not be finalised until the trading periods held as interim are made final.

                                                        7
FTR market design aims to maximise LCE use for settling FTRs
3.19 The decision to use a combination of auction revenue and LCE was justified on the basis
it would increase revenue adequacy, 7 which in turn would help to ensure FTRs are a
reliable tool for managing LPR. 8
3.20 A noted trade-off with this decision was that auction revenue would not be available to
fully offset the impact on transmission customers who would not receive LCE. However,
because this outcome was considered to be a wealth transfer, the Authority at that time
(28 April 2011), did not consider there to be negative efficiency effects. 9
3.21 The FTR allocation plan sets the Revenue Adequacy Objective as:
(a) the primary objective is for Revenue Inadequacy to occur one month in twelve
(b) the secondary objective is for the annual average scaling factor to be 98%.
3.22 These objectives assist the FTR Manager, who is responsible for developing the FTR
policy on the FTR grid, to achieve a balance between ensuring sufficient revenue is
available to settle FTRs and a sufficient volume of FTRs are available for purchase. 10
The Authority investigated several options for managing LPR before
deciding to pursue FTRs
3.23 A range of alternative solutions for managing LPR were considered by the Authority and
its predecessor the Electricity Commission (Commission), before FTRs were
implemented. These solutions included:
(a) FTRs, which are auctioned to the highest bidder and provide the holder with a
claim to the locational rentals on transmission circuits specified in the FTR (this
was the chosen solution),
(b) a locational rental allocation (LRA), which allocates defined locational rentals to
spot market purchasers in proportion to their locational price risk using a formula,
(c) a hybrid of LRAs and FTRs, in which inter-regional rentals are allocated using an
FTR, and intra-regional rentals are allocated with separate LRAs in each region,
(d) zonal pricing, under which demand (and possibly generation) at all nodes within a
zone are subject to the same price, or
(e) various combinations of the above.
Options for managing LPR in 2009 were limited
3.24 In 2009, the Commission considered most of the existing options for managing LPR
were generally high cost and resulted in either less competition or reduced economic
activity. Other options (such as purchasing hedges at central nodes) were ineffective at
that time. The options considered before the introduction of FTRs are set out in Table 2
below.
7 Revenue adequacy is when the FTR settlement amount (funding for FTRs) is sufficient to settle all FTR
Hedge Values in full for a particular FTR period.
8 Paragraph 3.4.137, Electricity Authority, Consultation Paper: Managing locational price risk: Proposed
amendments to Code. Available here: Consultation Paper (ea.govt.nz)
9 Paragraph 3.4.137, Electricity Authority, Consultation Paper: Managing locational price risk: Proposed
amendments to Code. Available here: Consultation Paper (ea.govt.nz)
10 Section 4.8, Financial Transmission Rights, FTR Allocation Plan 2018. Available here:
FTR_Allocation_Plan_2018 (2).pdf
8Table 2 Existing options for managing LPR in 2009 11
Option Feasible for Feasible for Economic activity
retailer large industrial
purchasers
Purchase hedge Yes Yes Does not offset high locational
at central node prices.
Purchase hedge Yes Yes Hedge unlikely to cover all load,
at local node generators likely to be very
reluctant to sell hedges unless
they are local (so hedges will
only cover local generation),
hedge price is likely to be high
because of lack of other options.
Cut load Limited Yes, but Less production, consumption.
typically only for
a small
proportion of
load
Increase price Yes No (in relation to Increased electricity cost, less
electricity) production, consumption.
Build generation Yes Yes High cost but increased
generator competition.
Exit market Yes Yes Less competition, production,
consumption.
Do no enter Yes Yes Less competition.
market
Sell at spot Yes, to a N/A for some End users will become more
prices to end degree exposed to LPR, which they may
users be able to respond to by cutting
load, reducing consumption.
3.25 The Commission noted that the ability of purchasers to buy a competitively priced hedge
at their node to cover their LPR was likely to be limited because of the low level of
liquidity in the New Zealand hedge market. At the time, energyHedge 12 (a voluntary CFD
exchange) accounted for less than 0.01% of the volume of electricity sold on the spot
market in New Zealand. Also, the Australian Securities Exchange (ASX) only listed
11 Table 2, Electricity Commission, Consultation paper: Managing locational price risk: Options, November
2009. Available here: https://www.ea.govt.nz/about-us/what-we-do/our-history/archive/dev-archive/work-
programmes/market-wholesale-and-retail-work/ftr-development/consultation/#c8182.
12 energyHedge was a company formed by Contact Energy, Genesis Power, Merdian Energy, Mighty River
Power and Trustpower in 2010, which seeked to enter bi-lateral market-making agreements with the ASX
9futures and options for two New Zealand nodes (Otahuhu and Benmore) with a very
small number of hedges traded. 13
Historically it has been more difficult for participants to manage constraint
LPR than loss LPR
3.26 Analysis of loss and constraint rentals over January 2008 – April 2010 showed that:
(a) transmission constraint rentals and reserve constraint 14 rentals were significantly
more volatile in relative terms than loss rentals, and
(b) loss rentals were more correlated with energy prices than constraint rentals (when
energy prices were higher so were loss costs)—the correlation of loss rentals with
total load revenue was 97%, while for transmission constraint rentals it was 40%,
and for reserve constraint rentals it was 18%. 15
3.27 The development of the FTR market was originally established to manage price
separation due to congestion. The decision to have FTRs cover price effects due to both
congestion and losses was following the recognition that variability in hydrology also
resulted in price volatility.
3.28 While energy hedging could have been used to manage most of the risk associated with
losses (if there was a sufficient volume of energy hedges available), energy hedging
would not have been an effective tool for managing LPR associated with reserves and
transmission constraints. Inter-island LPR (between the North and South Islands) was a
bigger problem than intra-island LPR (within either the North or the South Island).
3.29 The Commission undertook detailed empirical analysis of LPR in 2010. This analysis
identified that, even once the HVDC Pole 3 was commissioned, 16 the capacity of the
HVDC link was expected to be a permanent consideration for LPR management. The
Commission also noted that although transmission grid investment within each of the two
Islands may, over time, change the magnitude of intra-Island LPR, it was expected to
continue to be low relative to inter-island LPR. 17
3.30 The Commission found that on average inter-island constraint rentals were about 80% of
total constraint rentals between January 2008 and April 2010, while intra-island
constraint rentals made up the remaining 20%. In addition, for all but four months of the
sample period, inter-island constraint rentals accounted for at least 60% of total
constraint rentals. 18
13 Paragraph 3.1.13, Electricity Commission, Consultation paper: Managing locational price risk: Options,
November 2009. Available here: https://www.ea.govt.nz/about-us/what-we-do/our-history/archive/dev-
archive/work-programmes/market-wholesale-and-retail-work/ftr-development/consultation/#c8182.
14 A constraint resulting from instantaneous reserve requirements that causes price separation between nodes,
such as the HVDC terminals.
15 Paragraphs 4.3.9 and 4.3.14, Electricity Commission, Consultation Paper: Managing locational price risk
proposal, September 2010. Available here: https://www.ea.govt.nz/about-us/what-we-do/our-
history/archive/dev-archive/work-programmes/market-wholesale-and-retail-work/ftr-
development/consultation/#c8177
16 HVDC Pole 3 was commissioned in May 2013 and allowed the HVDC link to operate at a greater capacity.
17 Paragraphs 3.4.6-3.4.7, Electricity Commission, Consultation Paper: Managing locational price risk proposal,
September 2010. Available here: https://www.ea.govt.nz/about-us/what-we-do/our-history/archive/dev-
archive/work-programmes/market-wholesale-and-retail-work/ftr-development/consultation/#c8177.
18 Paragraphs 5.5.3-5.5.4, Electricity Commission, Consultation Paper: Managing locational price risk proposal,
September 2010. Available here: https://www.ea.govt.nz/about-us/what-we-do/our-history/archive/dev-
archive/work-programmes/market-wholesale-and-retail-work/ftr-development/consultation/#c8177.
103.31 Further analysis in 2011 found that 67% of all modelled constraints out to 2025/26 would
be caused by either the HVDC or the Bunnythorpe-Haywards equation constraint 19,
which would be partially covered by an inter-island FTR. 20 Any cover for LPR would be
limited to the extent that the price separation could be managed by a FTR between
Benmore and Haywards. However, no FTR was available to cover the price separation
between Haywards and Otahuhu. The addition of obtaining Benmore and Otahuhu
futures products to create a synthetic FTR may provide additional cover.
3.32 However, some industry participants considered that an inter-island solution to LPR was
not required because coverage of inter-island LPR could be obtained through hedge
market swaps (between Otahuhu and Benmore). 21 While the Authority agreed that
participants may be able to manage some of their LPR through hedge market swaps, it
noted that there wasn’t an active swap market (in 2011) so it was unlikely that a
participant would be able to obtain enough swaps to cover all of their LPR.
LPR was impacting retail competition, but other impacts were not
considered
3.33 In 2010, the Commission considered the relationship between location of generation and
retailing presence for the five major generator retailers. The analysis indicated that for
four of the five major generator retailers, there was a strong correlation between high
nodal price exposure and low relative regional market share. The Commission’s analysis
is illustrated in Figure 2 below. 22
19 In 2017 the impact of Bunnythorpe-Haywards constraint has been significantly reduced due to the
reconductoring of lines A and B in 2017 which increased capacity on the transmission circuit, reducing the
incidence of constraints and price separation.
20 Paragraph 3.3.18, Electricity Authority, Consultation Paper: Managing locational price risk: Proposed
amendments to Code, April 2011. Available here: https://www.ea.govt.nz/about-us/what-we-do/our-
history/archive/dev-archive/work-programmes/market-wholesale-and-retail-work/ftr-
development/consultation/#c8176.
21 Paragraph 3.3.1, Electricity Authority, Consultation Paper: Managing locational price risk: Proposed
amendments to Code, April 2011. Available here: https://www.ea.govt.nz/about-us/what-we-do/our-
history/archive/dev-archive/work-programmes/market-wholesale-and-retail-work/ftr-
development/consultation/#c8176.
22 The analysis that the Commission considered was initially prepared for the Commission’s Market Design
Review in 2008 (https://www.ea.govt.nz/about-us/what-we-do/our-history/archive/dev-
archive/consultations/wholesale-consultations/2008/archive-market-design-review-options-paper-2008/) and
related to the period 2003-2007. However, the Commission considered that the analysis was still relevant
because the influence of generator location on competition was enduring and was a factor in the Ministerial
Review considering that the SOE physical and virtual asset swaps were necessary.
11Figure 2 Correlation between nodal price exposure and relative market share
(2003-2007) 23
3.34 Figure 2 shows, for example, that Genesis’ market share in the South Island was
significantly lower than its national average market share, coinciding with its higher nodal
price exposure in the South Island than the North Island.
3.35 Contact was the only generator retailer of the five that was assessed to not have a
strong correlation between high nodal price exposure and regional market share as it
had generation relatively evenly distributed throughout the country.
3.36 The Commission considered that the regional market share differences between the
major generator retailers was a strong indicator that the lack of suitable LPR
management tools at the time was an impediment to more robust retail competition. If it
was difficult for the large generator retailers to manage LPR, the Commission considered
it was likely to be even more difficult for small prospective new entrant retailers.
3.37 The Commission also considered the retail margins for the dominant retailer in each
region (line company network areas). It found that in 2007-08 there was evidence that
the estimated incumbent retail margin for medium-use residential customers was high in
a number of regions (such as Masterton, Buller, Wairoa and Blenheim) where LPR was
more prevalent. This is shown in Figure 3 below.
23 Figure 9, Electricity Commission, Consultation Paper: Managing locational price risk proposal, September
2010. Available here: https://www.ea.govt.nz/about-us/what-we-do/our-history/archive/dev-archive/work-
programmes/market-wholesale-and-retail-work/ftr-development/consultation/#c8177.
12Figure 3 Estimated incumbent margin for medium-usage residential customers in
2007-08 24
3.38 The Commission did not present any evidence that LPR was having an impact on
generator and direct connect customer decisions.
LPR will evolve over the next decade
Observation 1: Changes in the make-up of renewable generation
will see LPR continue to change over the next 10 years.
3.39 The Authority expects LPR will likely change over the next ten years, especially with the
transition to 100% renewable generation and other key developments, such as the
implementation of Real-Time Pricing (RTP).
3.40 The Authority expects some change to LPR will be driven by greater nodal price
volatility, caused by increasing operation of intermittent renewable generation (solar and
wind) and nodal scarcity pricing. 25 However, some of this volatility may be mitigated
through the physical management of price risk. For instance participants may respond to
price changes by changing demand levels or through dispatch notification for smaller
market participants as part of RTP. The forthcoming changes to the Transmission
Pricing Methodology may incentivise participants to mitigate LPR by contributing to grid
upgrades.
3.41 With the transition to 100% renewable generation, there is the possibility that changes in
the makeup of renewable generation could result in changes to the pattern of
24 Figure 10, Electricity Commission, Consultation Paper: Managing locational price risk proposal, September
2010. Available here: https://www.ea.govt.nz/about-us/what-we-do/our-history/archive/dev-archive/work-
programmes/market-wholesale-and-retail-work/ftr-development/consultation/#c8177.
25 Nodal scarcity pricing, also known as scarcity pricing, introduces a price floor and price cap mechanism
during scarcity, providing revenue certainty for providers of last resort resources (generation and demand
response), while also giving more assurance to wholesale purchasers that spot prices will not be
unreasonably high.
13transmission flows and nature of locational and other price risk. For example, with
increased wind and solar generation, the dominance of hydro-generation is expected to
decrease over time. If this were to occur, then the pattern of electricity flow might change
from the currently predominant South to North flows to more variable patterns depending
on wind and sunshine. The change in power flows will alter inter-island and inter-regional
LPR and will be an important consideration for the Authority on how it aligns with
efficiency limb of the statutory objective.
3.42 The Authority also expects potential new sources of LPR to arise as New Zealand
diversifies and invests in different sources of renewable generation. For example, the
increase in solar investment taking place in the upper North Island might create new
sources of risk between Northland and the rest of the transmission network.
14The Authority has made several observations
regarding the current policy settings of the FTR
market
4.1 The objective of introducing FTRs was to promote competition in the electricity industry
for the long-term benefit of consumers – in accordance with the first limb of Authority’s
statutory objective. 26
4.2 In 2020, concerns were raised by market participants with the Authority regarding the
operation of the FTR market. 27 Questions were also raised by the Authority’s Board
members following the FTR and wholesale market review.
4.3 As part of the Authority’s strategic focus on efficient risk markets to support the transition
to 100% renewable generation, the Authority is assessing the current FTR market and
LCE allocations to understand the issues and opportunities that exist.
4.4 In this section the Authority considers the extent to which the FTR market has:
(a) enhanced retail competition, and
(b) enhanced regional generator competition.
4.5 In particular, the Authority is considering the impact the FTR market has as a
mechanism for managing LPR, including:
(a) the cost to support the FTR market,
(b) if policy settings mean some or all FTR participants are not using the market to
manage LPR (ie. they may be profiting from FTR market with little or no benefit for
consumers, although it is understood some FTR participants are using FTRs as a
proxy for energy hedges), 28
(c) how tightly targeted the FTR market is to managing LPR, and
(d) why parties (particularly direct connect consumers and independent retailers) who
are subject to LPR are not using the FTR market.
4.6 The Authority has also made observations about features of the FTR market that appear
to either work against, or do not support, the long-term interests of consumers.
26 Paragraph 1.4.3, Electricity Authority, Information Paper: Improving the Opportunity to Hedge New Zealand
Electricity Prices. Available here: Microsoft Word - Locational hedge proposal consultation paper_For public
release (6).DOC.
27 Available at https://www.ea.govt.nz/assets/dms-assets/29/Letter-to-the-requestor-26-November-2021.pdf
28 Given that the loss component of LCE makes up a high portion of total LCE and is highly correlated with
energy prices.
15Retail competition has improved since the FTR market started,
but the FTR market’s contribution is not clear
Observation 2: Retail competition has increased over time,
however it is difficult to determine the influence that FTRs have on
retail competition.
4.7 Since the inception of the FTR market in June 2013 the market share of incumbent
retailers has reduced, while the market share of other retailers has increased
significantly, resulting in a more competitive retail environment. This is shown in the
following five charts, Figures 4 - 8.
These charts show the trends in retail market shares for the five largest generator
retailers (Contact, Genesis, Mercury, Meridian, and Trustpower) and the remaining
retailers (combined) for the Upper North Island (UNI), Central North Island (CNI), Lower
North Island (LNI), Upper South Island (USI), Lower South Island (USI) regions over the
past 18 years. 29
4.8 In all five regions there has been an increase in the market share of small and medium
retailers since the inception of the FTR market in June 2013. This has largely come at
the expense of market share by the incumbent retailers. 30 However, in all five regions
there had already been substantial reductions in incumbent retail market share before
FTRs were introduced.
Figure 4 Upper North Island retail market share trends
29 Note that the horizontal axis markers indicate the end of the stated year (not the beginning).
30 Although this isn’t always the case. In the USI region, the current market share of one of the incumbents
(Meridian) is similar to what it was in June 2013, while there has been a decline in the market share of the
other four large generator-retailers.
16Figure 5 Central North Island retail market share trends
Figure 6 Lower North Island retail market share trends
17Figure 7 Upper South Island retail market share trends
Figure 8 Lower South Island retail market share trends
4.9 However, there have been a range of other changes that occurred during (and just prior)
to the period since June 2013 that have likely contributed to enhanced retail competition.
These changes include:
(a) virtual assets swaps between some of the generator retailers,
(b) the ownership transfer of the Tekapo A and B power stations from Meridian to
Genesis,
(c) changes to the Australian Securities Exchange (ASX) NZ electricity futures and
options market (including voluntary market-making arrangements and a reduction
in contract size from 1 MW to 0.1 MW, increased volumes of market made
contracts and lower bid/offer spreads),
(d) lowered barriers to enable lines companies to retail subject to certain conditions,
and
18(e) improvements in the standardisation of distributors’ use-of-system agreements and
tariff structures.
4.10 Therefore, it is difficult to determine any incremental retail competition benefits due
specifically to the FTR market. However, two respondents to the Authority’s survey in its
post-implementation review of FTRs said that FTRs had been a significant factor in
enabling them to expand their retailing into new geographical areas. 31
The effect on retail competition in Hawkes Bay from introducing the
Redclyffe hub is unclear
4.11 The Authority considered a localised example of retail competition to determine if there is
a link between an increase in retail competition and the introduction of FTRs. One of the
new FTR hubs introduced in May 2018 was Redclyffe in the Hawkes Bay. 32 If the FTR
market is enhancing retail competition by making it easier for retailers to manage LPR
then the introduction of the Redclyffe FTR hub would have improved retail competition in
the Hawkes Bay. The introduction of the Redclyffe FTR hub may also have made it
easier for retailers to manage some LPR in Gisborne, however as constraints do occur
between the Hawkes Bay and Gisborne 33, any improvement in retail competition would
be less in Gisborne than it is in the Hawkes Bay.
4.12 Retail competition data in both the Hawkes Bay and Gisborne suggests there is no
obvious improvement in retail competition in the Hawkes Bay relative to Gisborne since
the Redclyffe FTR hub was added. This conclusion is based on the following
observations (which are shown in Figures 9 - 11 below):
(a) the market share of incumbents in Hawkes Bay and Gisborne both fell post-2018,
but this was a continuation of downward trends that started much earlier,
(b) the market share of small and medium retailers in Hawkes Bay and Gisborne grew
following the introduction of the Redclyffe FTR hub, but this growth commenced
well before the Redclyffe FTR hub was introduced, and
(c) the unregulated components of electricity bills (retail and energy components) for
Napier (used as a proxy for Hawkes Bay) and Gisborne have all grown since 2018
and Napier’s energy component has grown faster than Gisborne’s energy
component. Some of this increase appears to be due to underlying energy costs in
New Zealand.
4.13 Therefore, it is not clear that the introduction of the Redclyffe FTR hub has had any
impact on retail competition in the area.
31 Research report can be found at https://www.ea.govt.nz/assets/dms-assets/26/26804Perceptions-of-
Financial-Transmission-Rights-Research-Report.pdf.
32 In May 2018 RDF2201 was introduced as an FTR hub. Retail purchases are made downstream from
RDF2201 at the RDF0331 grid exit point. While constraints can occur between RDF2201 and RDF0331,
prices are generally highly correlated between the two points (correlation coefficient of 0.97).
33 The spring washer effect occurs on occasions between Redclyffe, Fernhill and Tuia creating high prices at
Fernhill and Tuia.
19Figure 9 Hawkes Bay retail market share trends
Figure 10 Gisborne retail market share trends
20Figure 2 Retail and energy components of Napier and Gisborne electricity bills
There has been no discernible effect on regional generator
competition due to FTRs
Observation 3: There has been no apparent impact on generator
competition due to FTRs.
4.14 One of the expected benefits from the introduction of FTRs was increased generator
competition due to generators locating in regions subject to LPR. This relates directly to
the competition and efficiency limbs of the Authority’s statutory objective.
4.15 However, it is not clear that any decisions on where to locate generation investment
have been affected by the introduction of FTRs. Significant power stations
commissioned since 2013 are listed in Table 3, below.
21Table 3 Significant power stations34 commissioned since the start of the FTR
market
Power Owner Technology Location Commission
scheme Date
Amethyst Westpower Hydro West Coast 2013
Esk Trustpower Hydro Hawkes Bay 2013
McKee Todd Energy Thermal Taranaki 2013
Ngatamariki Mighty River Geothermal Waikato 2013
Power
Rochfort Kawatiri Energy Hydro West Coast 2013
Mill Creek Meridian Energy Wind Wellington 2014
Te Mihi Contact Energy Geothermal Waikato 2014
Flat Hill Pioneer Wind Otago / 2015
Generation
Southland
Te Ahi O Maui Eastland Geothermal Bay of Plenty 2018
Generation
Ngawha - Top Energy Geothermal Northland 2020
Expansion
Matiri Southern Hydro Nelson / 2020
Generation
Marlborough
Partnership
Junction Road Nova Energy Gas Taranaki 2020
Waipipi Mercury Energy Wind Taranaki 2021
Turitea 35 Mercury Energy Wind Manawatu 2021
4.16 For many of the power stations commissioned in 2013-2015 the decision to proceed with
the investments would have been made before the FTR market was established.
34 Power stations with capacity greater than 4 MW.
35 Turitea (which includes Turitea North and Turitea South) is only partially commissioned.
224.17 However, even for the power stations commissioned later, the primary factors driving the
location of many of the new generation stations seem to be proximity to fuel and ease of
connection to the grid. Proximity to load is also likely to be a consideration in some
cases.
4.18 For example, Trustpower (the original developer of the Waipipi wind farm) noted that the
Waipipi site was attractive because it was more exposed to a southerly wind flow than
the company’s Tararua wind farm, the site was flat and not overly complex, the wind
farm could help it more effectively store water in its nearby Patea hydro scheme, and it
was ideally located to provide generation to Auckland and Wellington’s large urban
loads. 36
4.19 There has not been public indication that any of the power stations listed in Table 3 or
any recent commitments to develop power stations (such as Meridian’s Harapaki wind
farm in the Hawkes Bay and Contact’s Tauhara geothermal plant in the Waikato) were
swayed by the existence of the FTR market. In addition, no respondents to the
Authority’s survey for its post-implementation review of the FTR market said FTRs had
helped them locate generation in new areas. 37
The costs to support the FTR market are high
Observation 4: FTRs currently use an average of $5.29 million per
month from LCE (~47% of total LCE) to settle.
4.20 FTRs are funded using a combination of FTR auction revenue and FTR rentals from the
LCE allocation. Any of the LCE allocation not needed to fund FTR payments is given to
Transpower to allocate to transmission customers.
4.21 It was proposed that the revenue to support revenue adequacy would come from any
premium above the value of the FTR rental. This was assuming a risk-averse buyer
would pay a premium above the full value of the FTR rental, which would result in total
auction revenue exceeding the quantity of rentals for FTR settlement. 38
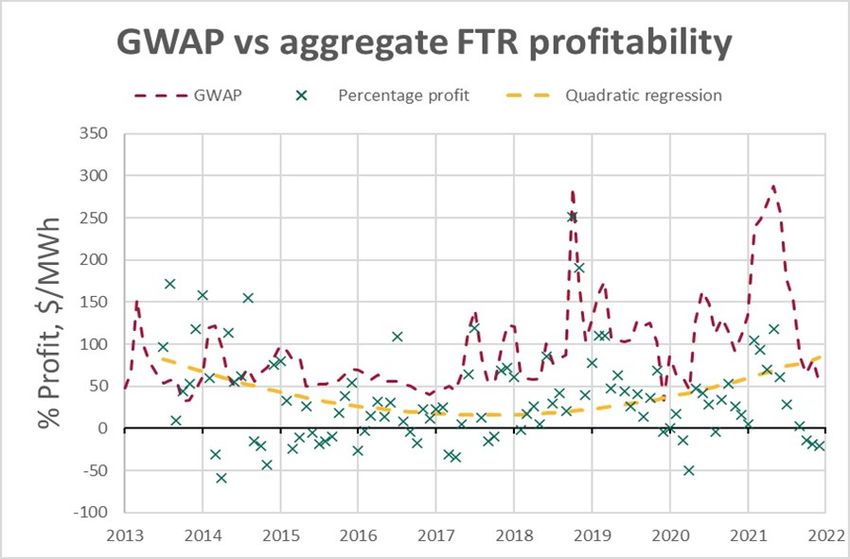
4.22 However, that Authority have observed aggregate FTR funding to have increased over
time since the FTR market started in 2013. This suggests a misalignment with the
efficiency limb of the Authority’s statutory objective. This is largely due to increases in
the number of FTR hubs in 2014 (from two hubs to five hubs) and in 2018 (to eight
hubs). Auction revenue has increased (due to auctioning additional FTRs) and there has
also been an increase in the LCE allocation for FTR rentals due to contributions from
additional network sections. This is shown in Figure 12 below.
36 Energy News, available here: https://www.energynews.co.nz/news-story/9144/trustpower-seek-consents-50-
turbine-waverley-wind-farm and https://www.energynews.co.nz/news-story/wind/28984/waverley-ideally-
placed-meet-north-island-demand.
37 Electricity Authority, Perceptions of Financial Transmission Rights. Available here:
https://www.ea.govt.nz/assets/dms-assets/26/26804Perceptions-of-Financial-Transmission-Rights-
Research-Report.pdf
38 Paragraph 3.4.141, Electricity Authority, Consultation paper: managing locational price risk: Proposed
amendments to Code. Available here: Consultation Paper (ea.govt.nz)
23Figure 32 FTR funding sources (July 2013 – December 2021)
4.23 The average amount of LCE required to support the FTR market has also been
increasing as the FTR market has expanded. The long-term average LCE required to
support the FTR market has increased from $0.77 million per month (13% of total LCE)
where there were two FTR hubs to $1.34 million per month (17% of total LCE) with five
FTR hubs and currently sits at $5.29 million per month (47% of total LCE) with eight FTR
hubs.
4.24 Figure 13 illustrates the LCE required to support the FTR market and how this has
increased as the FTR market has grown. Auction revenue has been increasing over the
last couple of years while FTR rentals show no net increase. Auction revenue is
expected to be less volatile than LCE and FTR settlement, as auction revenues are
based on expectation. Also, since auction revenues are set up to 24 months ahead they
will tend to show a lagged trend, if energy prices (and FTR payouts) are trending
upwards.
24Figure 43 FTR funding sources trending (July 2013 – December 2021)
Increase in FTR hubs sees a higher proportion of LCE made available for
the FTR market
4.25 This is also reflected in the proportion of LCE allocated to FTR rentals (shown by the
yellow bars in Figure 14) – much of this increase will be due to the increase in the
number of FTR hubs (particularly the increase from two FTR hubs to five FTR hubs in
December 2014) increasing the amount of LCE available for the settlement of FTRs.
4.26 Since June 2018 onwards (when the FTR market was increased to eight FTR hubs) an
average of 90% of total LCE was made available to settle FTRs, while prior to this date
an average of 70% of total LCE was available to settle FTRs.
4.27 However, the proportion of LCE required to fund the FTR market has increased since
2018 as spot prices have increased (shown by the green bars in Figure 14).
25Figure 54 Proportion of LCE allocated to FTR rentals
Some FTR participants profits may not be directly related to
consumer benefit
Observation 5: Some parties may be consistently profiting from
FTRs without a clear benefit to consumers.
4.28 FTR participants have profited from the FTR market since its inception—the number of
months where LCE has been required to support the settlement of FTRs has significantly
outnumbered months where there was more auction income than payments. In addition,
FTR profits have increased over time—this may be due to the increase in the number of
FTR hubs and increase in FTR capacity made available by the FTR manager. This is
shown in Figure 15 below.
26Figure 65 Monthly FTR profit (July 2013 – December 2021)
4.29 Figure 16 below, shows the acquisition cost of FTRs has steadily increased over time,
while the settlement amount (the amount paid out to FTR purchasers) has also
increased. 39 At least some of these increases are likely due to the introduction of
additional FTR hubs. While there has been some step up in average FTR profit 40 in the
past four years, the growth has been less pronounced than the increase in the
acquisition cost and settlement amount. When FTR profits are viewed on an annual
basis, aggregate profits have peaked at approximately $65 million per annum in the past
four years.
39 Note that the settlement amount paid out has been more volatile than the acquisition cost. This is
expected—FTRs are paying out on location price differences, which are volatile, and why a mechanism for
managing LPR (such as FTRs) is needed.
40 Note that FTR profit is equal to the settlement amount less the acquisition cost.
27Figure 76 Annual FTR cashflow (CY2013 – CY2021)
4.30 Table 4 shows the observed performance for all FTR participants between the years
2013 and 2021.
4.31 When all FTR participants are observed collectively, months are profitable 2/3 of the time
(66%) with the average profit per MWh for each FTR participant being $0.78/MWh.
4.32 To provide some context against FTR volume traded, below in Figure 17 is the average
monthly FTR volume in MWh for the years between 2013 and 2021.
Figure 87 Monthly Average FTR volume per annum (CY2013 – CY2021)
4.33 Note that data presented does not include August 2021 because the transactions for the
month are yet to be settled due to the ongoing 09 August peak demand event
investigation. 41
41 Reference: https://www.ea.govt.nz/assets/dms-assets/29/9-August-2021-UTS-Preliminary-decision-
paper.pdf
28Table 4 Monthly FTR profit and loss by FTR participant (2013 – 2021) 42
Participant % of profitable months Profit/loss per MWh
Number
1 100.00% $5.57
2 92.86% $3.45
3 68.63% $0.85
4 82.95% $0.57
5 74.26% $0.96
6 59.09% $1.20
7 82.05% $1.32
8 100.00% $5.84
9 32.43% -$2.03
10 52.13% $0.76
11 78.22% $1.22
12 54.17% $0.11
13 62.75% $0.20
14 22.22% -$6.67
15 69.61% $1.19
16 25.00% -$0.04
17 N/A N/A 43
18 43.24% -$0.20
19 60.00% $0.16
Overall % of profitable Weighted average of profit/loss
months for all months per MWh for all months
66% $0.78
4.34 The profitability of FTRs may suggest they are inherently undervalued. FTR participants
are benefiting from this undervaluation and it is not immediately clear how the Authority
maintaining and operating the market, and allowing the use of LCE to support the
settlement of these FTRs, contributes to the long-term benefit of consumers.
4.35 Some FTR participants have purchased FTRs at a loss, in this situation FTRs could form
part of a wider hedging strategy that on average does not require a large amount of
LCE.
42 Excluding profit/loss on disposal prior to settlement, ie, only includes FTRs held to settlement
43 FTRs were sold via reconfiguration auction prior to settlement
294.36 Some of the participants that purchase FTRs do not have exposure to LPR, and their
use is not directly linked to management of locational price risk from the spot market. It is
important to note that the presence of non-physical financial parties increases the
settlement price of FTRs and contributes to the efficiency of the FTR price. An efficient
FTR price should not require both LCE and auction revenue to settle the market over the
long term. Fewer FTR participants would likely result in a greater share of LCE being
used for the settlement of the FTR market.
Observation 6: The LPR due to losses is highly correlated with
energy prices while LPR due to constraints is not.
The FTR market is not tightly targeted at the LPR problem
4.37 The FTR market pays out on locational price differences due to both constraints and
losses. Loss rentals are highly correlated with energy prices (around 90% for the period
2013-2021) so do not contribute significantly to LPR. However, the correlation between
constraint rentals and energy prices was about 1% for the period 2013 - 2021 and is a
large source of LPR.
4.38 However, as indicated in Table 5 below, the majority of FTR rentals, and consequently
profits from the FTR market, are related to loss rentals. 44
Table 5 FTR rental decomposition (2013 – 2021)
FTR rental component % of total FTR rental (2013 – 2021)
AC branch constraint rental 0.01%
Branch group constraint rental 2.85%
Loss constraint rental 77.17%
HVDC rental 19.97%
4.39 The breakdown of FTR rental components is provided in Figure 18. The majority of the
FTR rental is contributed from loss constraint rentals and HVDC rentals, with a small
contribution from branch group constraint rentals and negligible contribution from AC
branch constraint rentals. 45
44 Loss constraint rental in Table 4 refers to the amount of LCE generated by each AC line loss curve block
that is to be applied to settlement of FTRs (as defined in Schedule 14.3 of the Code). This is commonly
referred to as “loss rentals”.
45 “AC branch constraint rental” in, Table 4 and Figure 17 refers to the amount of LCE generated by individual
branch limits. Typically branch group constraint limits are reached before individual branch limits.
30You can also read