Fiscally sound and seeking growth - we need more infrastructure. Jarrod Kerr - Whanganui Chamber of ...
←
→
Page content transcription
If your browser does not render page correctly, please read the page content below

Fiscally sound
and seeking
growth
…we need more infrastructure.
                                     Connect with KiwiEconomics on:

Jarrod Kerr       Jeremy Couchman                    @kiwieconomics
                                             inner.kiwi/commentary/
Chief Economist   Senior Economist    kiwieconomics@kiwibank.co.nz
Everything we need to know…
      Interest rates are low, very low, and will remain very low for a very long time.

                %
                                        Interest Rate Curves
                                                  (Bond Rates)

  Rate cuts    2.00                                                                              We’re below
  are priced                                                                                         1%!
               1.60
                                                                                           USD
                            US+1
               1.20
                                                                                          NZD
               0.80                                                                       AUD

               0.40                                                                        GBP

               0.00
                                                                                           JPY
               -0.40

               -0.80                                                                       GER

               -1.20
                    Cash   6m   1yr   2yr   3yr     4yr   5yr    6yr   7yr   8yr   9yr   10yr                  2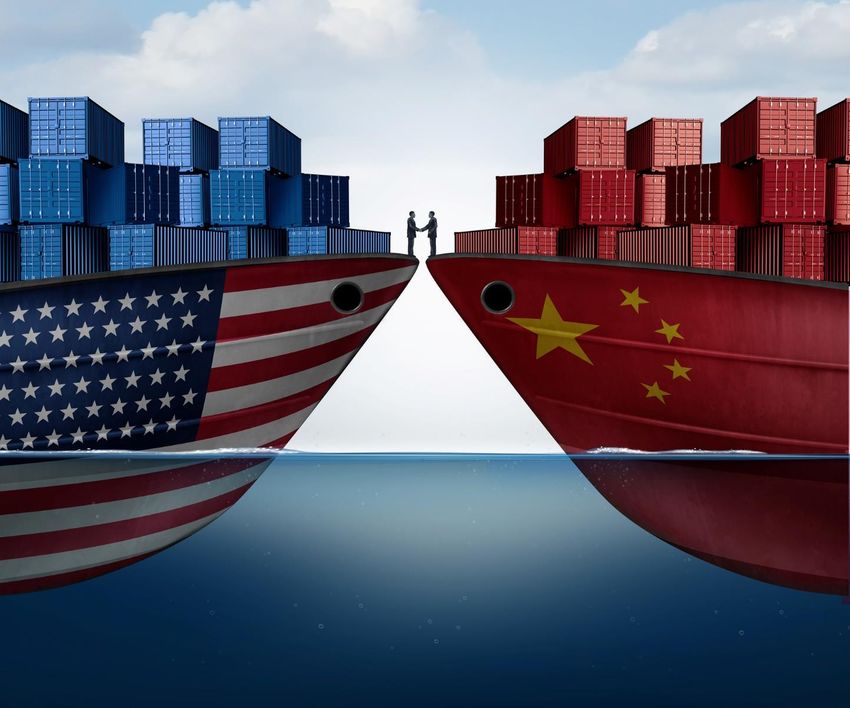
Term interest rates are falling… fast.
Over $16 TRILLION is invested in bonds with NEGATIVE interest rates.
                                                                                     KIWI bonds are still attractive.
               Value Invested in Negative Yielding Bonds
US$ trillion             (USD amount invested globally)
$18                                                                                            NZGB versus UST and Average AAA
                                                                          %
                                                                                              (New Zealand 10-year Govt Bond yield against "peers")
                                                                         5.0
$15
                                                                         4.0
                                                                                             NZGB-UST 10-year
$12                                                                                          NZGBs versus average AAA's 10-year
                                                                         3.0

 $9                                                                      2.0

                                                                         1.0
 $6

                                                                         0.0
 $3
                                                                         -1.0
                                                          Barcap Index          90      94          98           02          06           10          14   18
 $0
      2009 2010 2011 2012 2013 2014 2015 2016 2017 2018 2019 2020

                                                                                                                                                            3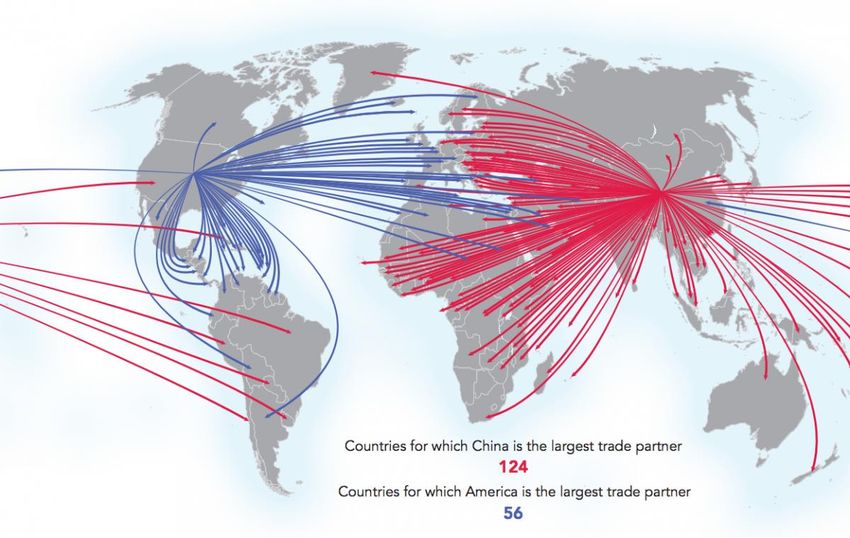
There are 5 reasons
for record lows
rates:   1. Demographics
        2.   Inequality
        3.   Populism
        4.   Disruption
        5.   Fiscal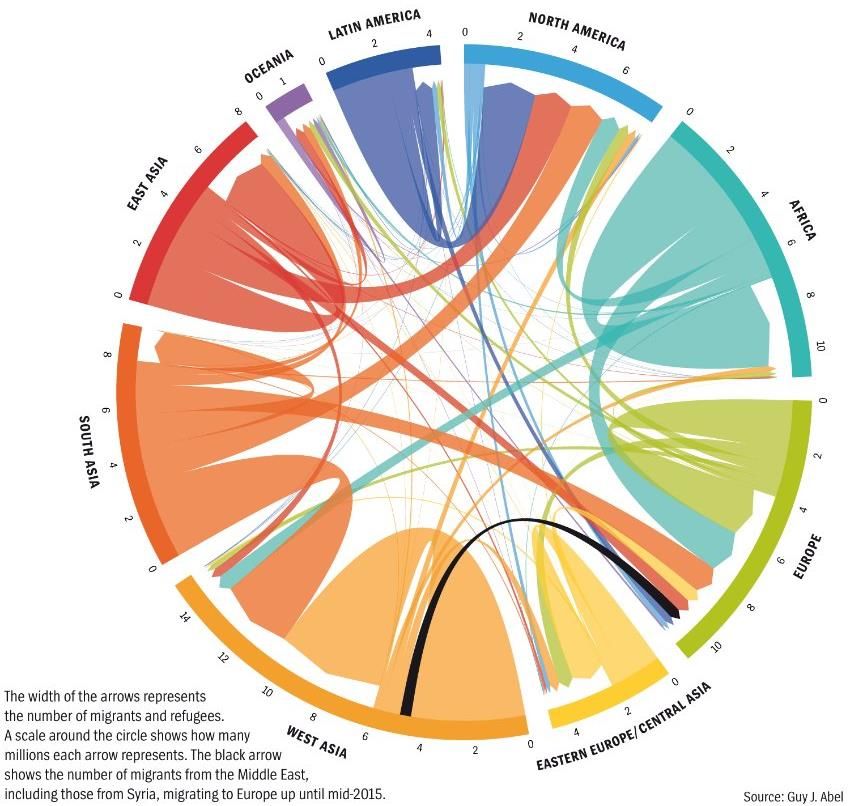
The secular decline in real interest rates, globally.

                                Source: NZIER

                                                        5
#1 The tectonic shift in demographics
     Life Expectancy
                                        Real Interest Rate

       Net Worth

                                                             6
#2 The rise in inequality is enraging many
             Weak wages growth, especially for the lower deciles.

                                                                    7
#3 The rise of the angry voter, is popular in disbelief.
   Rising Inequality has produced populists in: Trump’s US, Italy, Philippines, Turkey,
   Brazil, plus Brexiteers, and Frexit followers.

  *The latest point includes cases like Trump, UKIP in the UK, AfD in Germany, National Front in France, Podemos in Spain, and Five Star Movement
                                                                                                                                                          8
  in Italy. It doesn’t include major emerging country populists, like Erdogan in Turkey or Duterte in the Philippines. (Bridgewater Daily Observations)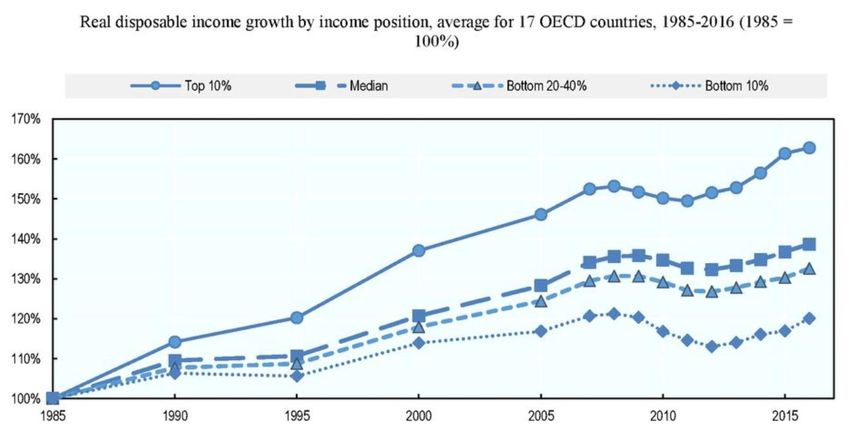
#4 Disruption includes globalisation and technology
                                   Protectionism is flaring up (again) post-crisis.
      KOF Index of Globalisation
              (1970-2015)
                                           G-20:Trade
                                                 RESTRICTIVE       TRADE in
                                                      Restrictive Measures MEASURES
                                                                            G20
                                             (cumulative  measures
                                                 (Cumulative           introduced
                                                             measures introduced fromsince
                                                                                     2008) 2008)
                                            No.                                               No.

                                                         Source: WTO

                                           1200                                              1200

                                            800                                              800

                                            400                                              400

                                              0                                              0
                                                  2010         2012    2014      2016            9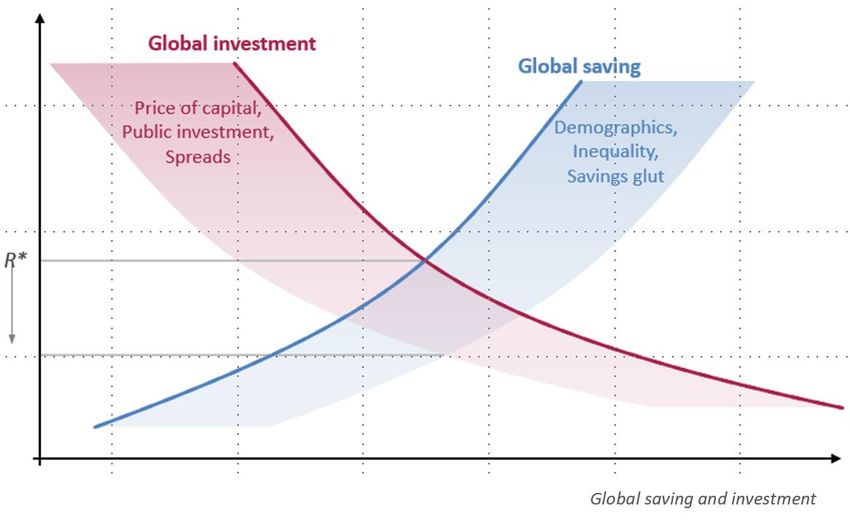
#5 Fiscal austerity is exactly what we don’t need.
  “The persistence of low inflation and low interest rates is not a surprise when,
  as has been true in fact, the low interest rates fail to generate substantial
  fiscal expansion.”
  Christopher Sims, Fiscal Policy, Monetary Policy and Central Bank Independence
              $billions                                                         % of GDP
              80                                                                       32
                                                              Forecast
              70                                                                       28

              60                                                                       24

              50                                                                       20

              40                                                                       16

              30                                                                       12

              20                                                                       8

              10                                                                       4

               0                                                                       0
                   2009   2011    2013     2015      2017     2019       2021   2023
                                          Year ending 30 June
                             Net core Crown debt    % of nominal GDP (RHS)                  10
Keeping your finger on the impulse.
We get a good, delayed, lift from the Budget. But then we get a drag on growth…
% of GDP % of GDP
10 4
Forecast
5 2
0 0
-5 -2
-10 -4
2009 2011 2013 2015 2017 2019 2021 2023
Year ending 30 June
Fiscal impulse (RHS) OBEGAL CAB 11We are growing well, with a boost to come.
Keeping our finger on the impulse, we get a good lift from the Budget(s).
Annual average % change
5
Forecast
4
3
2
Impulse is delayed
but still large
1
0
Jun-12 Jun-15 Jun-18 Jun-21
Quarterly
Treasury Budget Update RBNZ May MPS Kiwibank 12Inflation is still some way away.
Treasury is the most optimistic, well ahead of the RBNZ and Kiwibank.
Annual % change CPI Inflation
3.0
Forecast Treasury has the
strongest profile
2.5
2.0
RBNZ:
June
1.5
2021!
1.0
0.5
0.0
Jun-12 Jun-15 Jun-18 Jun-21
Quarterly
Treasury Budget 2019 RBNZ May MPS Kiwibank 13The RBNZ are likely to cut again, and again…
Market traders always look to the next move, and the next.
The RBNZ have given
us a 36% probability of
another cut to 0.75%
Market traders are playing
the risk of more.
14Labour pains: firms are complaining of labour
costs/shortages, and Labour policies
39326
39417
39873
39965
40513
40603
41061
41153
41699
41791
42248
42339
42887
42979
38869
38961
39052
39142
39234
39508
39600
39692
39783
40057
40148
40238
40330
40422
40695
40787
40878
40969
41244
41334
41426
41518
41609
41883
41974
42064
42156
42430
42522
42614
42705
42795
43070
43160
43252
Net % Business Confidence Net %
80 80
60 60
40 40
20 20
0 0
Labour, and
-20 -20
Labour
-40 -40
ANZ general confidence
-60 -60
NZIER's QSBO general business conditions
Source: ANZ, NZIER
-80 -80
Jan-06
Sep-06
May-07
Jan-08
Sep-08
May-09
Jan-10
Sep-10
May-11
Jan-12
Sep-12
May-13
Jan-14
Sep-14
May-15
Jan-16
Sep-16
May-17
Jan-18
Sep-18
May-19
GDP and ANZ Business Activity Outlook Agriculture, or Wellingtonians?
Net % Ann %
80 8
70 ANZ Own Activity Outlook
Source: NZIER
60 GDP 6
50
4
Business confidence should be supported by:
40
30
2
20
10
0 Abolition of CGT, and nothing unheard-of
in the tax group.
0
-10 -2
-20
-30
2005 2007 2010 2013
Source: ANZ, Statistics NZ
2016 2018
-4 Lower interest rates.
15Taking the pulse
of the regions
Regions cool but
it’s not all badEconomic factors 2019
Economic factors 2016
17Tourism is directly exposed to slowdown in global growth
18Agriculture is protected by commodity prices for now
19There are 3 Ps to
Property:
1. Population
2. Preference
3. Policy#1 Population: a mammoth migration boom...
000s %
60 30
Net Inflow RBNZ
HP (F) Our population estimates
KiwiBank (f) do not peak, in our
40 20
lifetimes.
20 10
0 0
-20 -10
00 06 12 18
21…concentrated in the north, but a boost everywhere!
22We like playing with models. Here’s ours…
Change in Housing Demand and Supply
45,000
Number of Dwellings
40,000
Demand Supply
35,000
30,000
25,000
20,000
15,000
10,000
5,000
Sources: StatsticsNZ, Kiwibank
0
1992 1994 1996 1998 2000 2002 2004 2006 2008 2010 2012 2014 2016 2018
23We are short 130,000 homes!
The recent spike in
people per dwelling
confirms undersupply.
Think battery hens rather
than free range. People’s
preferences are adapting.
24The regions are playing catch up… as some Aucklanders leave
But not just investor led,
Population is playing a role too!
25The hunt for yield……has led Aucklanders to the regions.
26#2 Preference: is now higher density (globally)
27Auckland and Queenstown benefited from
foreign buying.
REINZ house price index
3-mth annual % change
Foreign buying comes and goes,
35 35
30
New Zealand
30
and then comes back again.
Hawkes Bay
25 Southland 25
20 Auckland 20
Manawatu-Whanganui
15 15
10 10
5 5
0 0
-5 -5
-10 -10
Source: REINZ
-15 -15
2009 2010 2011 2012 2013 2014 2015 2016 2017 2018 2019
Chinese buying had a large impact on
Auckland, as well as Sydney, Melbourne,
Vancouver, Singapore and London.
English Property Rights#3 Policy: Macropru policy restrained investors
“We find that the LVR restrictions have significantly
improved the resilience of the banking system.” RBNZ
LVR Review 2019
• Lending was a little too aggressive over 2014-16.
• Now lending is safer, but slower.
First home buyers have increased as
a percentage of total.
29Are there any questions
30The tectonic shift in demographics
Population growth rates are falling, and we’re ageing.
%
Fall of Rome WWI WWII
Jesus 1970 2020
25
World Population Growth
20
Average Interest Rate
15 1920-40
spike
10 1800s
~5%
1985
5
1950
0
Black
Death
-5
31Brexit Breaking Bad…
Brexit is possibly the most complicated political situation you’ll ever see.
32Globalisation, and EU entry, exposes some workers.
The relative wages of workers exposed to global labour markets get squeezed.
33Tr(i)umphant Trump is a Populist Protectionist…
The US-China trade deal should be signed, but is only the start.
34We are geographically closer to the action.
We are right next door to the most populous part of the planet.
35“Migration paths do not lead primarily
from very poor to very rich countries,
but rather adhere to a graduated
model. People move to countries
where the economy is somewhat
stronger than in their native country…
from Bangladesh to India or from
Zimbabwe to South Africa.”
• The US attracts a vast array of
migrants (Latin, Asian, African).
• The EU also attracts many migrants
from many nations (African, Asian).
• Most of Asia’s migrants stay on the
continent (despite largest outflows).
• Australia and New Zealand now
attract more migrants from East
Asia, South Asia, and Africa over
Europe.
36New Zealand
372030
Rising powers
US 20.4
2016
US 22.3 China 16.1
China 12.5 India 6.2
1990 Japan 7.4
US
Japan 5.6
Germany
24.2 4.8
Japan 12.2 France 3.6
Germany 3.7
Germany 7.1 UK 3.5 UK 3.3
France 5.1 India 3.5 France 3
Italy 4.6 Brazil 3
Million Brazil 2.7 India
UK 4.1 Italy 2.6
Brazil 3.1 Canada 2.1 China
2,000 Canada 2.4
Russia 3 Italy 2
China 2.7
2020
Canada 2.6
1400mn 2070
1,600 1390mn India 1750m
1980
1,200 975mn
695mn
1850 1950 2050
China ~430mn 540mn India ~1700m
800
India ~285mn 375mn China ~1350mn
400
0
38China is the world’s largest trading partner.
39China’s new silk road and belt initiative is BIG.
4035 strategic Chinese-funded ports, will test the US.
Source: NY Times
41Protein consumption and wealth increase together.
China was once worse (lower) than India. India will one day match China today.
CBA TEI & THE CASH RATE
%pa %pa
7.0 8
Cash
rate
6.4 (lhs) 5
5.7 2
5.1 -2
4.4 -5
CB A TEI*
(adv 9 mnths ,rhs)
* Deviation from trend
3.8 -8
Jul-97 Jul-99 Jul-01 Jul-03 Jul-05
42Airline travel and wealth also move in line.
China is still growing in travel, and India has a lot of catch up to do.
CBA TEI & THE CASH RATE
%pa %pa
7.0 8
Cash
rate
6.4 (lhs) 5
5.7 2
5.1 -2
4.4 -5
CB A TEI*
(adv 9 mnths ,rhs)
* Deviation from trend
3.8 -8
Jul-97 Jul-99 Jul-01 Jul-03 Jul-05
43We are influenced by machines every day
“Disinformation and misinformation on social media
are exacerbated by algorithms that encourage viral
sharing”. Platforms encourage clicks and likes, not
artistic or civic values. #Fakenews…
“A few providers are responsible for the majority of
referral traffic, and just 5 companies take in almost
80% of global mobile advertising revenue – with
Google and Facebook getting 90% of the growth”.
We will see debate on the aligning of societies values to the use of AI.
44Financial markets have used machines for years.
Source: WilmotML
45What could possibly go wrong?
Thank you…..and here’s our disclaimer!

  All content is for information only, is subject to change
   and is not a substitute for commercial judgement or
   professional advice, which should be sought prior to
   entering any transaction. To the extent permitted by
   law Kiwibank disclaims liability or responsibility to
   any person for any direct or indirect loss or damage
 that may result from any act or omission by any person
                  in relation to the material.

                                                              47
You can also read