Avoiding Collateral Surprises: Managing Multi-Currency CSAs
←
→
Page content transcription
If your browser does not render page correctly, please read the page content below
Avoiding Collateral Surprises:
Managing Multi-Currency CSAs
Anna Barbashova, Numerix - 24 Jan 2013

This article explores multi-currency credit support annexes (CSAs) in the derivatives area and their
potential impact on pricing for treasurers and other financial professionals. Related challenges that
practitioners face in terms of collateral management and optimisation is also explored. It highlights
why efficient collateral management is fundamental in the new post-crisis world, and identifies why
cheapest-to-deliver (CTD) collateral can be necessary for profit, effectiveness and liquidity.

W
          ith the derivative markets having changed dramatically since the 2008 financial crisis,
          regulatory reform and structural changes to the financial markets have resulted in the
          increased collateralisation of trades and a move to central clearing of vanilla trades.
Financial practitioners are witnessing increased usage of collateral as a way to mitigate the risk
of counterparty default. Many of these changes have had a dramatic impact on how deriva-
tives are fundamentally priced, with collateral choices impacting the discounting curves used in
valuations. Adding to the post-crisis drama has been the divergence in rates and significantly
widened basis swap spreads. Traders acting on behalf of treasurers and other financial prac-
titioners also face challenges surrounding the overwhelming complexity of the Credit Support
Annex (CSA) in terms of embedded optionality.

This study goes on to give several illustrative examples on how to construct cheapest-to-deliver
(CTD) curves and demonstrates how they enable practitioners to select appropriate collateral. It
also provides several pricing case studies involving interest rate swaps. As we come to better
understand the complexity of current CSA agreements, the article seeks to uncover what the future
might look like with the new standard CSA to reduce optionality.

The Complexity of CSA Agreements
A significant number of CSAs allow counterparties to choose collateral from a big list of eligible
currencies and securities; furthermore, different currency collateral and types of collateral have
different impacts on valuation. Given that almost every CSA agreement is unique, it is no won-
der that a lack of transparency prevails and valuation discrepancies between counterparties
abound, even for the simplest of trades. Many market participants have come to see that it is
nearly impossible to compare prices between dealers.

The Growing Need for a Central Collateral Management Process
The combination of these factors have led many practitioners to realise the importance of
developing a central collateral management process, including the ability to identify the CTD
collateral. However, many market practitioners face challenges due to disparate systems and
varying processes for each over-the-counter (OTC) desk. Difficulties exist when it comes down
to validating the large number of CSAs and keeping track of the huge flows of collaterals. Other
market participants also face challenges with big data input. In addition, CTD may not always
be the most optimal choice. Clearly, practitioners need to consider the massive amounts of
rules and requirements surrounding CTD, depending on the funding rates and available assets
in the firm. The bottom line: ‘Will it be cheaper to source new collateral or use an existing one?’

Copyright ©2013 gtnews. All rights reserved in all countries.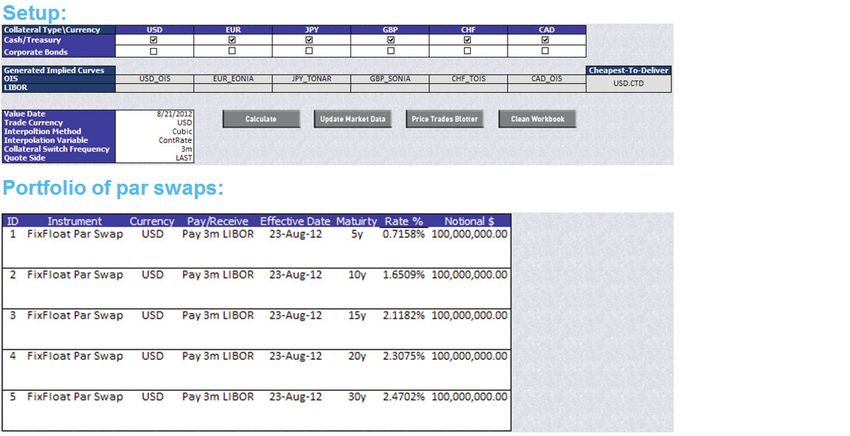
Part I: Case Study - How to Construct aCTD Curve
Most dealers agree that discounting should be based on the CTD collateral in order to enable the
best funding benefits and highest rate of return. The CTD curve is a blended collateral discount-
ing curve, optimised through the trade life cycle among the different currency collateral curves.
The CTD needs to be determined frequently over time, with the choice of the collateral currency
becoming crucial in order to optimise profit, effectiveness and liquidity.

When it comes to constructing a CTD curve, each of the following five steps adds an
additional layer of complexity. This case study will explore the construction and the
complexities involved with CTD, beginning with five basic steps:
  Step 1. Construct appropriate curves – Overnight Indexed Swap (OIS), Swap,
           Basis Curves, Cross-currency (XCCY) curves.
  Step 2. Translate curves in different currencies to the trade currency.
  Step 3. Pick cheapest throughout the life of the trade.
  Step 4. Construct blended CTD curve.
  Step 5. Discount cash flows with CTD curve.

Figure 1. The Complexity of CTD Curve Construction.

The Complexity of CTD: 6 Cash Collateral Currencies = 29 Curves to Build!
Source: Numerix

The Complexity of CTD Curve Construction and Optionality
What Practitioners Need to Consider: When it comes to CTD and optionality, market
participants need to carefully consider various factors, including the choice of currency
and collateral type, in addition to calibration; initial margin; up and down thresholds; minimum
transfer amounts; and consistency with their counterparties.

Background: Constructing a CTD Curve – Collateral and Corresponding Curves:
The basics: The following chart indicates types of collateral/currency and their
corresponding curves:

  Collateral/Currency   USD                EUR            CAD         GBP         JPY       CHF

  Cash                  USD FedFunds       EONIA OIS      CORRA OIS   SONIA OIS   MUTAN OIS TOIS
                        OIS Curve          Curve          Curve       Curve       Curve     Curve

  Corporate Bonds       USD LIBOR+         EURIBOR+       CDOR +      GBP LIBOR + MUTAN OIS CHF
                        Spread             Spread         Spread      Spread     Curve      LIBOR+ Spread

Copyright ©2013 gtnews. All rights reserved in all countries.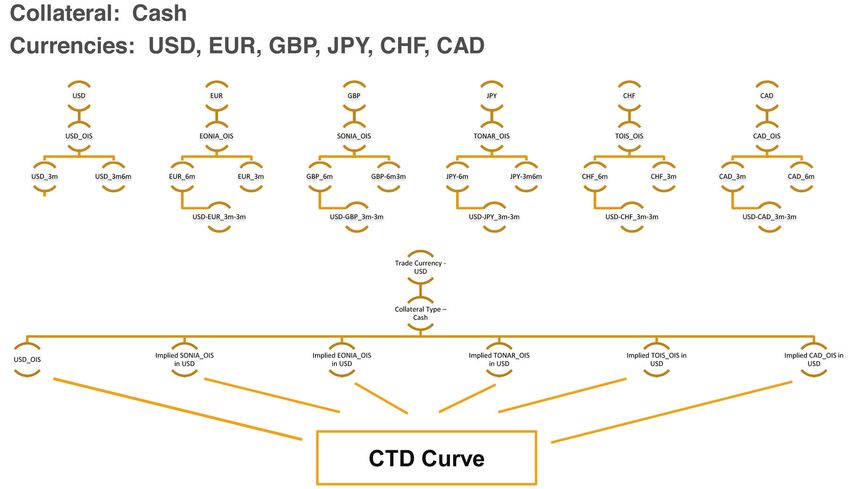
As the case study unfolds, we will go through the five basic steps outlined earlier for
curve construction.

Curve Construction Step-by-Step:
Step 1: Construct Appropriate Curves – OIS, Swap, Basis Curves, XCCY Curves:
First, we will need to construct all the appropriate curves necessary to build OIS curves
and standard London Interbank Offered rate (Libor) curves. We need to construct basis
curves used in XCCY curve construction and XCCY Basis curves to be used in translat-
ing local curves into trade currency.

Step 2: Translate Curves in Different Currencies to the Trade Currency:
Figure 2 below represent an example of curve construction for six currencies, including: US
dollar (USD),euro (EUR), pound sterling (GBP), Japanese yen (JPY), Swiss franc (CHF)
and Canadian dollar (CAD). As we can see, the graphs illustrate three month forward
rates of OIS curves, standard Libor curves and basis curves for each currency, as well as
implied XCCY curve for USD vs. appropriate currency basis spreads.

Figure 2. Curve Construction for Six Currencies.

Source: Numerix

Step 3: Pick Cheapest Currency Throughout the Life of the Trade
After we obtain all of the appropriate curves in Steps 1-2, we should compare instanta-
neous forward discount rates of collateral curves at each point of time and pick the max
one, which corresponds to the lowest discount factor. The highest (max) forward rate
represents the highest return rate on the corresponding collateral.

Step 4: Construct Blended CTD Curve
In the end, the blended CTD curve is constructed from obtained max forward rates, which
can be applied to discount future cash flows of the trades and derivatives.

Copyright ©2013 gtnews. All rights reserved in all countries.
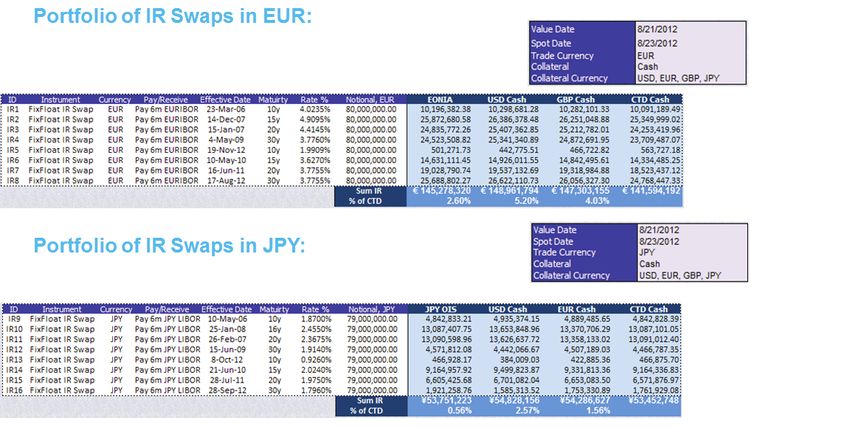
Figure 3. OIS Implied Curves, CTD, Forward Rates.

Source: Numerix

What Does Your CTD Tell You?
The CTD curve is unique for each counterparty and has become an effective analysis tool
for identifying the cheapest collateral. It allows practitioners to incorporate the assumption of
frequency of collateral switch, as well as indicating when this cheapest collateral switches to a
different one.

With the application of CTD collateral to pricing, we can see the effect of present value (PV) of
trades with various counterparties and collateral assumptions, thereby enabling the ability to
negotiate and match counterparties. Also, it allows the user to see the risk exposure against
different collateral currencies, as well as enabling FX rate sensitivity analysis.

Summarising the Complexities of CTD
Clearly, we have observed that CTD curve construction can be extremely tedious, with six
currencies requiring 20+ curves. The different curves needed to approximate cash, Treasury
bonds and corporate bonds, add to the complexity. In addition, interpolation and smoothing
must also be considered, along with proxies for currencies that may not be that liquid. More-
over, ultimately, CTD may not always be the most optimal choice.

Copyright ©2013 gtnews. All rights reserved in all countries.
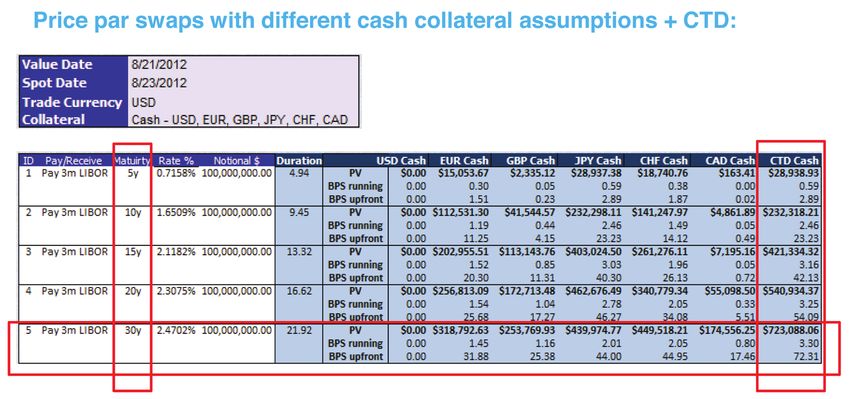
Part II: Pricing Case Studies – Interest Rate Swaps
In the examples that follow, we observe how the choice of collateral can significantly
affect the price of the trade and ultimately the bottom-line: profit.

Pricing Portfolio
Pricing Case Study 1. The first case study below prices par swaps with different
currency cash collateral.

The following case study demonstrates a representation, in very simple terms, of how dif-
ferent choices of collateral affect interest rate (IR) swap pricing. The example showcases
par swaps under USD OIS discounting of different swap maturities (from five years to 30
years). Further, we discount these swaps with different assumptions of collateral posted
(i.e. USD, EUR, JPY, CAD, CHF, GBP cash types.) Though this is not a real market case
scenario, it provides important insights regarding how much pricing of the trade can vary
under different collateral discounting as well as showing explicit numbers without the
necessity of scaling by notional, fixed rate, maturity and moneyness of the swap.

Figure 4. Pricing Case Study 1: IR Par Swaps USD Set-up.

Source: Numerix

Figure 5. Pricing Case Study 1: IR Par Swaps USD: Different Cash Collateral Assumptions + CTD.

  Source: Numerix

Copyright ©2013 gtnews. All rights reserved in all countries.
Key Highlights and Observations
There are several key observations worth noting in this case study. The main observation is
that the difference becomes systematically larger for longer-term swaps. We also observe that
a comparison of the actual results of the cheapest collateral in Figure 3 reveals that USD
collateral is one of the most expensive.

Therefore, the numbers appearing in the above table in the ‘CTD Cash’ column are
significantly different from the USD cash discounting. Taking these numbers into consideration,
we can also observe that the range for running basis points (bps) is between 0-3bps, and that
for upfront bps, it goes up to 72 bps (highest forward rates, lowest discount factors).

Pricing Case Study 2. Pricing IR Swaps in EUR VS. JPY
Let us next examine the two cases highlighted in Figure 6 below. In the first case, we have
trades in EUR currency against counterparty A, with the CSA agreement allowing us to post
collateral in USD, EUR, GBP and cash. The set of trades represents a sample set of IR swaps
with various maturities and fixed rates.

The second case below assumes a set of vanilla IR swaps in JPY currency against
counterparty B, with the CSA agreement allowing cash collateral in the following set of
currencies: USD, EUR, and JPY.

We follow the five steps described earlier in our study to construct the CTD curve and apply
different assumptions of collateral choices, including the CTD curve to discount these swaps.
(Note that CTD discounting is equivalent to the assumption that the counterparty would post
collateral in the most efficient way.)

Figure 6. Portfolio of IR Swaps in EUR and JPY.

Source: Numerix

Copyright ©2013 gtnews. All rights reserved in all countries.
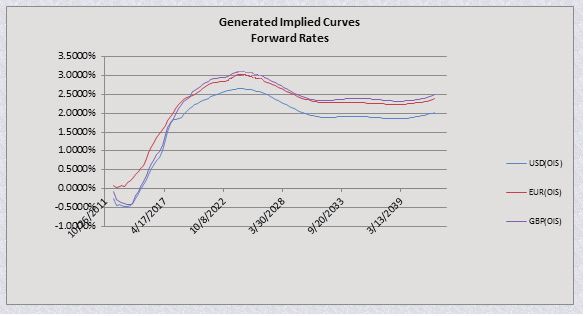
Figure 7. Corresponding Implied Curves for USD, EUR and GBP Collaterals Case 1, Forward Rates.

Source: Numerix

Figure 8. Corresponding Implied Curves for USD, EUR, JPY Cash Collaterals for Case 2,
Forward Rates.

Source: Numerix

Copyright ©2013 gtnews. All rights reserved in all countries.
Conclusion
In conclusion, as of the 21 August 2012 date where we compare the PVs of swaps and corre-
sponding curves of various collaterals, we observe that the cheapest collateral to post would
be EUR cash for the next seven years for Case 1; and then we would switch to the GBP cur-
rency afterwards. This picture might change with some market shocks in the future. However,
we can observe that the results obtained in the curve graphs are reflected in the output PVs of
swaps under the different collateral choices.

Also, from the table, we can see that discounting under the CTD curve would lead us to the
lowest PV. If we then chose to post collateral in USD dollars for these trades, our portfolio
PV would be mispriced by more than 5% compared to the CTD curve price. In addition, we
confirm the same observations with JPY currency trades against counterparty B, where the
cheapest collateral to post throughout the life of the trades is Japanese Yen; and, this is what
we reconfirm by looking at the numbers in the table for Case 2. Please note: this is the snap-
shot of market data as of 21 August 2012 for a particular sample CSA agreement. These
results may vary significantly throughout the life of the trade, as well as with different CSA
agreement assumptions.

Summary
With trade prices varying depending on collateral choices, a central collateral management
system is increasingly important in today’s world, including a CTD tool to analyse the optimal col-
lateral choices. Cheapest is not always optimal, and practitioners should consider the rules and
requirements on top to fully understand what would actually be the most optimal collateral choice.

Can A ‘Perfect World’ of Collateralisation Exist?
Progress is definitely achievable, but perhaps not perfection. The new standard International
Swaps and Derivatives Association (ISDA) standard credit support annex (SCSA) agreements
should reduce valuation disputes by eliminating the embedded optionality within the existing
contracts. However, while the new standard CSA should eliminate optionality, implementation
is only just starting. Market practitioners still need to handle existing CSAs that will be on the
books for many years to come and will still need to have all the curves for netting.

Clearly, the standard CSA cannot eliminate cross-currency risk and other complexities. For
example, there remain concerns about dollar dominance and two systems existing in paral-
lel - for old and new cross-currency settlement risk (PVP vs. netting) - in addition to slow initial
development. On the positive side, many market practitioners believe that, in time, standard
CSAs will help to resolve discrepancies in counterparty valuations and with CTD modelling
and optionality, and boost liquidity in the OIS market overall.

*This article follows an earlier related piece: Collateral Discounting: Rethinking the Interest
Rate Pricing Framework from its Basic Concepts

                      Anna Barbashova - Client Solutions, Numerix
                      Anna Barbashova is a part of Numerix client solutions team, focused
                      on developing market initiatives and the implementation of market
                      standards within Numerix core analytics platform - Numerix CrossAsset.
                      Barbashova holds an MA in Financial Mathematics from Columbia.

Copyright ©2013 gtnews. All rights reserved in all countries.
You can also read