Fly Creek Drainage Water Quality Improvement Project
←
→
Page content transcription
If your browser does not render page correctly, please read the page content below
Fly Creek Drainage Water Quality Improvement Project
Montana Focused Conservation Planning Strategy
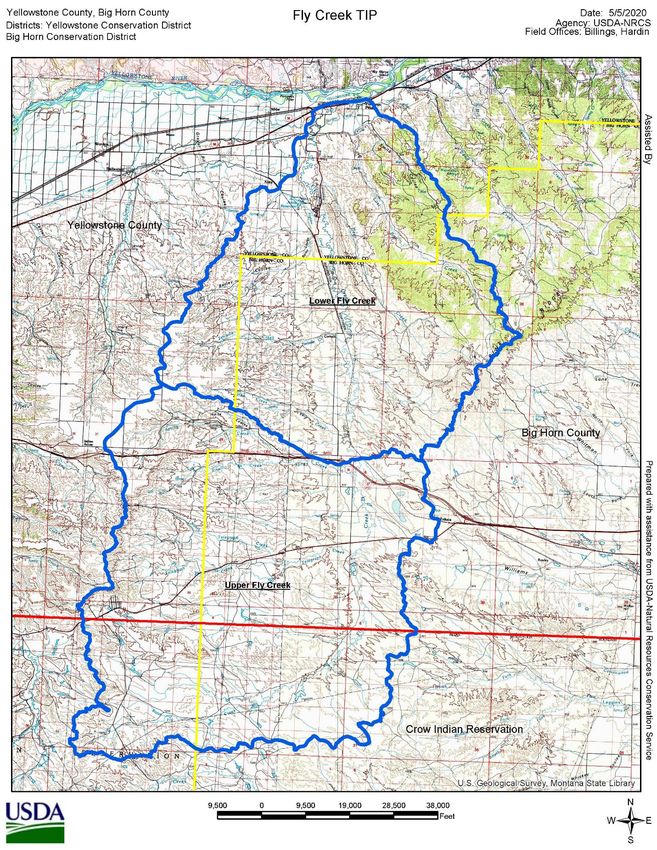
Fly Creek Drainage in Yellowstone and Big Horn Counties
Seanna Torske, Supervisory District Conservationist
Billings, Hardin, and Crow Agency Work Unit
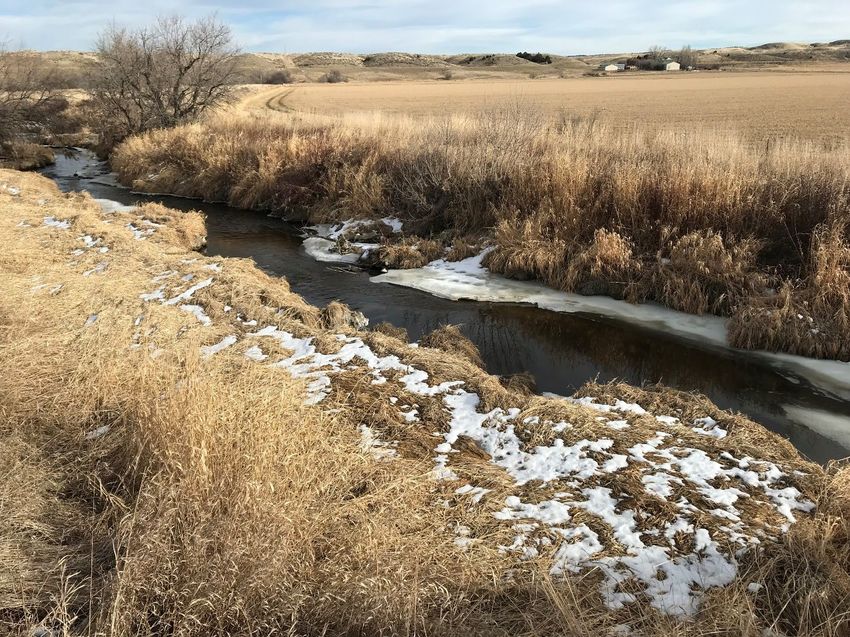
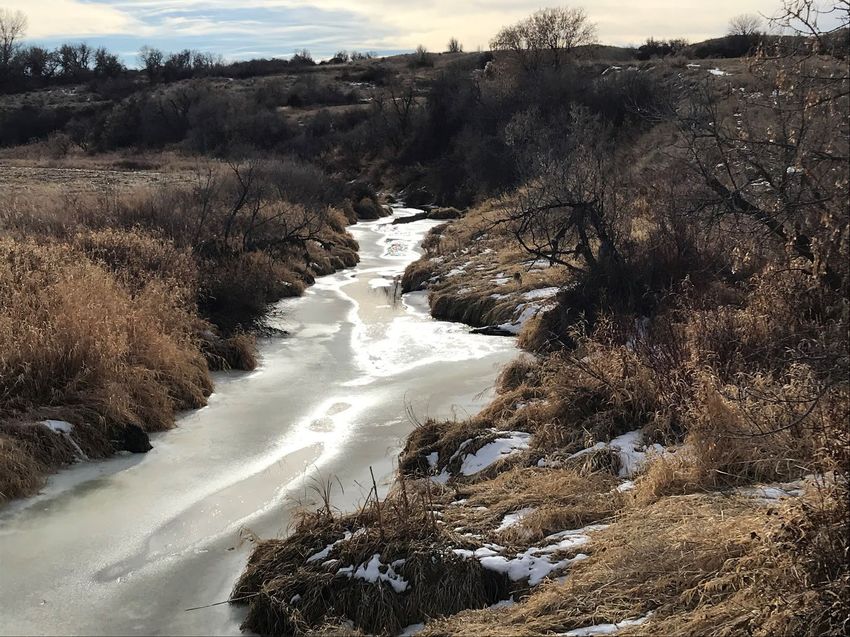
Figure 1- Fly Creek, located on the northern end of the TIP project area.
1|Page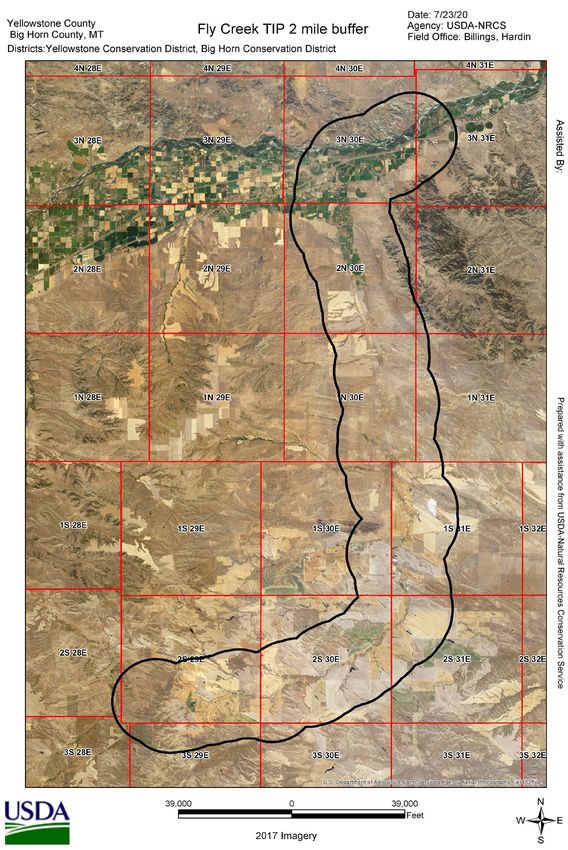
Figure 2 – Map of the TIP Proposal Area overlayed in comparison to the Fly Creek Watershed area.

Summary:

Surface and ground water in the area around Fly Creek in Big Horn and Yellowstone Counties are
documented to have levels of sulfates greatly exceeding the recommended levels for livestock. This
Targeted Implementation Plan (TIP) will address the urgent need to provide safe drinking water for
livestock. The TIP will also begin the significant process of addressing water quality in the Fly Creek
watershed through riparian fencing, outreach, and water quality (ground and surface) monitoring.

2|Page
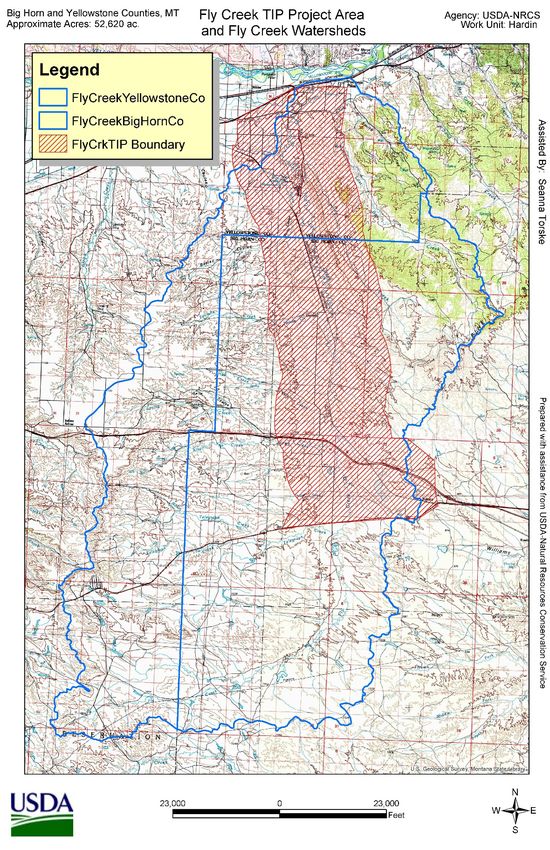
The primary resource concern addressed by this project resource is Livestock Production Limitation:
Inadequate Livestock Water Quantity, Quality and Distribution. Additional resource concerns that will
be addressed include: Salts Transported to Surface Water; and Plant Productivity and Health. The
anticipated total project cost to be $900,000 over five funding cycles.

Geographic Focus:

The Upper Fly Creek watershed consists of 187,990 total acres, with acreage split between 73,704 acres
in Yellowstone County and 114,286 acres in Big Horn County. 39,101 of these acres are on the Crow
Indian Reservation (15,430 ac in Yellowstone County and 23,671 ac in Big Horn County). Fly Creek
originates at 3,700 ft elevation in the southwest quarter of section 32-2S-29E in southeastern
Yellowstone County. Fly Creek then travels in a northeasterly and northern path into Big Horn County
and then back to Yellowstone County before emptying into the Yellowstone River in the southeast
quarter of section 23-3N-30E, adjacent to the town of Pompeys Pillar. From its source in Big Horn
County to its confluence with the Yellowstone River, Fly Creek’s overall length is about 55 miles. There is
a mixture of farming and livestock operations along the creek, but the eligible landuses are range and
pastureland.

The downstream portions of Fly Creek have flowing water year-round with outflow of irrigation waters.
The upstream portions of Fly Creek drainage experience seasonal flows, with the upper limit of the
drainage only flowing a few weeks, at most, per year. Flows at the upper limit are attributed to snow
melt and runoff from crop and rangeland fields, both of which can be a source for the elevated nutrient
levels. Parent material in the upstream portion of Fly Creek drainage also contributes to elevated levels
of sulphates in ground and surface waters. Presence of salinity issues are obvious along the reach of the
stream when viewing ortho imagery, which can contribute to water quality issues along the stream as
well.

The TIP Project area is shown in Figure 2 on page 3. The project focus area consists of land within two
miles on each side of Fly Creek, north of Old US Highway 87 to the edge of the Yellowstone River valley.
This delineated area is about 52,620 acres. The two-mile distance from the creek was chosen because
these areas are those most impacted by poor water quality in Fly Creek. The project area didn’t go south
of Old US Highway 87 due to the lack of operators in this area that would participate in USDA programs.
The downstream-most seven or eight miles adjacent to Fly Creek in Yellowstone County consist of
irrigated land.

3|Page
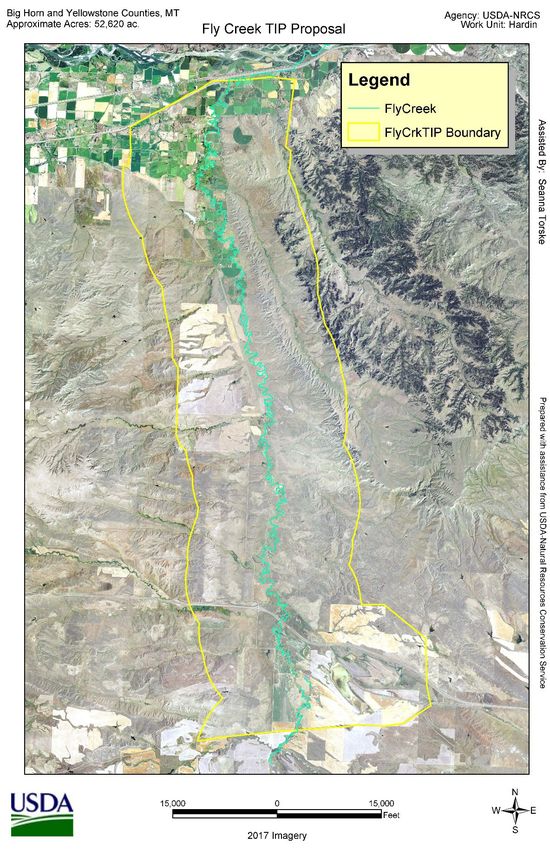
Figure 2.1 - Fly Creek TIP Project Area, Fly Creek Proper is listed in light blue. The southern edge of this project starts along Old
US Highway 87 and continues north to the Yellowstone River Valley.

4|Page
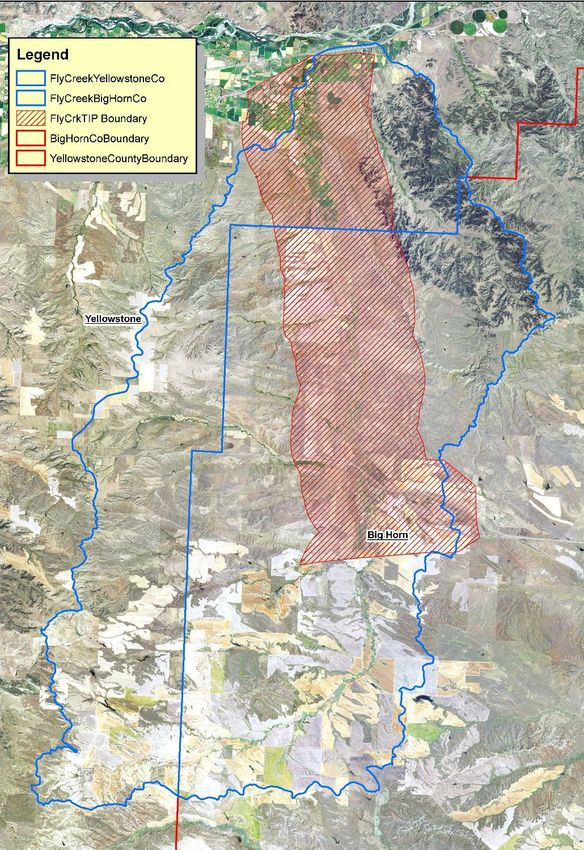
Figure 2.2 - This map shows the Fly Creek watersheds (Upper and Lower in blue) in relation to Big Horn and Yellowstone Counties
(in yellow) as a whole, with the Crow Indian Reservation (in red).

Resource Concern:

Surface and groundwater in the Fly Creek drainage contain levels of sulfates and other pollutants that
exceed healthy livestock water guidelines. These high levels of pollutants have affected livestock
production. Multiple landowners have lost stock from 2017 to 2021 due to consumption of water from
Fly Creek.

The primary resource concern addressed by this project resource is Livestock Production Limitation:
Inadequate Livestock Water Quantity, Quality and Distribution.

Local Support:

Local workgroup feedback for FY2021 overwhelmingly supported conservation efforts in the Fly Creek
drainage based on online survey feedback (survey was created by the Yellowstone Conservation
District), as an in-person meeting was not possible due to COVID-19 restrictions. The FY2022 Local Work
Group meeting that was held in April 2021 also recommended water quality along Fly Creek as their
priority resource concern. This TIP proposal directly ties into the Yellowstone and Big Horn County Long

5|Page
Range Plans. The Yellowstone County LRP highlighted water quality and quantity as a significant
resource concern on rangeland, stating: “Water quantity and quality are two of the most limiting factors
for grazinglands utilization, as both are needed to safely manage livestock.” The Fly Creek drainage is
listed as a priority focus area in the Yellowstone County NRCS long range plan page 7: Watersheds and
streams.

Fly Creek is mentioned as a resource concern area on the 303(d) listed streams and TMDL Streams in
Section II the Yellowstone County Long Range Plan. In Section IV the resource concerns mentioned are
present in the Fly Creek drainage, contributing to the water quality issues along with the natural geology
of the area. Specifically, concerns are related to dry cropland, rangeland, and pastureland. A Fly Creek
water quality TIP has been mentioned as a need since 2017 and is mentioned in Section VI of the
approved Long Range Plan.

This TIP also aligns with the Big Horn County Long Range Plan as follows:

    •   Page 14, Section III. Current State of Natural Resources in the County - The Big Horn
        Conservation District (BHCD), located in Hardin, Montana is a critical partner with local water
        quality and quantity issues. Through the more than 50 years of its existence, the Big Horn
        Conservation District has partnered with many businesses, units of state and federal
        government, and individuals to ensure the water quality and water quantity within Big Horn
        County, Montana.
    •   Page 17, Resource Inventory – Soil Quality - Dry Cropland: Salinity concerns on dryland crop has
        occurred over the years, with some of these saline seeps continuously growing over the years.
        Crop/fallow rotations, lack of crop diversity, and existing soil conditions have all contributed to
        salinity problems on cropland. Some of these issues have been resolved or mitigated by seeding
        fields or portions of fields back to a perennial crop or grass. Addition of soil amendments to
        dryland crop has been limited due to cost.
    •   Page 17, Resource Inventory – Water Quality and Quantity - Range and Pasture: Water quantity
        and quality are two of the most limiting factors for grazinglands utilization, as both are needed
        to safely manage livestock.
    •   Page 20, Section V. Prioritization of Natural Resource Problems and Desired Outcomes – In the
        FY2020 BHC LWG minutes held February 7th, 2019 mentioned Water Quality as a concern, but
        wasn’t listed as a priority resource concern, although it was definitely a concern that was noted.
        The LWG also noted, “The Local Work Group agreed to continue as before designating continued
        support for rangeland and cropland soil health and water quality education within Big Horn
        County as a priority, including invasive species awareness and control, with a special focus on
        small acreage landowners.”
    •   Page 21, Section V. Prioritization of Natural Resource Problems and Desired Outcomes –At the
        FY2020 Crow Tribal LWG meeting held March 5th, 2019, water quality on rangeland was listed as
        the number one Priority Resource Concern.

Historical Overview:

Traditionally, there has been very little data collection along Fly Creek. There are four monitoring sites
along the 55.68 creek miles. All data that is reported is from the 2004 DEQ field assessment report.
With recent accounts of cattle deaths from ingestion, it can be assumed that conditions have not
improved and may have likely degraded with an increase of precipitation and subsequent runoff in

6|Page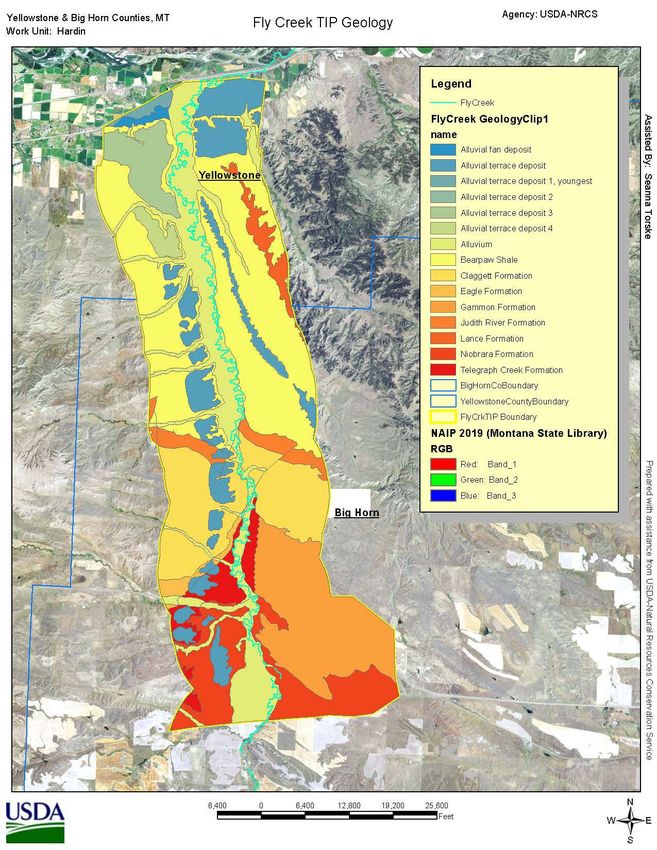
recent years. The area is a 10-12 inch precipitation zone in normal years. Precipitation in 2013 was
113% of normal, 2018 was 131% of normal (data from the effective precipitation utilized in rangeland
resource inventories by local NRCS Field Office staff). Reports of cattle deaths from ingestion of water
occurred during these years. Of note, producers reported that a 2019 storm dropped around 4 inches in
roughly an hour, and radar could be seen focused directly over the Fly Creek drainage. This storm
caused at least two reservoirs to fail, releasing that water downstream in an erosive flooding event.

According to the 2020 Fly Creek Geology/Hydrogeology Report (Scannella, 2020), typically during years
of high precipitation mineral concentrations should be lower and diluted, but that an exception to this
could be noted from 2011-2019, when precipitation was higher and mineral concentrations were higher,
citing the cause likely coming from major events such as flooding (such as the huge 2019 rainstorm).

Figure 3- Photo of Fly Creek on the northern portion of the TIP Area

Over the past 75 years, rangeland within the Fly Creek watershed has been converted to dryland crop
production. Originally, these crop systems were based on conventional tillage. Due to wind erosion
issues, much of the land was transitioned over the years to minimum tillage or no-tillage farming
practices. During much of this time, historical cropping rotations have been winter wheat and fallow,
although some farmers have also experimented with other specialty crops such as canola, sunflower,
and corn. Land in this watershed is susceptible to salinity issues (see Figures 3.1 & 3.2 below), which can

7|Page
be exacerbated when land is converted from range and pastureland to crop production, especially crop-
fallow production.

In recent years landowner concerns have escalated as water quality has diminished within the Fly Creek
drainage. With concerns about water quality occurring at the uppermost regions of the drainage,
downstream effects are likely to be exacerbated if mitigation is not enacted.

Figure 3.1 - Evidence of salinity issues along Fly Creek in Big Horn County. (2017 NAIP Imagery)

Figure 3.2 - Fly Creek near its headwaters in Yellowstone County, saline seeps evident (2017 NAIP Imagery).

8|Page

Data Collection:

  In the fall of 2020, Kari Scannella, MT NRCS State Geologist, worked with the Billings NRCS Field Office
  staff and Montana Bureau of Mines and Geology (MBMG) to sample existing wells in the Fly Creek
  Watershed in order to determine the extent of water quality issues in existing groundwater sources.
  Wells were sampled between September 30th to November 4th, 2020. The NRCS Geologist also
  evaluated existing water quality tests within the watershed. Using this data and other geologic
  research, Ms. Scannella, created the Fly Creek Geology-Hydrogeology Report, 2020. Excerpts from this
  report can be found in Appendix B.

  Figure 4 below contains an excerpt from Environment Technical Note No. MT-1 (Rev. 2, June 2011) on
  water quality. It states that sulfate levels “up to 1,000 mg/L is acceptable for livestock.” Groundwater
  samples provided by local ranchers to NRCS showed levels of sulfates ranging from 4,300 mg/L to 9,810
  mg/L, which are four to nearly ten times the acceptable level. Additionally, NRCS testing of groundwater
  in the fall of 2020 found levels up to 3,340 mg/L.

Constituent or Physical Property             Source or Cause                            Significance
Sulfate (SO4)                       Leached from most sedimentary         Sulfate is the stable, highly oxidized form
                                    rocks including shale and gypsum      of sulfur produced by bacterial oxidation
                                    particularly in arid regions. Upon    of reduced sulfur compounds. The
                                    oxidation, organic material may       sulfate ion (SO4 2-) is readily soluble in
                                    contribute sulfates to water. Acid    water. Objectionable effects of sulfate in
                                    mine drainage is a common potential   drinking water are related to taste and
                                    source. Discharges from some          cathartic effects. Domestic waters in
                                    industries may contain sulfate. Wet   Montana containing as much as 1,000
                                    and dry atmospheric deposition may    mg/L are used for drinking in the
                                    be appreciable due to burning of      absence of a less mineralized water
                                    fossil fuels.                         supply. Can limit irrigation use on some
                                                                          soils. Sulfate concentrations are seldom
                                                                          high enough to affect aquatic life
                                                                          adversely. 250 mg/L is generally the
                                                                          maximum recommended level for
                                                                          human consumption while up to 1,000
                                                                          mg/L is acceptable for livestock.
                                                                          Common metal sulfate compounds are
                                                                          gypsum and alabaster (CaSO4·2H2O) and
                                                                          Epsom salt (MgSO4·7H2O).
  Figure 4 - Excerpt from Environment Technical Note No. MT-1 (Rev. 2, June 2011)

  The Fly Creek drainage was listed as polluted by the Environmental Protection Agency (EPA) in 2012, due
  to high levels of sulfates and nitrates that are attributed to geology and potential runoff from fallow
  fields that border the drainage. The 2004 assessment of the watershed also indicated high levels of
  sulfates; lower reaches of the creek indicated levels that could affect cattle not accustomed to its use;
  and the upper reaches of the creek indicated levels unsuitable for any stock watering (Montana DEQ
  2020 Water Quality Standards Attainment Record).

  Macroinvertebrate surveys (conducted by Montana Fish, Wildlife, and Parks, 1999) in the uppermost
  portions of the stream show taxa richness was low with species associated with hypoxic substrates. The
  uppermost survey site consisted of mostly maggots and pupae, indicating degradation due to livestock

  9|Page
access, and trampling within the drainage. Field visits would confirm that livestock have had direct
access to Fly Creek throughout the reach.
Goals and Objectives
The primary goal of this proposal is to address the primary resource concern in the Fly Creek Drainage as
supported by the Local Working Group in 2020 and 2021: Livestock Production Limitation: Inadequate
Livestock Water Quantity, Quality and Distribution. This will be accomplished by addressing the unique
conditions on each ranch, including poor well water quality, lack of off stream water access, etc.,
utilizing the suite of practices below.
• Water Treatment Facility (724) • Watering Facility (614)
• Waste Storage Facility (313) • Livestock Pipeline (516)
• Pond Sealing or Lining (521) • Groundwater Testing (355)
• Fence (382) • Water Well (642)
• Well Decommissioning (351) • Pumping Plant (533)
Example Project Scenarios: These scenarios are based on the FY2022 Montana EQIP Cost List.
Example 1: This project would involve fencing out livestock from Fly Creek and providing off-site water
by drilling a new well and installing a RO system on this well. Groundwater testing will be required for
any new or existing wells. Numbers are calculated for about a 250 head herd of commercial cow/calf
pairs.
Table 1. Conservation practices scenario.
Practice Payment
Code Practice Component Extent Units Rate Total
642 Water Well Typical Well, 100- to 600-foot depth with 4-inch Casing 400 ft $ 48.16 $ 19,264.00
533 Pumping Plant Photovoltaic-Powered Pump, greater than 400 ft total head 1 ea $ 6,458.37 $ 6,458.37
533 Pumping Plant Well Pump Test 12 hr $ 198.98 $ 2,387.76
355 Ground Water Testing Basic Water Quality Test 1 ea $ 214.47 $ 214.47
516 Livestock Pipeline Buried PVC, IPS, HDPE, PE 2500 ft $ 1.98 $ 4,950.00
614 Watering Facility Permanent Drinking with Storage, 1,000 to 5,000 Gallons 2400 gal $ 2.37 $ 5,688.00
614 Water Facility Permanent Drinking with Storage, 1,000 to 5,000 Gallons 2400 gal $ 2.37 $ 5,688.00
Water Treatment
724 Facility Reverse Osmosis 370 gal/hr $ 19.31 $ 7,144.70
Earthen Storage Facility, greater than or equal to 50,000 cubic
313 Waste Storage Facility foot storage 105,000 cu ft $ 0.35 $ 36,750.00
Flexible membrane, uncovered without liner drainage or
521 Pond Sealing or Lining venting 8,167 sq yd $ 11.27 $ 92,042.09
382 Fence Barbed/Smooth Wire 3800 ft $ 2.20 $ 8,360.00
Total $ 188,947.39
Example 2: The second example would involve installing a RO system on an existing well, and mainly
addressing the livestock water resource concern. Calculations would again be based on a 250 head
commercial cow/calf herd.
Table 2. Conservation practices scenario
10 | P a g ePractice Payment
Code Practice Component Extent Units Rate Total
533 Pumping Plant Electric-powered pump, less than or equal to 5 Horse Power 1 HP $ 1,808.22 $ 1,808.22
533 Pumping Plant Well Pump Test 12 hr $ 198.98 $ 2,387.76
355 Ground Water Testing Basic Water Quality Test 1 ea $ 214.47 $ 214.47
516 Livestock Pipeline Buried PVC, IPS, HDPE, PE 1000 ft $ 1.98 $ 1,980.00
614 Watering Facility Permanent Drinking with Storage, 1,000 to 5,000 Gallons 2400 gal $ 2.37 $ 5,688.00
614 Water Facility Permanent Drinking with Storage, 1,000 to 5,000 Gallons 2400 gal $ 2.37 $ 5,688.00
614 Water Facility Storage Tank 10,000 gal $ 1.00 $ 10,000.00
Water Treatment
724 Facility Reverse Osmosis 370 gal/hr $ 19.31 $ 7,144.70
Earthen Storage Facility, greater than or equal to 50,000 cubic
313 Waste Storage Facility foot storage 105,000 cu ft $ 0.35 $ 36,750.00
Flexible membrane, uncovered without liner drainage or
521 Pond Sealing or Lining venting 8,167 sq yd $ 11.27 $ 92,042.09
382 Fence Barbed/Smooth Wire 3800 ft $ 2.20 $ 8,360.00
Total $ 172,063.24
Project Alternatives:
Alternative 1 (Selected): Enrollment of livestock producers to provide off stream stock water
development, which would help alleviate the immediate issue of livestock health with the existing water
quality. Proposed practices include:
• (642) Water Well – For projects that either do not have existing off stream water or that have
wells that do not produce enough water for the livestock herd. Water quality tests for new
wells are required. Water Treatment Facilities are needed when water quality is poor.
• (533) Pumping Plant – This would include the Step-Drawdown Pumping Test practice
component as well as any submersible or electric pumps as needed.
• (516) Livestock Pipeline – In order to provide water sources for livestock farther away from Fly
Creek. It’s also possible there may be existing wells more than a ½ mile from the Creek that
would be sufficient to provide safe water for livestock closer to Fly Creek.
o If being used in conjunction with a RO system, the length of the pipeline is
recommended to be capped at 5280 feet. Since the Livestock Treatment Facility is an
interim practice for Montana, and considerable water production needs to be used for
operation of the RO system, we want to keep the stockwater systems to a smaller size
until we have a better idea how successful the RO systems will be along Fly Creek.
• (614) Watering Facility
• (355) Groundwater Quality Testing – We’ll need to have a baseline of the current water quality
on any new or existing wells. The Water Treatment Facility practice will include water quality
testing for future testing once the practice is installed.
• Montana NRCS also has the following interim practice available that are expected to be included
in this proposal which include:
o (724) Water Treatment Facility – This practice involves the installation of a Reverse
Osmosis (RO) system. A pumping test will need to be performed on these wells in order
to ensure there is adequate production on these wells. Groundwater Quality Testing
will be required with the design of an RO system.
Approximately 1/3 of the water that comes from the source will be discarded as
wastewater. Therefore, NRCS will need to determine water needs for the
11 | P a g eproducer’s herd, then calculate what their well will need to produce by dividing
that number by 0.66.
• Some RO systems may be set up to blend the treated water with
existing water sources (while ensuring the water is still safe for livestock
consumption).
Power sources will also need to be considered, as this can also affect design
flow rates needed, as well as additional costs to get power to a RO system.
Producers will need to be willing to perform the operation and maintenance.
O&M will include buying and adding chemicals on a regular basis (depending on
water-use demands, this may occur every couple months). They will also need
to switch out filters (the producer buys two; sending the old one to the
manufacturer for cleaning).
o(313) Waste Storage Facility – This practice will be needed for the wastewater from the
RO system. NRCS will ensure ponds are not located in the floodplain.
o (521) Pond Lining, Flexible Membrane
• (382) Fence – In addition to providing alternative sources of livestock water, physically excluding
livestock from the creek would provide two benefits: 1.) It would keep livestock from
accidentally ingesting poor quality water from the creek, and 2.) It would prevent livestock fecal
matter from directly entering the waterway. This practice will be used at planner discretion and
will ensure this practice will be used to address the water quality resource concern. Flood
damage concerns when fencing out the creek will also need to be considered when planning this
practice.
Alternative 2: All practices in Alternative 1 with the addition of further addressing the sources of the
surface water quality issues. Eligible practices would include:
• All practices listed in Alternative 1.
• Following vegetative practices would be used to provide a vegetative buffer, either between the
creek and cropland or animal feeding operations:
o (386) Field Border
o (512) Pasture & Hayland Planting
o (342) Critical Area Planting
Alternative 3: No Action. If there is no action taken within the Fly Creek drainage conditions will likely
persist with the possibility of increasing nutrient levels, especially at the upper portions of the drainage.
Alternative 1 was selected. Although alternative 2 holistically addresses the full causes of water quality
problems (both surface and groundwater), alternative 1 will directly address the Livestock Water
Quantity/Quality concerns in the most effective manner. The Fly Creek Geology-Hydrogeology Report
supports applying landuse-based conservation practices in addition to treating livestock drinking water
or drilling new wells. (See Appendix B, Section 8.0 Conclusions). Although alternative 2 was not
selected, there are currently other fund pools through EQIP and RCPP-EQIP that could be utilized via the
practices listed above.
Implementation:
12 | P a g eThe project will be implemented over five funding cycles. See Table 2 for a breakdown of the funding
request for NRCS Financial Assistance.
Each ranch would need to be evaluated on an individual basis for water well and RO system feasibility.
While originally shallow wells would not be preferred from a water quality standpoint; reverse osmosis
systems could allow shallow wells to be utilized if water production is adequate. In Kari Scannella’s
report (refer to Appendix B), she noted that 60% of the wells are in alluvium and shallow, confirming
that RO could potentially be a good fit for these wells. After visiting with some landowners who have
already installed RO systems on their livestock operations, some RO systems have been used in
conjunction with other water sources, with treated water combined with non-treated water. Herd size,
power availability, terrain, herd goals and health of the Fly Creek drainage would all be considered
before a stockwater system is contracted.
Timeline and Financial Assistance Requested:
Table 2. Project budget.
Feet of Stream Number of
Project Estimated NRCS
Year Acres (fenced or serviced Funded
Cost Financial Assistance
by new stock water) Contracts
1 1500 600 $100,000 2
2 1500 1000 $100,000 2
3 3000 2000 $200,000 2
4 5000 2000 $300,000 3
5 3000 1000 $200,000 2
Total 14,000 6600 $900,000 9
Workload Demands:
Initially, workloads will be focused on data collection, education, and outreach. While most stockwater
designs can be completed by local Field Office staff, designs for the reverse osmosis, waste storage
pond, and pond lining practices will likely need to be completed by Bozeman Area engineering staff due
to practice complexity and unfamiliarity. Field office employees will assist with these practice designs
and gain experience.
Planned Education and Outreach:
A targeted letter was mailed out to landowners and agricultural operators within the Fly Creek drainage,
informing them of our proposed conservation initiative (done in August 2021). A public meeting was
held March 1st, 2022, in Huntley, MT, and landowners and operators in this area were also invited to the
workshop (we had about 21 attendees at this meeting). NRCS provided an overview of the TIP proposal
for Fly Creek, and we also reviewed some of the requirements for the Water Treatment Facility practice.
Both the mailing and workshop were successful in generating interest in this TIP proposal. If selected,
additional outreach workshops will be held in order to further educate the public about the water
treatment facility practice, water production needs, annual maintenance costs, etc., in order to assist
people in deciding whether or not a reverse osmosis system may be a good fit for their livestock
operation.
13 | P a g eSupplemental demonstrations may be scheduled either as a group or individually to better convey our
natural resource concerns for the area. As projects are implemented, Field Office staff will work with
Public Affairs to develop fact sheets and other outreach products.
Possible obstacles to implementation include hesitancy to adopt an unfamiliar practice in Reverse
Osmosis. Additionally, the water treatment process produces a large amount of wastewater that will
need to be addressed properly, including installation of waste storage facilities, which may cause
hesitance in some producers. Finally, some producers may simply not have a sufficient water supply for
their herd after wastewater is removed.
Project Ranking
1. Does the proposed project involve fencing out livestock from Fly Creek?
2. Does the proposed project involve Livestock Water Treatment Facility?
3. Does the proposed project involve Well Decommissioning?
Yes, well decommissioning is needed and will be contracted.
No, there are no wells that need to be decommissioned.
There are existing wells that can be decommissioned, but the particiant does not wish to
decommission them.
4. Does the proposed project involve Watering Facility?
Partnerships:
• Big Horn Conservation District (BHCD) – The BHCD supports the local NRCS Field Offices in
organizing outreach meetings regarding the EQIP TIP signup, as well as educational workshops
regarding best management practices. BHCD also can apply for the Montana Department of
Natural Resources and Conservation (MT DNRC) House Bill (HB) 223 grant program to assist
landowners and USDA-NRCS in providing outreach and education to local landowners.
o Estimated hours for holding (1) outreach workshop for the first year of the TIP: 12
hours.
o Estimated hours for sending out outreach mailings for each year of program funding of
the TIP: 4 hours x 5 years of the TIP= 20 hours.
o The local CD’s can also explore funding for conducting surface water quality testing
along Fly Creek. MT DEQ also has testing protocols available, with the test results
available to be shared through DEQ and EPA. Long-term monitoring of this creek would
be beneficial to monitor changes in nitrate and sulfate levels of the creek and could
serve as a method to for determining any potential future water quality issues along the
creek.
• Yellowstone Conservation District (YCD) – The YCD supports the local NRCS Field Offices in
organizing outreach meetings regarding the EQIP TIP signup, as well as educational workshops
regarding best management practices. YCD also can apply for the Montana Department of
Natural Resources and Conservation (MT DNRC) House Bill (HB) 223 grant program to assist
landowners and USDA-NRCS in providing outreach and education to local landowners.
14 | P a g eo Estimated hours for holding (1) outreach workshop for the first year of the TIP: 12
hours.
o Estimated hours for sending out outreach mailings for each year of program funding of
the TIP: 4 hours x 5 years of the TIP= 20 hours.
o The local CD’s can also explore funding for conducting surface water quality testing
along Fly Creek. MT DEQ also has testing protocols available, with the test results
available to be shared through DEQ and EPA. Long-term monitoring of this creek would
be beneficial to monitor changes in nitrate and sulfate levels of the creek and could
serve as a method to for determining any potential future water quality issues along the
creek.
o Contributing partner for the funding of Pheasants Forever partner biologist position
below.
• Pheasants Forever (PF) – PF will hire a partner biologist employee located in the Billings USDA-
NRCS Field Office who can assist local USDA-NRCS Field Office staff in the planning and
implementation of these projects. Pheasants Forever staff have access to aerial drones which
may be utilized for monitoring with landscape imagery before and after treatment.
• Montana State University (MSU) Extension Big Horn and Yellowstone Counties – MSU Extension
may serve as a resource for providing specialists who can present on subject matter pertinent to
the TIP proposal.
o Estimated time from extension specialist to provide water quality information at
outreach workshops: 4 hours x 2 workshops = 8 hours.
• Montana Department of Environmental Quality (DEQ) – The MT DEQ may assist landowners
along Fly Creek by implementing a water quality sampling plan for landowners to utilize. At this
point NRCS role is to present resources to private landowners and let them choose the path
forward they are interested in pursuing.
• Montana Bureau of Mines and Geology (MBMG), Montana Salinity Control Association (MSCA)
and Yellowstone River Conservation District Council (YRCDC) have been consulted for technical
advice on water quality management.
• Montana Salinity Control Association currently has a Regional Conservation Partnership Program
(RCPP) for addressing saline seeps; Yellowstone and Big Horn Counties are all considered eligible
areas for this RCPP project, which can also help address water quality issues along the Fly Creek
reach. Funding opportunities for this RCPP will promoted at all outreach workshops and will
also be included in any outreach mailings provided by the local NRCS field offices. MSCA has
made themselves available to participant in outreach workshops and to has provided education
on salinity issues, and how saline seeps can affect surface water quality.
Outcomes:
Progress will be evaluated through landowners contacted, monitoring efforts, total acres impacted,
decreased livestock death losses (either from unknown causes or confirmed water quality issues), and
15 | P a g econtinued education on upland vegetation management and how it affects Fly Creek. The Billings, Hardin, and Crow field offices will work with landowners throughout the entire process and conducting annual contract status reviews to ensure specifications and standards are being followed. Water quality monitoring is a key component of the evaluation of progress. In this first phase, water quality for livestock is expected to see an improvement by excluding livestock from surface water as well as safe alternative water sources developed from reverse osmosis systems. Water monitoring may inform the future of the watershed and its needs, as well as be applicable to other similar watersheds across the state. The Hardin and Billings Field Offices are currently working with their local conservation districts on potentially looking into 223 grant funding for surface and groundwater quality monitoring projects. Once funding is secured for a water quality monitoring project along with a monitoring schedule and protocol is in place, we would have a goal of at least 9 landowners participating in this project. Having a consistent and long-term water quality monitoring schedule for this project area will show trends that a occurring within the watershed that yearly or bi-annual may not be able to capture. The Field Offices have also been working with their local conservation districts on providing outreach to landowners along the Fly Creek drainage to provide education about best management practices along Fly Creek. As the Reverse Osmosis practice is currently considered an interim practice, our hope is that with successful implementation of this practice, (724) Water Treatment Facility and its associated practice can be applied to future TIP projects in other watersheds that have similar issues with surface and groundwater problems for livestock. Benefits of federal funding invested into this project can be measured in feet of stream protected by fencing. By excluding livestock full-time access to the stream, riparian health will improve, which in turn will improve stream water quality. Providing clean off-stream water will improve livestock and wildlife health. Finally, providing clean drinking water to livestock allows producers to continue producing food and fiber on those acres. This proposal will directly address the Chief’s National NRCS Priority #2, which is to increase assistance for climate-smart ag, and to support producers in mitigating climate change and building resilience across their operations. References: Environmental Technical Note No. MT-1 (Rev. 2) June 2011 Assessing Water Quality for Human Consumption, Agriculture, and Aquatic Life Uses Livestock Water Quality (AS1764, July 2015) Miranda A. Meehan, Extension Livestock Environmental Stewardship Specialist Gerald Stokka, Extension Veterinarian/Livestock Stewardship Specialist; Michelle Mostrom, Veterinary Toxicologist https://www.ag.ndsu.edu/publications/livestock/livestock-water- quality Fly Creek Geology-Hydrogeology Report written by Kari Scannella, MT NRCS State Geologist. Assessment Record: MT43Q002_010.pdf Montana DEQ Water Quality Standards Attainment Record 2018 and 2020. 16 | P a g e
USDA-NRCS Yellowstone County Long Range Plan, Updated 2021.
https://www.nrcs.usda.gov/wps/portal/nrcs/mt/technical/cp/9a200147-d6da-4bcc-bc52-
4862802bc522/.

USDA-NRCS Big Horn County Long Range Plan, Updated 2021.
https://www.nrcs.usda.gov/wps/portal/nrcs/mt/technical/cp/7503a9b8-1bd9-43d3-81f1-
e3ff6a384de4/.

17 | P a g e
Appendix A: Additional Maps

Figure 2.1- Fly Creek TIP Project Area is in red crosshatch; Fly Creek Watershed Boundaries are in blue outline.

18 | P a g e
Pompeys Pillar
                 Yellowstone River

Figure 2.2 - Detailed view of Upper and Lower Fly Creek watersheds with topographic background to orient tributaries, roads,
and other named landmarks.

19 | P a g e
Figure 2.3 - View of the 2 mile buffer on each side of Fly Creek proper. This delineated area is around 111,752 acres was used to develop the TIP Project Area. 20 | P a g e
Figure 2.4 - Map showing the Geology in the Fly Creek TIP project area. Data courtesy from Montana Bureau of Mines and
Geolgoy.

21 | P a g e
Appendix B: Excerpts from Fly Creek Geology-Hydrogeology Report by Kari
Scannella, USDA-NRCS
4.1 Fly Creek Watershed Water Quality Results

There are few wells with water quality samples within the Fly Creek Watershed (Table 5). Available water
quality samples, including those collected by the Ranchers, indicate exceedingly high sulphates,
chlorides, and nitrates (Table 5). Wells are within alluvium, Judith River Formation, Claggett, Colorado
Shales, Eagle, and Lakota Formations. Upper safe levels for Sodium are 2,000 mg/L; Magnesium 2,000
mg/L; Sulfate is 1,500 mg/L; Chloride is 1,500 mg/L; Nitrates is 100 mg/L, but there is health risk
between 10 mg/L and 100 mg/L; Total Dissolved Solids (TDS) is 1,000 mg/L; and Selenium is 0.05 mg/L.

4.2.4 Sulfate

Sulfate occurs from natural and human activities. Sulfates originate from dissolution or weathering of
sulfide and evaporite minerals such as gypsum and limestone. Human activities may come from sulfur-
based waste products, such as from municipal, industrial, or agricultural effluents. High sulfate content
in the water around and within Fly Creek Watershed likely originates from weathering and leaching of
pyrite, anhydrite, and/or gypsum from marine shales. When non-shale formations are deeply buried,
sulfates are typically reduced to hydrogen sulfide and chloride. Elevated sulfate levels may cause
reduction of copper in livestock diet, loose stools, and damage to their central nervous system. High
levels may also increase polioencephalmomalacia (PEM), a brain disorder found only in livestock (NDSU
2015).

4.2.4.1 Fly Creek

Fourteen (14) wells in the Fly Creek watershed have detectable sulfate levels (Table 5). Of these, five (5)
have elevated concentrations, ranging from 3,340 mg/L to 6,000 mg/L compared to 1,500 mg/L the safe
standard for stockwater use (NRCS 2011). Elevated concentrations are in alluvium, Judith River
Formation, and Eagle Formation.

4.2.4.2 Yellowstone County

There are 107 features in Yellowstone County with elevated sulfate concentrations, measuring between
1,500 mg/L and 17,995 mg/L. Twenty-eight (28) features (petroleum, ditches or canals, and streams)
have no well depth information. Approximately 80% of features with elevated sulfate concentrations and
well depths are less than approximately 100-feet-deep in Quaternary alluvium and terrace deposits,
Lance, Judith River, and Eagle Formations (Table 9). Majority of the wells are along the Yellowstone
River.

4.2.4.3 Big Horn County

There are 102 features with elevated sulfate levels in Big Horn County, measuring between 1,500 mg/L
to 9,376 mg/L. Approximately 80% of the wells with elevated concentrations are less than around 100-
feet-deep in Quaternary Alluvial terrace gravels, alluvium, Jurassic Madison Limestone and Tensleep
Formations (Table 9). Majority of the wells are along the Big Horn River and Tullock Creek, southeast
from the Fly Creek watershed.

22 | P a g e
8.0 Conclusions

There is feasibility to drill new wells in the Fly Creek watershed to achieve the requested 5 to 15 gpm;
however, groundwater quality is marginal to poor. Before any new well is drilled more investigations are
required to pinpoint the source or sources, otherwise a new well may produce no better water quality
than existing wells. The biggest concerns for water quality include elevated selenium, sulfate, sodium,
Nitrate, Chloride, TDS, and SAR. Based on available information, there are at least six identified potential
factors – listed below in no priority order - within the Fly Creek Watershed that may be influencing and
elevating mineral concentrations:

Issue 1 – Land use:

Consideration for setback distances not only between existing water wells and agricultural facilities but
setback distance between agricultural facilities and Fly Creek. There is also consideration for well
placement in relation to the agricultural facility (feedlot, agricultural waste pond, manure piles), i.e. is
the well upgradient of downgradient from the facility? A downgradient well that is within 1,000 feet of
the agricultural facility may be susceptible to contamination. Nitrates from agricultural practices, such as
fertilizer application and animal waste can impact water wells and Fly Creek, if too close to the water
source. Excessive irrigation can flush mineral accumulations in soils and unsaturated zones down into
groundwater sources. Irrigation can also raise the water table, and further increase mineral
concentrations through evapotranspiration.

Issue 2 – Climatic Change:

Flooding and drought may contribute to elevated sulfate, sodium, and nitrate concentrations. Flooding -
like excessive irrigation - may transport or flush large quantities of water and mineral accumulations in
soils, down into groundwater sources. Minerals and contaminants may also enter groundwater sources
because of runoff. Contrary, reduced rainfall or drought may dry up water sources, leaving behind
concentrations of evaporates, such as sulfates and sodium and thus not dilute concentrations.

Issue 3 – Local Geology:

Local geology consists largely of shale, which is more soluble and easily weathered compared to other
rocks, such as sandstone, granites, etc. Shales contain many of the constituents that are detectable and
elevated in the Fly Creek Watershed.

Issue 4 – Shallow Wells:

Over 60% of the water wells are installed in alluvium and this is likely because wells are generally less
than 100-feet-deep (low cost) and are productive. However, hydraulic properties of this shallow aquifer
system are vulnerable and susceptible to land use, climate changes, drought, and contamination,
including from high mineral concentrations. In other words, alluvium is helping to transport high mineral
concentrations and other toxins downstream.

Issue 5 – New Petroleum Wells:

According to local producers, there are several new petroleum wells installed north of Toluca, Montana –
within the Fly Creek Watershed – around the same time as livestock started becoming sick and dying. To
determine if these new petroleum wells are possibly contributing to water quality issues, more

23 | P a g e
information is needed. Potentiometric/Piezometric surveys are required to compute local ground flow
direction along with possibly calculating a 4-log pathogen reduction study and collecting water quality
samples for organic chemicals.

Issue 6 – Mining Activities:

Mining activities in eastern and southeastern Big Horn County might play a role in water quality in the
Fly Creek Watershed. USGS installed several monitoring wells in spoil banks (tailings piles from mining
excavation). Spoil Banks generally have less than 2 mg/L of selenium; 0.1 to 5.3 mg/L of nitrate; TDS
ranges from around 1,000 to 7,600 mg/L; and sulfate ranges from approximately 2,400 to 4,400 mg/L.
There are no measurements for sodium levels. To rule out this potential source, a regional groundwater
flow direction study is necessary to determine if contaminates may be migrating into the Fly Creek
Watershed area.

Excerpts and tables from the Fly Creek Geology and Hydrogeology Report that included the well
sampling are below:

Ten (10) wells have elevated Nitrate concentrations in Fly Creek Watershed (Table 5). Values range from
1.2 mg/L to 104 mg/L in alluvium, 0.25 mg/L in the Judith River Formation (960 ft), 10.8 mg/L in the
Claggett Formation shales (70 ft), and 0.010 mg/L to 0.06 mg/L in the Lakota Formation (3,000 ft).
Values less than 10 mg/L are taken between 1980 and 1997. Most recent data collected by Ranchers are
the higher nitrate values, ranging between 11 and 104 mg/L. Exceedingly high values indicate shale and
land uses practices may be one of the main driving forces

24 | P a g e
Eight (8) wells in the Fly Creek Watershed have elevated TDS (Table 5), ranging between 11,000 and
13,600 mg/L in alluvium, 1,219 to 4,047 mg/L in the Lakota Formation (~3,000 ft); 1,132 mg/L in the
Claggett Formation (70 ft); 2012 mg/L in the Judith River Formation (960 ft); 5,454 to 13,490 mg/L in the
Eagle Formation (120 - 4,300 ft); and 10,386 mg/L in the Colorado Group Shales (371 ft) (not listed in
Table 5).

25 | P a g e
You can also read