FORWARD DANE Updating Metrics in Light of Vaccination Progress - MARCH 2, 2021 - Public Health Madison & Dane County
←
→
Page content transcription
If your browser does not render page correctly, please read the page content below
FORWARD DANE
 Updating Metrics in Light of
 Vaccination Progress

 MARCH 2, 2021
March 2, 2021                   1
The Changing COVID-19 Landscape & the Role of
Metrics
Since the first person tested positive in Dane County for COVID-19 over a year ago, we have learned a
great deal about how COVID-19 is transmitted and ways to take preventative actions across the risk
spectrum. Throughout the pandemic, we have relied on a set of metrics (Appendix A) to help us
understand the spread of the virus and its impact on our community, and to help us identify when
additional action was needed. These metrics were developed based on what little was known about
COVID at the time. The number of cases per day, and percent positivity are some of the key indicators
we’ve used to make decisions on county-wide policies for preventing the virus from spreading.
The landscape of COVID metrics has changed since the beginning of the pandemic. As communities
experienced fluctuations in case and hospitalization levels, we learned lessons about where pressure
points existed. Communities learned when hospitals were overwhelmed, when public health contact
tracing systems were stressed, and where testing levels needed to be in order to identify as many COVID
infections as possible. As the pandemic has progressed, these learned experiences became more
important to decision-making than the existing metrics. Therefore, fewer communities are linking
reopening stages to predetermined metric thresholds. This is due to health systems being better
equipped to care for COVID patients than in the Spring of 2020, a shifting baseline level of what we’re
willing to accept as a ‘normal’ level of COVID as a society, and the nuances of different scenarios that
cause spikes in cases (like a cluster in university students) or percent positivity, for example.
Before the emergence of COVID-19 vaccines, it was challenging to fully control the pandemic or meet all
of our goals as the virus moved unpredictably through our communities. Since we have started
vaccinating people, we have entered a new era of hope and possibility. The more we can vaccinate
vulnerable populations, the more they will be protected; the more people at high risk of severe disease
are vaccinated, the less hospitalizations and deaths will occur. As viral immunity increases among all
populations, businesses and gatherings will become safer at higher capacities, and people will feel safer
resuming more activities. Vaccines are the key to moving Dane County to a new normal, one where
people can be healthy and protected while also being able to live, work, play, and learn.
Where We’ve Been
Given the changing role of metrics and the importance of vaccines in protecting the community, Dane
County is re-centering its goals and updating the measures that are monitored regularly. There is no
guidebook to metrics, thresholds, or what a county-wide reopening process during a pandemic looks
like. Approaches differ between counties, states, and countries. The same set of data can lead to
different decisions, and there is no ‘right’ answer. Alongside data, we have seen values and varying
priorities impact decision-making across the country. In addition, the overall goal may impact decisions
and policies. Some goals that have impacted our health department, city, and county’s decisions are to:
Protect the most vulnerable populations (older adults, people of color, essential workers, for
example)
Prevent severe outcomes and deaths
Preserve hospital capacity
Promote economic well-being particularly among those most impacted by job loss
March 2, 2021 2A cautious, and stepwise reopening has remained Dane County’s approach—an approach that has likely
contributed to Dane County having one of the lowest case and death rates in the state despite it being a
population center. Masking, distancing, and staying outdoors remain key prevention tools. These
prevention tools remain critical as spread of more transmittable COVID-19 variant strains is increasing in
the U.S.
Where We’re At
Although there is still much to learn about COVID-19 and how it spreads, we do know that we have safe
and effective vaccines, and we know that the number of vaccines in arms can only go up from here.
While we can’t predict the future, we know that, barring misfortune, Dane County will only have more
immunity to the virus as the days and weeks go on.
Dane County’s COVID-19 vaccination status right now:
Coverage: As of March 1, 18.3% of the Dane County population has at least one dose of vaccine
Natural Immunity: As of March 1, 40,376 people have tested positive for COVID (7.4% of
population)
o A Yale/Harvard model estimates that the true percentage of people living in Wisconsin
have been infected (including those who never received a test) is likely three times
higher than the known percentage. Therefore, the true percentage of people who have
had COVID in Dane County could be somewhere closer to 20%, given the county has had
robust testing available through much of the pandemic.
Rate: On average thus far, every day 0.6% of the Dane County population receives either a first
or second dose.
In summary, as of mid-February, after two months of vaccination, 15% of the Dane County population
had at least some level of vaccine-conferred immunity. Adding the level of people who have had COVID
but have not yet been vaccinated (unknown) confers an additional level of population-level immunity.
The “true” level of immunity may currently lie in the 25% range. Given natural infection with COVID
provides durable immunity for most people for at least eight months, the combination of people who
have had COVID with people who have been vaccinated for COVID with people who have both had
COVID and have been vaccinated with COVID will all contribute to herd immunity. Herd immunity means
that a high enough percentage of a population has either had the disease, or been vaccinated against it,
that the chance of it spreading is very low.
Where We’re Going
While we carefully enter the new stage of pandemic response—a stage where vaccination is our main
pathway to reopening, our metrics will need to reflect our new reality. Moving forward with a new set
of metrics will look like the following:
Public Health orders will take into consideration new set of measures that emphasize vaccine
distribution and uptake
Specific thresholds will be removed from measures, to be replaced by more flexible goals (to
allow us to adapt measures to the pandemic more rapidly)—for example, the threshold of four
cases per day qualifying as a ‘green’ case level will no longer be the framework.
March 2, 2021 3The New Measures
Vaccine Core Measures
The core measures are all measures of herd immunity in Dane County. We do not yet know what level of
vaccination leads to herd immunity for COVID-19, or how current or future variants might affect herd
immunity. We know based on other diseases that herd immunity is likely at least 60%, and if more
transmissible variants become more common, that threshold may become higher. We also know we will
likely see population-level positive effects on COVID-19 cases and hospitalizations before we reach herd
immunity. We have provided a range below to show that there is still much to learn about COVID-19
herd immunity.
Measure How used
Percent of Dane County population that is fully Monitors the level at which we’re approaching
vaccinated (2 doses for vaccines requiring 2 doses; herd immunity via vaccination. Current estimates
1 dose for single-dose vaccines) of herd immunity are 60-90%.
Percent of Dane County population that is at least Monitors the level at which we’re approaching
partially vaccinated herd immunity via vaccination. Current estimates
of herd immunity are 60-90%. We will see
population-level impacts prior to reaching herd
immunity.
Percent of Dane County population aged 65+ that Monitors the level of vaccination among the age
is at least partially vaccinated group most at risk of severe outcomes and death
with at least partial protection. This number may
need to reach 60-90% to ensure adequate
protection of this population.
Current vaccination status as of March 1, 2021:
March 2, 2021 4Vaccine Process Measures
In addition to the three core measures, we will explore methods to track additional vaccine process
measures. Some of these may include the following:
Measure How used
Immunity: Percent of Dane County that is fully Monitors progress toward herd immunity via both
vaccinated + percent with immunity from past previous infection and vaccination. Due to
infection immunity conferred from natural infection, herd
immunity will likely arrive faster than the pace of
vaccination.
Rate: rate of vaccination Monitors the speed with which vaccination
coverage is occurring. As of mid-February, an
average of 3,000 doses per day were administered
to residents. This will change as supply changes.
Equity: Percent of key populations that are Monitors the level of vaccine protection for
partially vaccinated. Groups to monitor may vulnerable populations
include populations that may either be more
vulnerable to severe COVID-19 outcomes OR that
may have challenges accessing the vaccine even
when widely available (for example, Black, Latinx,
and rural populations)
Variants: Variant strains as predominant version Monitors whether variant virus strains are
of virus in community becoming the dominant strain, which will have
impacts on transmissibility
Epidemiologic Measures
In addition to looking at vaccine measures, we will continue to look at disease burden and transmission
in the community. We know that if we start seeing a high level of COVID-19 hospitalizations, our
hospitals may become stressed which impacts our ability to care for those with COVID and those
without. We know that if we see, for example, 300+ cases a day, contact tracing may become stretched,
which means that we may not be able to provide isolation and quarantine support to everyone who may
need it to decrease the risk of further COVID transmission. We also know that with increasing vaccines, a
spike in cases won’t always mean a spike in hospitalizations or deaths; we will need to look at the
context around these measures when making decisions.
March 2, 2021 5Epidemiologic Was this a previous
Measures How we will use this measure Forward Dane measure?
Cases: Case count with This measure tells us whether the number of people
2-week trend with COVID-19 is stable, increasing, or decreasing.
Case counts impact all other epidemiologic measures.
A sustained increase may be a reason to implement
restrictions.
Tests: Percent positivity This measure tells us the percentage of PCR test
results that are positive. An increasing percent
positivity may be an indicator of inadequate testing,
barriers to testing, or increases in disease, while a Yes,Impact on Public Health Orders The current trajectories and models (Appendix B) are converging on a summer 2021 timeline for a potential ‘return to (a version of) normal.’ The gradual lifting of restrictions may take bigger steps—such as larger gathering limits (ultimately resulting in no limits). Family gatherings, weddings, concerts, travel, and so many of the activities we have missed may be back on the table. We could see extreme loosening or dissolving of many pandemic restrictions sometime in summer 2021. We have heard from so many people, worried about schools being closed, businesses being restricted, and gatherings being postponed. We have heard from just as many people concerned about themselves or their loved ones getting very sick or dying from COVID-19. Those concerns have often felt in conflict with each other throughout this pandemic—that to open up means getting more people in our community sick. But now we have a shared solution that keeps people healthy and allows us to open up Dane County, and that solution is vaccines. As we’ve learned repeatedly throughout this pandemic, the situation can rapidly change (Appendix C). The vaccine supply could be interrupted, affecting how quickly it can be administered. The race to protect our population with vaccine could also be impacted by the arrival of variant virus strains not even known today. However, if current trajectories and models stay the course, then we could approach a hopeful situation in a matter of months. The way out of this pandemic is through vaccines. We strongly encourage everyone to get vaccinated as soon as they are able so that we can all reach the light at the end of this pandemic tunnel. March 2, 2021 7
APPENDIX A: Former Metrics
The graphs below show quantitative metrics for each Forward Dane period since we’ve been tracking
the Forward Dane metrics. The colors indicate where we fell that week in terms of thresholds. We
struggled to meet our goals for many of the metrics—we’ve been in the red for cases, lab timeliness and
contact tracing, and community spread for much of the last year.

Average cases for Forward Dane Periods. We never reached our low threshold of fewer than 4 cases
per day, and we’ve been in the red (>20 cases per day) since the June 29 2020 snapshot. We know that
high case counts have cascading impacts, but where that line is has become difficult to identify. This is
why we do not set thresholds for new measures, but rather case counts and 2-week trends with other
measures we’ll monitor.

Average percent positivity for Forward Dane Periods. We have stayed below 10% percent positivity
throughout our local epidemic, even during surges in cases, and we stayed green (
Lab timeliness and contact tracing for Forward Dane Periods. We have struggled to contact at least
70% of people with a positive COVID-19 test within 48 hours of test collection for many Forward Dane
periods. This metric is highly sensitive to surges in cases, with our lowest proportion of cases contacted
within that time period occurring during the fall 2020 surge in cases. We will continue to monitor this
measure, as reducing the spread of COVID-19 will continue to be an important tool as vaccination
coverage increases.

Community spread for Forward Dane Periods. This measure has hovered around 30% over the course
of our local epidemic. Since we have not seen much variation, we will discontinue regular monitoring of
this measure moving forward.

March 2, 2021                                                                                                9
APPENDIX B: Models
Models are one way to get a sense for what may be to come. CDC averages case models from across the
country and averages them here. Similar model summaries will emerge regarding vaccination
projections. Summaries of a few models:
Model 1 summary:
"The US will be near COVID-19 herd immunity/normality by summer 2021 (Jun-Aug 2021).”
“Due to vaccine hesitancy and the later arrival of a children’s vaccine, it is possible that we do
not reach the levels required for herd immunity in 2021. Nevertheless, herd immunity is not a
hard threshold, and being close to herd immunity may be sufficient to prevent large outbreaks.”
“At the time herd immunity is near, roughly half of the immunity will be achieved through
natural infection, and the other half will be achieved through vaccination.”
o While it’s still unclear if prior infection confers long-term immunity, recent research
(here and here) indicates that short-term reinfections are rare.
“New infections may become minimal before herd immunity is reached. But due to imported
cases and localized clusters, it is unlikely that new infections will drop to zero until at least
2022.”
“Deaths may drop to low levels even earlier (May-Jul 2021), in part due to a vaccine distribution
strategy that initially prioritizes individuals who are most at risk of severe illness and death.”
“Summarizing the above findings, this model’s best estimate of a complete “return to normal”
in the US is mid-summer 2021 (June/July 2021).”
Model 2 summary:
If the country maintains its current pace of administering first doses, about half of the total
population would be at least partially vaccinated around early July, and nearly the entire
population by early December, assuming supply pledges are met and vaccines are eventually
available to children.
Model 3 summary:
When 0.5% of a population is vaccinated each day, and the infection rate is 1.5, it would take
100 days to reduce the number of new infections by around 80%. This model does not take into
account the proportion of the population that may have some immunity due to prior COVID
infection, nor does it account for the new variant.
Applying Real-World Vaccination Trends & Models to Dane County
Context
It took two months to cover 15% of the Dane County population with at least one dose of the vaccine. It
is conceivable, at the current rate (which is dependent on supply and uptake), that we will reach 30% in
another two months and 45% another two months later (mid-June). Adding on the (unknown)
proportion of people who have had COVID but not been vaccinated, we could see herd immunity
achieved this summer. However, we are likely to see impacts of vaccination before this summer:
accounting for vaccine distribution, estimated infections in Wisconsin are projected (as of February 23,
2021) to decrease to 473 cases statewide per day by May 2021—meaning an estimated 47 or less
March 2, 2021 10infections in Dane County per day (14 of which would be confirmed through testing). Even with the
variant, this model estimates 873 cases per day statewide, or about 87 cases (26 of which would be
confirmed) in Dane County per day.
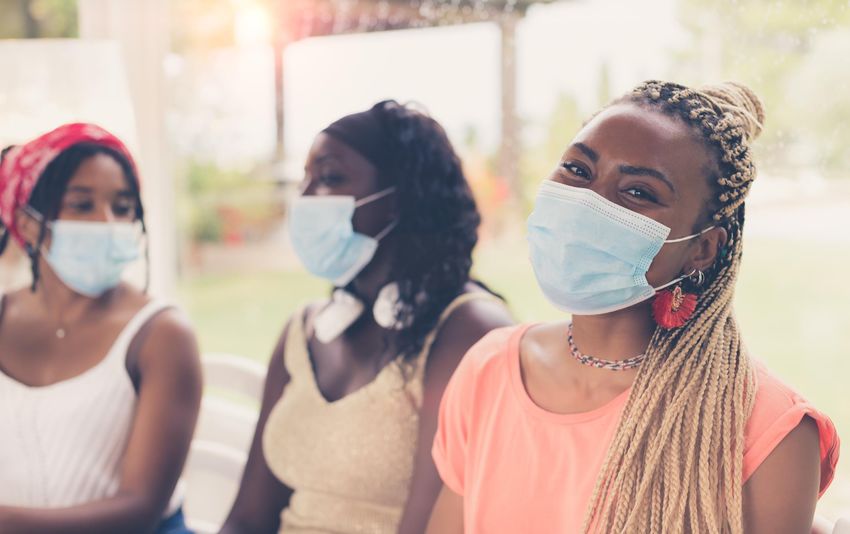
Trajectory of cumulative cases (blue), first dose (purple) and second dose (green) in Dane County
100,000
90,000
80,000
70,000
60,000
50,000
40,000
30,000
20,000
10,000
0
3/7/20 4/7/20 5/7/20 6/7/20 7/7/20 8/7/20 9/7/20 10/7/20 11/7/20 12/7/20 1/7/21 2/7/21
March 2, 2021 11APPENDIX C: Emerging Issues that May Impact Our
Local Epidemic & Response
SARS-CoV-2 Variants
Variants of a virus happens when a virus changes, or mutate. It’s common for viruses to mutate over
time, so SARS-CoV-2 variants are not surprising or unexpected. While there have been several variants
that have emerged since the virus was first detected, there are three key variants that we are watching
closely: the UK variant (B.1.1.7), the South Africa variant (B.1.351), and the Brazil variant (P.1). Key
information about emerging variants that could impact our local COVID-19 epidemic include:
Do these variants infect people more easily?
There is some evidence that the UK, South Africa, and Brazil variants spread more easily and
quickly. A recent study in Manaus, Brazil, has raised questions about the potential for re-
infection with the Brazil variant due to a recent surge of infections in a community with a high
level of acquired immunity (75%). More research is needed to understand how these variants
impact transmission.
How widespread are these variants?
All three variants have been detected in multiple countries. We have 6 documented cases of the
UK variant in Wisconsin as of February 2021. It’s unclear how widespread these and other
variants are in Wisconsin (and the US) because we have limited genomic sequencing.
Do these variants cause more severe COVID-19 disease (e.g., a higher likelihood of
hospitalization or death)?
There is some evidence that the UK variant may be associated with a higher mortality rate
compared to the original strain. Evidence is still emerging, and we will learn more over time
about this variant’s impact on severe COVID-19 disease.
Do vaccines work on these variants? There is some evidence that the mRNA vaccines (Pfizer and
Moderna) are protective with some reduced efficacy. We will learn more over time how
protective vaccines are against these variants.
The bottom line: Vaccines appear to be effective against the UK, South Africa, and Brazil variants.
However, as we have limited vaccine supply, we must continue to wear masks, practice physical
distancing, and limit indoor gatherings to reduce COVID-19 infection and keep the number of new
infections due to these variants—and new variants that may emerge—low.
Immunity to SARS-CoV-2
We can reach herd immunity through immunity acquired through vaccines and immunity acquired from
having a previous COVID-19 infection. We don’t know how long immunity lasts—although emerging
research is promising and suggested immunity will last at least 8 months—whether acquired through
vaccination or infection. If the duration of immunity is short, we might see more reinfections over time,
and vaccine boosters may be needed on a regular basis to assure immunity to SARS-CoV-2. We will
continue to learn more about the duration of immunity over time.
March 2, 2021 12APPENDIX D: Questions & Answers
How will you be determining future orders using these new measures?
We will be looking at these measures as a whole when determining orders. We hope to consistently see
progress in our three core vaccine measures:
Percent of Dane County population that is fully vaccinated (2 doses for vaccines requiring 2
doses; 1 dose for single-dose vaccines)
Percent of Dane County population that is at least partially vaccinated
Percent of Dane County population aged 65+ that is at least partially vaccinated
We want to see that progress be steady or increasing. For vaccine process measures and
epidemiological measures, we hope to see positive trends in all or most areas.
There is no perfect formula that anyone in the world has developed for setting capacity limits or
restrictions. There is no national standard of “if your case rate is x, then your gathering limit is y.” Cities,
states, and countries are figuring these things out based on local data, national trends and guidance, and
public health and health care system capacity. What we do know is that as the pandemic gets better, we
can loosen restrictions, and as the pandemic gets worse, we must tighten restrictions. The vaccine gives
us assurance that immunization rates can only get better. Unless we see signs of the pandemic getting
worse, such as new variants causing more disease or a lack of vaccine supply causing a lag in immunity,
we are cautiously hopeful that from here out restrictions will slowly be getting less strict.
Your old metrics had thresholds. Why don’t you have thresholds now?
This framework is designed to be more flexible than our old framework. For one, we don’t know what
some of these measures will look like in the future (such as herd immunity), so we don’t want to lock
any one number in at this point that may change as we learn more about the virus and herd immunity.
Additionally, not having thresholds allows us to take a look at the context around each measure. If a
measure is not quite where we think it should be, but trending in the right direction, we can now take
that into consideration instead of being locked into a threshold.
Why did you release new metrics now?
The approval of several COVID-19 vaccines in December 2020 and January 2021 has changed the course
of the pandemic. With a vaccine, along with other prevention measures, we are able to prevent the
spread of COVID-19 more effectively than ever before. This means that we have to adjust our public
health response to consider the effects of the vaccine on our county. And we knew we would have to do
this; in our original Forward Dane plan, we imagined that a vaccine would lead to a new normal for us.
This new iteration will hopefully lead us to a new normal.
What is the science that backs this change in approach?
Please see Appendix B and C for examples of emerging research and modeling that informed this
decision. Please also see the CDC’s “14 Diseases You Almost Forgot About” for a quick walkthrough of
how vaccines have changed the epidemiology of many other communicable diseases throughout
history.
March 2, 2021 13What is “herd immunity” and how will we know when we’ve reached it? “Herd immunity” is when enough people in a population are immune to a disease that it prevents the rapid spread of that disease. The herd immunity threshold is different for different diseases depending on how contagious they are, so we don’t quite know the threshold where our population will be immune to COVID-19. We can guess that it’s above 60-70% based on other diseases like it, but we will learn more as more people become vaccinated. For measles, which is more infectious than COVID-19, around 94% of the population must be immune to interrupt the chain of transmission. Will we be under public health restrictions forever? No, it is not our intention to keep public health restrictions in place forever (or long term). The sooner our community reaches herd immunity, the sooner we will all be protected from severe outcomes, death, and overwhelming hospitalization rates and the sooner restrictions become less strict. I want a vaccine right now, but I can’t get one. Why aren’t you vaccinating people faster? We also want to be vaccinating people faster. As of right now (February 2021), vaccines are distributed from the Wisconsin Department of Health Services (DHS) to vaccinators throughout the state. PHMDC is one vaccinator of many in Dane County—UW Health, SSM Health, Meriter, Walgreens, and many more also work with DHS to receive vaccines. We ask DHS for a certain number vaccines every week, but have consistently been getting far less vaccine than we ask for, because there simply aren’t enough vaccines to go around. This isn’t just a Wisconsin issue either—there is a vaccine shortage throughout the U.S. While we’re not in control of the vaccine supply, we are hopeful that in the spring and summer, anyone who wants a vaccine will be able to get one. We’re planning on vaccine supply continuing to go up. But even with our current amount of vaccine, we are already seeing significant numbers of people with at least one dose, which is a hopeful sign for the spring and summer. What about these new variants? How will they affect reopening? Variants could slow reopening, especially if people are hesitant to get vaccinated or are moving too quickly to reopen and creating opportunities for spreading COVID-19. We don’t yet know how vaccines will protect against every variant, and new variants might emerge in the future that pose new threats. We will need to be nimble in responding to variants should they create more disease in Dane County. Where do you get your data from? Vaccine data is from the Wisconsin Immunization Registry (WIR). COVID-19 case data is from the Wisconsin Electronic Disease Surveillance System (WEDSS). Both are statewide databases run by the Wisconsin Department of Health Services (DHS). How do I know if something is “safe”? What if I don’t feel safe doing something allowed by public health orders? Public health orders focus on a population level. That means that orders are framed with the question, “what restrictions need to be in place so that we can protect vulnerable people, preserve hospital capacity, slow the spread of the virus, and prevent deaths in our community?” March 2, 2021 14
That’s different than a person making a decision for themselves about what is safe or unsafe for them
individually. Just because gatherings are allowed does not mean that there is 0% risk at a gathering, and
someone who goes to one or multiple different gatherings every day may end up testing positive from
that behavior. Public health orders are the minimum people need to do to keep our county population
as a whole healthy and slow the spread of the virus. Individuals might need to make stricter choices for
themselves based on their comfort with the risks.

March 2, 2021                                                                                          15
You can also read