Fukushima Daiichi 2011-2021 - The decontamination myth and a decade of human rights violations - Greenpeace
←
→
Page content transcription
If your browser does not render page correctly, please read the page content below
Fukushima Daiichi
2011-2021
The decontamination myth and a decade
of human rights violations

                               March 2021
              01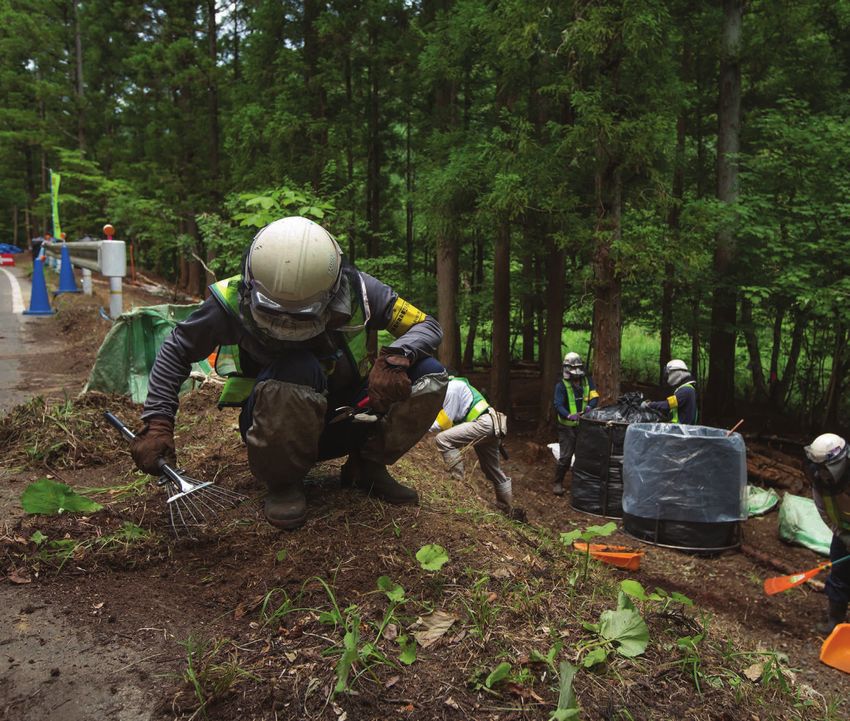
Contents

Executive summary

 1 The reality of contamination in
   Fukushima
 2 The decontamination myth
 3 Greenpeace surveys
 4 Areas where evacuation orders
   have been lifted – Iitate and Namie
 5 Iitate district
 6 Namie town and district
 7 Namie ‘difficult-to-return’
   exclusion zone
 8 Strontium-90 – an additional
   threat
 9 Ten years of evacuation,
   displacement and human rights
   violations
10 The future of difficult-to-return
   exclusion zones
11 Conclusion and recommendations

Endnotes

Cover: Nuclear waste storage area in Iitate, Fukushima prefecture.
(October 1, 2017)
Page 2-3: Greenpeace survey team in Namie, Fukushima prefecture.
(March 26, 2011)
© Christian Åslund / Greenpeace

                                                                     02
Acknowledgements
Radiation survey team 2020                         Report team 2021
Coordinator and Lead Radiation Protection:         Survey data compilation: Jan Vande Putte, Greenpeace Belgium
Mai Suzuki, Greenpeace Japan                       and Mai Suzuki, Greenpeace Japan
Researcher: Daisuke Miyachi, Greenpeace Japan      Report and analysis : Shaun Burnie, Greenpeace East Asia;
Technical support: Jan Vande Putte, Greenpeace     Jan vande Putte, Greenpeace Belgium; and Heinz Smital,
Belgium and Heinz Smital, Greenpeace Germany       Greenpeace Germany
Communication/photography support:                 Review and Editing: Dr Rianne Teule (Greenpeace RPA
Mitsuhisa Kawase, Greenpeace Japan                 coordinator); Kazue Suzuki, Greenpeace Japan; Insung Lee,
                                                   Greenpeace East Asia; Caroline Roberts
Survey teams 2011-2020                             Photographs: Christian Aslund; Shaun Burnie, Greenpeace East
Since March 2011 there have been many members      Asia; Mitushisa Kawase, Greenpeace Japan
of the Greenpeace radiation survey teams who we    Production coordination: Akiko Tsuchiya
wish to thank: Jan van de Putte, Jacob Namminga,   Report design: Yoshiaki Mitsuishi
Rianne Teule, Nikki Westwood, Mai Suzuki, Stan
Vincent, Iryna Labunska, Heinz Smital, Shawn-      A very special thanks to all house owners in Namie and Iitate,
Patrick Stensil, Thomas Breuer, Sakyo Noda,        who over the years have kindly granted us access to their home.
Daisuke Miyachi, Yuting Lei, Jan Beránek, Cedric   In particular Fukushima evacuees, Ms. Kanno and Mr. Anzai who
Counord, Florian Kasser, Michael Meyer-Krotz,      were so very generous with their time and much appreciated and
Laurence Bergot, Daul Jang, Jehki Harkonen, Jan    necessary guidance during our survey work.
Haverkamp, Rashid Alimov, Mathieu Soete, John
Murphy, Alexey Kiselev, Jun Kwon Song, Adarsh      We also would like to express our deep appreciation to
Vansay, Ike Teuling, Prentice Koo, Karuna Raina,   Japanese citizens who kindly donated to this project. Their
Ferrial Adam.                                      critical support made this survey project possible.

                                                     03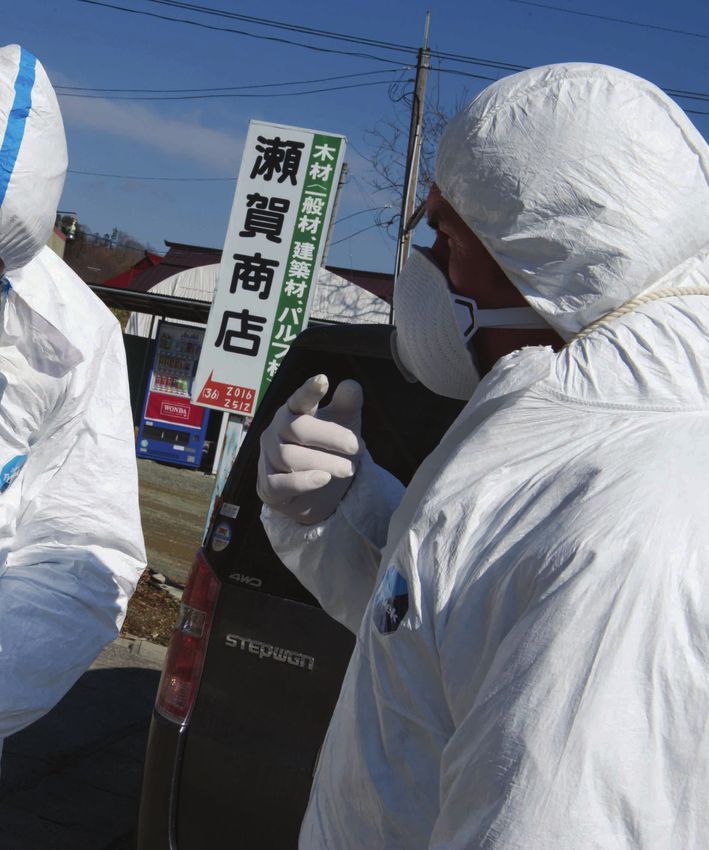
Greenpeace | Fukushima Daiichi 2011-2021

Executive summary
As a result of a catastrophic triple reactor meltdown          these people lost their livelihoods, communities, and
at the Fukushima Daiichi nuclear plant on 11                   property as a result of a nuclear disaster they had no
March 2011, several tens of thousands of square                part in creating, this is grossly unjust.
kilometres in Fukushima Prefecture and wider
Japan were contaminated with significant amounts
of radioactive caesium and other radionuclides.1               Key findings
The first Greenpeace radiation expert team arrived
in Fukushima on 26 March 2011, and Greenpeace                  The failure of decontamination
experts have since conducted 32 investigations into
the radiological consequences of the disaster, the             The Japanese government claims that, with
most recent in November 2020.                                  the exception of the 'difficult-to-return' zones,
                                                               decontamination has largely been completed within
This report, the latest in a series, chronicles some of        the Special Decontamination Area (SDA), which
our principal findings over recent years, and shows             includes the municipalities of Namie and Iitate. Yet
how the government of Japan, largely under prime               Greenpeace has consistently found that most of the
minister Shinzo Abe, has attempted to deceive the              SDA, where the government has taken direct charge
Japanese people by misrepresenting the effectiveness           of decontamination, remains contaminated with
of the decontamination programme as well as the                radioactive caesium. In fact, despite an enormous
overall radiological risks in Fukushima Prefecture.            decontamination programme, analysis of the
As the latest Greenpeace surveys demonstrate, the              government’s own data shows that in the SDA an
contamination remains and is widespread, and is still          overall average of 15% has been decontaminated.
a very real threat to long term human health and the           In the case of Namie for example, of the 22,314
environment.                                                   hectares that make up the municipality, only 2,140
                                                               hectares have been decontaminated - just 10% of
The contaminated areas comprise rice fields and                 the total. One major reason for this is that much of
other farmland, as well as a large amount of forest.           Fukushima prefecture is mountainous forest that
Many people who lived in these areas were employed             cannot be decontaminated.
as farmers or in forestry. Residents gathered wood,
mushrooms, wild fruits and vegetables from the                 The Japanese government’s long-term decontamination
mountain forests, and children were free to play               target level is 0.23 microsieverts per hour (µSv/h), the
outdoors in the woodlands and streams. Since the               level they estimate would lead to an annual dose of 1
disaster, tens of thousands of people have been                millisievert per year (mSv/y). This is the recommended
displaced from their ancestral lands. The harm                 maximum level for public exposure to radiation other
extends far beyond the immediate threat to health –            than from medical or natural background exposure.
as well as destroying livelihoods, it has destroyed an         Confronted with radiation levels that would result in
entire way of life.                                            annual exposure above this level, in April 2012 the
                                                               government changed the recommended maximum
Because of the government’s actions, many                      to 20 mSv per year, the same as the yearly average
thousands of evacuees have been forced to make                 allowed for Japanese nuclear plant workers under
an impossible choice: to return to their radioactively         normal circumstances. At no time since has the
contaminated homes or to abandon their homes                   government given a timeframe for when ‘long-term’
and land and seek to establish a new life elsewhere            targets of 0.23 µSv/h are to be reached.
without adequate compensation. This amounts to
economic coercion and may force individuals and                In its radiation surveys over the last decade,
families to return against their will due to a lack of         Greenpeace has consistently found readings well
financial resources and viable alternatives. Given that         above the Japanese government’s decontamination

                                                          04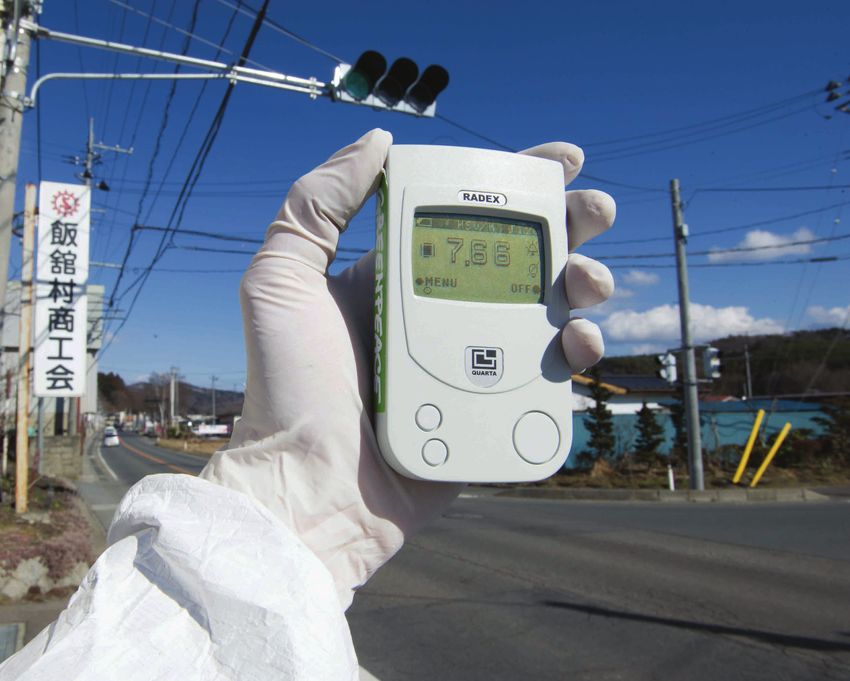
Greenpeace | Fukushima Daiichi 2011-2021

target levels. The following data are a selection from        analysis needed for accurate measurement, the
the most recent surveys conducted in November                 Japanese government has used calculations based
2020.                                                         on an anticipated constant ratio between radioactive
                                                              caesium and strontium. Research published in
 • At a home in Iitate (Mr Anzai’s house) every               2015 warned that this is likely to result in error, and
   measurement taken in five of the 11 zones                   potentially underestimate the strontium risks. The
   surrounding the property still exceeded the                Japanese government continues to largely ignore
   government target of 0.23 µSv/h, with an average           the potential hazards from strontium 90 and other
   radiation level across all zones of 0.5 µSv/h.             radionuclides in Fukushima Prefecture.
 • At a former school and kindergarten in the town
   of Namie, all of the 822 points measured in an             The greatest threat from strontium-90 comes from
   adjacent forested area remained above the 0.23             the enormous amount at the Fukushima Daiichi site,
   µSv/h target and 88% measured above 1 µSv/h.               and in particular the amount in the melted reactor
   In the area directly outside the school, 93% of            fuel cores in reactor units 1-3. There are uniquely
   all data points measured remain above the 0.23             hazardous risks from current plans to decommission
   µSv/h target. Nevertheless, this location has              the Fukushima Daiichi reactors where this strontium
   been open to the public since March 2017.                  and other radionuclides exist. A smaller but
 • In 70% of the points measured in Zone 1 along              significant amount is also present in the 1.23 million
   the Takase riverbank, radiation levels would give          tons of contaminated tank water stored at the site,
   an annual dose of 3-5 mSv/year based on the                and which the government is preparing to announce
   Japanese government calculation method.                    plans to discharge into the Pacific Ocean.2
 • At a home in the Namie 'difficult-to-return'
   exclusion zone (Ms Kanno’s house), which was
   previously subject to extensive decontamination            Human rights violations
   efforts, dose rates for 98% of the points measured
   exceed the annual maximum exposure level of 1              Evacuation orders have been lifted in areas where
   mSv per year. For 70% of the points measured,              radiation still remains above safe limits, potentially
   dose rates could lead to an exposure of 3-5                exposing the population to increased cancer risk.
   mSv/y based on the government calculation                  This is a particular hazard for children and women.
   method.                                                    In 2020, further plans for the lifting of restrictions
                                                              have emerged, including the opening up an area of
                                                              Iitate that is currently part of the ‘difficult-to-return’
The strontium-90 threat                                       exclusion zone.

Radioactive releases from the Fukushima Daiichi               Up until 2018, 13 million man hours of work had been
disaster and the contamination measured in 2020               applied in decontamination of the SDA, the majority
are dominated by radio caesiums. However, other               by subcontractors. As documented by Greenpeace,3
isotopes were released by the accident. This                  some workers are at risk from exposure to radiation
includes radioactive strontium-90 (Sr-90). Strontium          above safety limits, and coerced into accepting
90 is a bone seeking radionuclide which if ingested           hazardous working conditions because of economic
concentrates in bones and bone marrow, increasing             hardship. They have also received inadequate training
the risks of contracting cancer. Greenpeace sampling          and protection.
and analysis of cedar needles collected from forests
in areas of Fukushima Prefecture confirmed the                 During the past decade, the violations have been
presence of Strontium 90. Rather than conducting              challenged by multiple United Nations human
the large-scale and expensive Sr-90 laboratory                rights bodies, as well as UN Human Rights Special

                                                         05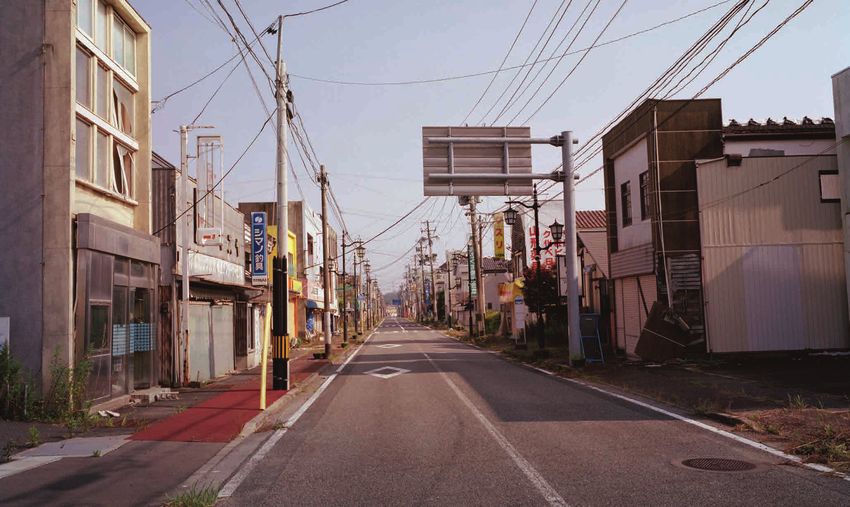
Greenpeace | Fukushima Daiichi 2011-2021

Rapporteurs, including Baskut Tuncak.4 In his report             includes evacuees.
to the UN General Assembly in 2018, Mr Tuncak                  • Provide full compensation and financial support
stated that, “It is disappointing to see Japan appear            to evacuees and allow citizens to decide whether
to all but ignore the 2017 recommendation of the                 to return or relocate on the basis of scientific
UN human rights monitoring mechanism (UPR) to                    evidence and free from duress and financial
return back to what it considered an acceptable                  coercion.
dose of radiation before the nuclear disaster.”5 In his        • Respond in full to the offer of dialogue and
report, he urged the Japanese government to halt the             guidance from UN Special Rapporteurs,
ongoing relocation of evacuees, including children               and accept outstanding requests for Special
and women of reproductive age, to areas where                    Rapporteurs to visit Japan.
radiation levels remain higher than that considered
safe or healthy before the 2011 nuclear disaster. He
also criticised the Japanese government’s decision
to raise by 20 times the level of radiation exposure it
considered acceptable, stating that it, “was deeply
troubling, highlighting in particular the potentially
grave impact of excessive radiation on the health and
wellbeing of children.”6

Greenpeace recommendations to the
Japanese Government and Fukushima
Prefecture

 • Suspend the current return policy, which ignores
   science-based analysis, including potential
   lifetime exposure risks to the population.
 • Immediately clarify its long-term decontamination
   target of 0.23 µSv/h, equal to 1 mSv/y. Set a date
   for when 0.23 µSv/h is to be attained and halt
   any plans to revise the target level to a higher
   limit.
 • Urgently assess the public health risks posed by
   radioactive hotspots, including the presence of
   caesium-rich micro particles.
 • Abandon plans to lift evacuation orders in the
   six municipalities of Futaba, Okuma, Namie,
   Tomioka, Iitate and Katsurao, including the Namie
   districts of Tsushima, Murohara, Suenomori and
   Obori.
 • In the interests of worker protection, suspend
   current decontamination programmes in the
   difficult-to-return zones.
 • Establish a fully transparent process to consider
   and reflect residents’ opinions on the evacuation
   policy and create a council of citizens that

                                                          06
1
                                                                              The reality of
                                                                              contamination
Geiger counter displaying radiation levels
of 7.66 micro Sievert per hour, Iitate,
Fukushima prefecture. (March 27, 2011)
                                                                              in Fukushima
© Christian Åslund / Greenpeace

As a consequence of the triple reactor meltdowns              then allow the lifting of evacuation orders affecting
at the Fukushima Daiichi nuclear plant in March               tens of thousands of citizens. On 29 August 2011,
2011, several tens of thousands of square kilometres          Greenpeace Japan submitted its recommendations
in Fukushima Prefecture and wider Japan were                  to the Japanese government.9 We contended that
contaminated with significant amounts of radioactive           the decontamination plan did not provide sufficient
caesium and other radionuclides.7 The geography               protection for pregnant women and children, or the
of Fukushima Prefecture ranges from coastal flood              necessary support for all evacuees. Nor was the plan
plain, including rice fields and other farmland, to            sufficiently robust to ensure that vulnerable sections
mountainous forested upland, which comprises                  of the population were protected at all points in their
more than 70% of the land. The nuclear accident               daily lives. Little has been done by the Japanese
led the Japanese government to order evacuation               government over the intervening years to improve
of 11 municipalities, or districts, in the prefecture.        and protect the lives of the tens of thousands of
On 26 August 2011, the government published its               evacuees who continue to be displaced from their
“Basic Policy on Decontamination” document, which             homes.
was associated with the “Act on Special Measures
Concerning Radioactive Material Contamination.”8              The first Greenpeace radiation expert team arrived
The stated aim of the decontamination programme               in Fukushima Prefecture on 26 March 2011. Over
was the reduction of radiation levels, which would            the last ten years, Greenpeace has conducted 32

                                                         07
Greenpeace | Fukushima Daiichi 2011-2021

investigations into the radiological consequences
of the disaster, with radiation surveys ranging from
days to several weeks. The latest survey, the results
of which are detailed below along with earlier results,
took place over two days in November 2020. The
Covid-19 pandemic meant that the survey team was
much smaller than usual, and that time in the field
was limited.

In the early days of the March 2011 surveys, our
priority was to understand the risks to the local
population, and we therefore focused on radiation
levels in areas of Fukushima Prefecture that were
outside the 20km evacuation zone established by
the Japanese government. Due to the radioactive
fallout pattern, our particular concern was with the
area north-west of the Fukushima Daiichi plant.
Within the first hours of our radiation survey, the
Greenpeace team found very high radioactivity levels
(around 10 microsieverts (µSv) per hour at 1m height)
in Iitate district, which was 40km from the damaged
reactors. The next day, 27 March, Greenpeace
officially called for its evacuation.10 The International
Atomic Energy Agency (IAEA) confirmed high levels
of radiation a few days later.11 The response at the
time from the Japanese nuclear regulator, NISA,
was that “the high radioactivity levels detected by
the NGO (Greenpeace) around Iitate could not be
considered reliable.” However, following submission
of the evidence from our survey to both the mayor of
Iitate and the Japanese government, extension of the
evacuation zone was proposed by the government
on 11 April, and ordered on 22 April.12 The villages of
Iitate and Katsurao, the town of Namie and parts of
the city of Minamisoma and the town of Kawamata
were subject to the order.

                                                           08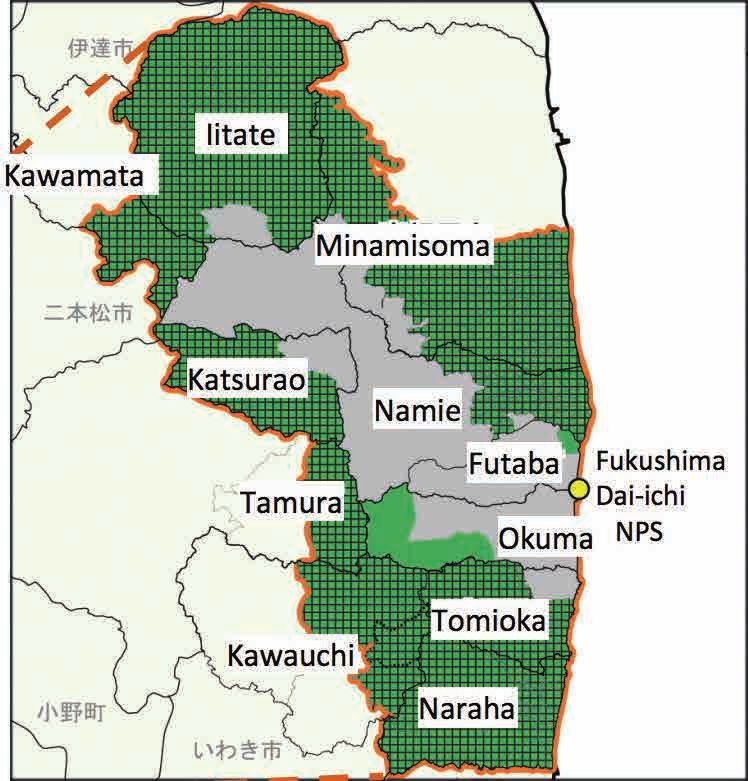
2
The decontamination
myth
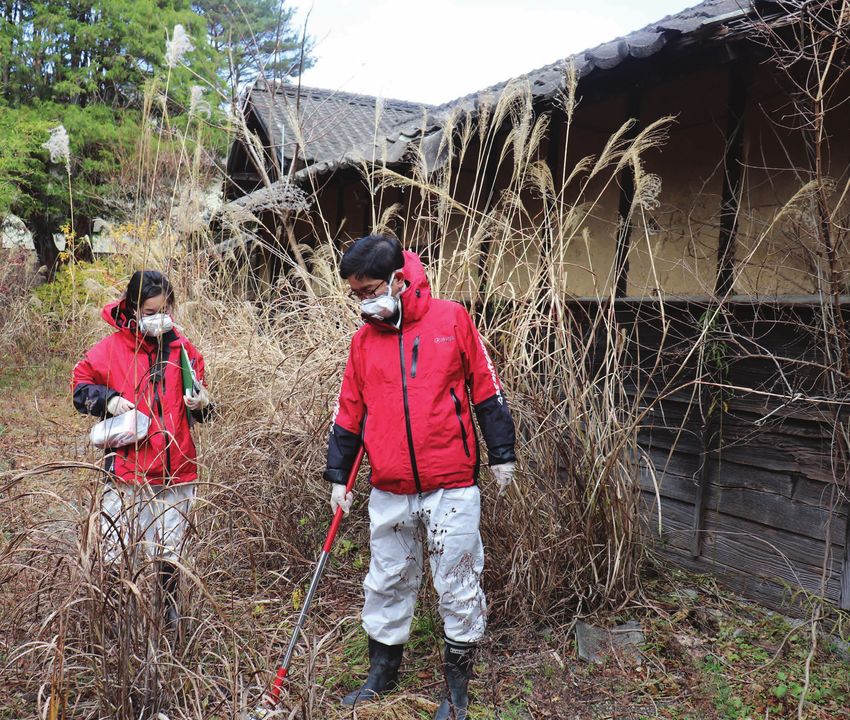
Radioactive decontamination work in Iitate,
Fukushima prefecture.
(July 15, 2015)
© Jeremy Sutton-Hibbert / Greenpeace
• Up to March 2019, the decontamination programme had cost 28 billion US dollars,
employed 30 million workers and generated 17 million tons of nuclear waste.
• The Japanese government claims that decontamination has been completed in many
areas. Yet analysis of its own data shows that approximately 15% of the land surface
area of the municipalities that make up the Special Decontamination Area (SDA) have
been decontaminated.
• The vast majority of the Fukushima SDA remains contaminated with radiocaesium.
• Mountainous, forested areas are acting as a long-term reservoir for radiocaesium and
as a large source for future recontamination of the environment beyond the forest.
09
Greenpeace | Fukushima Daiichi 2011-2021

In 2012, the Japanese government launched a                     However, these percentages refer to the specific
decontamination programme in Fukushima Prefecture               targeted land for decontamination, not the overall
(and elsewhere in Japan) that was unprecedented                 land in the municipality that is forest or farmland.
in its scale. Areas where the additional exposure
dose per year exceeded 1 mSv/y were designated                  By March 2017, most of the planned decontamination
the Intensive Contamination Survey Area (ICSA).                 programme had been completed inside the SDAs of
In these areas, municipalities take the initiative in           Fukushima. Prior to the lifting of evacuation orders
decontamination work, and they have been subject                in Namie and Iitate, the government declared
to enormous decontamination efforts, in particular              that decontamination of the district was finished
from 2012 to 2017. Areas where the additional                   and that it was safe for residents to return. The
exposure dose per year exceeded 20 mSv were                     Ministry of Environment report states: “Whole area
designated Special Decontamination Areas (SDA),                 decontamination on the Act on Special Measures was
where the national government directly conducts                 completed on March 19, 2018 except in Difficult-to-
decontamination work. They are located across                   Return Zones.”16 Japanese government documents
11 municipalities. Seven of these – Namie, Iitate,              give the very clear message that decontamination
Tomioka, Okuma, Futaba, Katsurao and Naraha, lie                is comprehensive. This extract from 2018 highlights
entirely within the SDA.                                        the approach: “Of the whole area decontamination
                                                                stipulated in the decontamination implementation
The     government       established  a     long-term           plans, regarding the decontamination under the
decontamination target level of 0.23 microsieverts              direct jurisdiction of the national government in the
per hour (0.23 µSv/h), on the basis that exposure at            SDAs, whole area decontamination was completed
this level would give an annual dose of 1 millisieverts         in Tamura City, Naraha Town, Kawauchi Village, and
every year (1 mSv/y). The level was set on the                  Okuma Town by March 2014, in Katsurao Village and
assumption that a person in the region would spend              Kawamata Town by December 2015, in Futaba Town
an average of eight hours outdoors and 16 hours                 by March 2016, in Iitate Village by December 2016, in
indoors each day throughout the year. However, this             Tomioka Town by January 2017, and in Namie Town
is an agricultural area where many inhabitants spend            and Minamisoma City by the end of March 2017, so
significantly more time outside, particularly in spring,         it was completed in all 11 municipalities by the end
summer and autumn.                                              of March 2017.”

Up to March 2019, the programme had cost 28                     The reality is very different. Using the Ministry’s own
billion dollars, employed the equivalent of 30 million          data for decontamination, it is possible to calculate
decontamination workers and generated 17 million                how much of the seven municipalities that lie
tons of nuclear waste.13 The government set out a               entirely inside the SDA have been decontaminated
target area for decontamination in each municipality.           and the amount of their area that has not been
This was expressed as a percentage of the overall               decontaminated.17
area. When it achieved its target, it reported
‘complete’ decontamination of the municipality in
question. These reports were issued in the regular
updates from the Ministry of Environment. In its July
2015 report, the Ministry stated that decontamination
had been completed in 100% of the forested areas of
Tamura, Kawauchi, Naraha and Okuma.14 In its May
2016 report, it stated that in Iitate, 86% of forest had
been decontaminated, and that it aimed to complete
decontamination by March 2017.15

                                                           10
Greenpeace | Fukushima Daiichi 2011-2021
Table 1 - Seven districts wholly inside the Fukushima Prefecture Special Decontamination Area - decontaminated and
not contaminated as of September 201718
Decontaminated – Not
Total area - Percentage Percentage Not
Districts as of 30/09/2017 Decontaminated Evacuation Order Lifted
(hectares) Decontaminated Decontaminated
(hectares) (hectares)
Namie 22,314 2,140 20,174 10 90 March 31 201719
Tomioka 6,839 1,710 5,129 25 75 April 1 201720
Iitate 23,013 4,830 18,183 21 79 March 31 201721
Futaba 5,142 133 5,009 3 97 Partial lifting 3 March 2020
Katsurao 8,437 1,355 7,082 16 84 June 12 201622
Okuma 7,871 401 7,470 5 95 Partial lifting 5 March 2020
Naraha 10,364 1,740 8,624 17 83 September 5 2015
Total 83,980 12,309 71,671 15 85
Chart 1 – Percentage of land in SDA municipalities decontaminated and not decontaminated
100%
90%
80%
70%
60%
■ Not decontaminated
50% ■ Decontaminated
40%
30%
20%
10%
0%
Namie Tomioka Iitate Futaba Katsurao Okuma Naraha
As Table 1 and Chart 1 show, the data contradicts the as the government does not provide any data on the
Japanese government’s claim that the districts in the land surface in hectares that this covers. Instead, it
SDA have been decontaminated. It’s clear that the provides the total number of houses, which in the case
vast majority have not. Out of a total area of 83,980 of the seven municipalities within the SDA amounts
hectares (840km²), only 12,309 hectares (120km²) to 16,937 as of September 2017. It’s not possible
have been decontaminated. This equates to only to say with absolute certainty what this amounts to
15% of the total area. In Namie, with a population in terms of hectares but it is not significant in terms
of over 21,000 in 2011, only 10% of the district had of the total land area of the SDA. In February 2021
been decontaminated by September 2017 – six Greenpeace requested details on the total hectarage
months after the evacuation order had been lifted for of land for houses within the SDA but was informed
the most densely populated area. At 21%, Iitate has by the Ministry of Environment that they do not have
the second highest percentage of decontaminated such data.
land. The above table does not include the land
area at each house that has been decontaminated However, in the districts where Greenpeace
11Greenpeace | Fukushima Daiichi 2011-2021
conducted survey work (Namie and Iitate), radiation also that it is entering the soil, with most retained
remains at a level unsafe for human habitation. Our in the topsoil layer to a depth of 5cm. Radioactivity
data shows that even where decontamination has deposited on the forest in the days after the accident
been conducted, radiation levels remain above those washed down to the forest floor as well as into small
seen pre-2011, and in many cases they are above the streams, with a portion washing downstream into
government’s long-term target of 0.23 µSv/hour. rivers and lakes.24 Over the longer term, radiocaesium
in the surface organic layers on the forest floor
has moved into the mineral soil, while some of the
radiocaesium in organic and mineral soil layers is
Forested areas – a source of absorbed by plant roots and transferred into trunks,
recontamination stems, and leaves above ground. The forests of Iitate,
as elsewhere in Fukushima, are acting as a long-term
The fact that 85% of the contaminated surface area of reservoir for radiocaesium and as a large source for
the seven Fukushima districts inside the SDA has not future recontamination of the environment beyond the
been subject to decontamination is directly related to forest. This contradicts the Japanese government’s
the radiological hazards posed by the mountainous claims for its decontamination programme. As we
forested areas. These remain a long-term source of have demonstrated, the Japanese government’s
contamination, including recontamination. As we claims regarding the completion of decontamination
stated in our 2016 report, Radiation Reloaded,23 the are misleading and very far from the truth.
radio-ecology, or behaviour of radioactivity, in the
mountainous forested environment of Fukushima
is highly complex. There is clear evidence that
radioactivity on the forest floor remains high, but
Map 1: Fukushima Special
Decontamination Area – SDA.
Whole area decontamination
in the SDA was completed
at the end of March 2017.
(Source: Environmental
Remediation in Affected
Areas in Japan December,
2018 Ministry of the
Environment, Japan)
123
Greenpeace
surveys
Greenpeace survey team
at Ms Kanno’s house in
Tsushima, Namie, Fuku-
shima prefecture.
(November 22, 2020)
© Greenpeace
Over the past decade, Greenpeace radiation surveys have been conducted both inside the SDA difficult-to-
return exclusion zones, as well as areas within the ICSA and SDA where evacuation orders have been lifted. Our
objective has been to answer the following questions:
• What have been the effects of decontamination on overall radiation levels in Fukushima?
• What are the radiation levels around people’s homes, both in the ICSA and SDA areas?
• How does radiocaesium behave in the environment from one year to the next?
• Is there evidence of recontamination and what are the causes?
• How do radiation levels relate to public exposure and safety?
• What is the relationship between radiation, decontamination and human rights,
including the rights of women, children and workers?
13Greenpeace | Fukushima Daiichi 2011-2021
Radiation survey methodology • In line with scientific standards, average,
minimum, and maximum measurements were
As a result of the radioactive releases from the taken for each zone. The average for all the zones
Fukushima Daiichi accident, radioactive caesium of one house and land area was then calculated
(Cs-137 and Cs-134) contributes almost all (98%) as a weighted average, with the same weight for
of the cumulative exposure. During the Fukushima each zone. This allows for comparison between
nuclear disaster, equal amounts of Cs-137 and of different years, as the number of measurement
Cs-134 were released. Due to the shorter half-life of points for each year varies. The maximum refers
Cs-134 (2 years) compared with Cs-137 (30 years), to a maximum measured single point within that
the predominant radionuclide present during recent zone.
years in Fukushima is Cs-137. Thus by 2013, as a
result of the 2-year half-life, the amount of Cs-134 In our report, when referring to potential annual
measured would be 50% of that measured in 2011. human exposure, expressed in milisieverts per year
And consequently, the decline in overall caesium (mSv/y), the estimated dose based on the Japanese
levels was relatively steep in the initial years. Without government calculation is presented, which assumes
external factors, such as weathering and other natural that citizens spend an average of 8 hours per day
systems, as well as human disturbance, the 30-year outside and takes account of shielding from radiation
half-life of Cs-137 means that the Cs-137 levels in the while inside a wooden house. This is considered a
environment should remain relatively constant with a likely underestimate due to many citizens in rural areas
slow decline over the decades. spending more than 8 hours per dayoutside. As in all
previous reports on house surveys in Fukushima, a
The Greenpeace radiation team has used different Greenpeace calculation of annual human dose rates
methods for survey work over the years. has been included, based on radiation measurements
taken at 1 meter, and represent an adult’s exposure
Systematic measurements were taken using the over one full year (a total of 8,760 hours) at that
following methodology: specific location.
• Ambient dose rates were measured at one metre
(m) height with a highly-efficient and calibrated
NaI scintillator (Georadis RT30: 2000 cps/µSv.h-1
(Cs-137)) with one measurement each second.
• Measurements were taken by walking in a
systematic way, where possible in a grid pattern,
without searching for hotspots.
• Measurements were taken around individual
houses, with the permission of the owners. The
area around each house was divided into zones,
generally between 5-10, with fewer zones when
measuring along rivers or other property. The
zones often comprise for example, fields, paths,
and forested areas. Each zone was measured
separately, with a minimum of 100 measurement
points per zone and a median range of 200-300
points per zone. The total radiation measurement
points for each house and land area typically
ranged between 3,000 and 5,000 points.
14Greenpeace | Fukushima Daiichi 2011-2021
4
Areas where evacuation
orders have been lifted
– Iitate and Namie
On 31 March 2017, the Japanese government lifted majority of the population formerly lived. Both in Iitate
the evacuation orders for areas in Iitate Village and and in the area of Namie (where the evacuation order
Namie Town, which lie north and north-west of the was lifted), radiation levels over the years remained
Fukushima Daiichi nuclear plant. This did not include significantly higher than the government’s current
the most contaminated areas in these districts, which long-term target level of 0.23 µSv/h.
are designated difficult-to-return areas.
This means that, in some cases, radiation exposure
Greenpeace conducted its first radiation surveys for people returning to Iitate and Namie will be well
in the municipalities of Namie and Iitate in March in excess of the recommended annual maximum
2011, and subsequent surveys in these areas and of 1mSv. The Japanese government maintains that
others during 2012-2020. Returning to Iitate in 2015, exposure up to 20 mSv/y is acceptable in the areas
we began a series of systematic house surveys, where evacuation orders have been lifted. This is
revisiting the locations each year subsequently. In despite clear scientific evidence of increased cancer
September 2017, Greenpeace extended its survey risks from low dose radiation exposure in the 1-5
work to the central area of Namie Town, where the mSv/y range.25
Contaminated Streets in Namie Town
(June 1, 2014)
© Robert Knoth / Greenpeace
155
Iitate district
Toru Anzai in his home town,
Iitate, Fukushima prefecture.
(November 21, 2020)
© Greenpeace
The administrative district of Iitate, also referred to benchmark of 40kBq/m² for contaminated land.
as Iitate village, is located in the Hamadori region of Radioactive fallout from the Fukushima nuclear plant,
Fukushima Prefecture and lies between 28km and particularly iodine-131 and 133 (I-131 and I-133) and
47km from the Fukushima Daiichi nuclear power caesium-134 and 137 (Cs-134 and Cs-137) were
plant.26 Iitate was particularly affected by radioactive deposited on the forests, farmland and homes of
releases from the disaster on the nights of 15 and Iitate. Of most concern as of today and into the future
16 March 2011 due to weather patterns that carried is radiocaesium, particularly Cs-137, which has a half-
radioactivity north-west from the nuclear power life of 30 years. This means that it will remain a hazard
plant.27 According to the International Atomic Energy for around ten half-lives – or 300 years.29 In addition
Agency (IAEA) Summary Fukushima Report, very to radiocaesium, other radionuclides of concern to
high levels of radioactive caesium were deposited public health were deposited here. Sample testing of
north-west of the reactor site, with densities between black dust collected from roadsides and soil samples
1,000 kBq (kilobequerels) per m² and 10,000 kBq/m². throughout Fukushima prefecture, including in Iitate,
The IAEA reports an average deposition density for showed transuranic contaminants (radioactive
caesium-137 throughout Fukushima Prefecture of elements with atomic numbers greater than that of
100 kBq/m².28 These numbers far exceed the IAEA’s uranium30) sharing the same profile as the fuel core.31
16Greenpeace | Fukushima Daiichi 2011-2021
Population impact
Out of a population of 6,509 on 11 March 2011, over 1,000 residents were still living in Iitate two months after the
evacuation order in June 2011 and despite high radiation levels. Citizens in Iitate were as a result and they were
the most exposed to radiation of any population in Japan.32 Along with other areas of Fukushima prefecture,
Iitate was designated for radioactive decontamination in 2012.33
On 31 March 2017, the evacuation order for most of Iitate was lifted and by 1 December 2020, 1,255 had
returned – 19% of the population in March 2011.34 Thousands of citizens are still displaced from their former
homes.35 The government of Shinzo Abe, elected in December 2012, was particularly determined to coerce
the people of the district. It is well outside the 20km radius of the Fukushima Daiichi plant, and the radioactive
contamination present in Iitate is a constant reminder to the people of Japan that the impacts of a severe nuclear
accident cannot be limited to a small area around reactor sites.
Investigations at the home of Mr Toru Anzai
Since 2011, Greenpeace has conducted Diagram 1: Schematic of Mr. Anzai’s house in Iitate,
10 radiation surveys in Iitate district, showing the designated Zones for the Greenpeace
radiation survey team.
and from July 2015 we have focused
particularly on investigations at the
homes of citizens, one of which is the Inside house
< 1.5 and > = 1μSv/h
home of Toru Anzai. Forest behind house < 1 and > = 0.5μSv/h
Under the roof of house < 0.5 and > = 0.23μSv/h
Field up and
It is located in the south-east of Iitate, 35 left of house
Path right of Zone 12 is not measured in 2020
the house
km from the nuclear power plant. Mr Anzai
11 Front and sides of house
was evacuated from his home on 24 June
5 Field with former greenhouse
2011, and his house and the surrounding
12 3 Field
area were subjected to extensive 4
2
decontamination by the authorities
during 2014 and 2015. This involved 1 7 10 Road on both sides
scraping away a layer of more than 5cm 6
Rice field
of topsoil, which was then removed other side of road
from the site and stored as radioactive 9 8
waste. In some cases, the surface was
covered with uncontaminated soil. The Road to house
main structure of Mr Anzai’s house was Field at road
demolished in 2018. The survey results
from the house between 2015 and 2020
are shown in Table 2 and Chart 2.
17Greenpeace | Fukushima Daiichi 2011-2021
When the Greenpeace team first accurately mapped the radiation levels in the area of Mr Anzai's house in
October 2015, official decontamination work was still in progress. The 2016 survey found a significant decrease
in radiation levels, which we concluded was a combined effect of further decontamination, decay and erosion.
In October 2019, we found a 29% decline from 2018 in the overall average radiation level for all zones measured
(0.7 µSv/h to 0.5 µSv/h) and this remained stable at 0.5 µSv/h in 2020. However, the average measurement of
11 zones still exceeded the government target of 0.23 µSv/h.
Table 2 - Mr Anzai’s house, Iitate: dose rates in all zones 2015 – 2020
(Measurements taken walking on- and off-road, height: 1m)
Maximum levels measured also showed a decline between 2018 and 2019 (1.7 µSv/h to 1.3 µSv/h, or 24%).
However, in 2020 the maximum level measured increased to 1.5 µSv/h.
After the completion of decontamination in 2015, radiation levels at Mr Anzai’s property mostly remained stable
in 2016-2018, but with some indications of recontamination. The significant decline in radiation levels measured
in 2019 cannot be explained by radioactive decay alone and was perhaps due to the heavy rainfall resulting from
Typhoon Hagibis, which struck Japan in October 2019. One of our principal objectives in 2020 was to return to
Mr Anzai’s land and to investigate further the impact of heavy rainfall on radiocaesium in the forested mountains.
18Greenpeace | Fukushima Daiichi 2011-2021
Chart 2 - Mr Anzai’s house: Radiation survey, Zones 1-11, 2015-2020
■ 2015
■ 2016
■ 2017
■ 2018
■ 2019
■ 2020
Front and Field up Forest Rice field
Path to Under roof Field near Road on Path right
sides of and left of behind Field low Field high other side
house of house road both sides of house
house house house of road
Zone-01 Zone-02 Zone-03 Zone-04 Zone-05 Zone-06 Zone-07 Zone-08 Zone-09 Zone-10 Zone-11
■ 2015 1.1 0.6 0.7 1.9 1.4 1.2 1.4 1.4
■ 2016 0.6 0.4 0.4 1.1 1.0 0.8 0.8 0.3 1.0 0.6 1.0
■ 2017 0.6 0.4 0.4 1.1 0.9 0.8 0.8 0.5 1.0 0.7 1.1
■ 2018 0.5 0.4 0.4 1.0 1.0 0.6 0.7
■ 2019 0.4 0.3 0.3 0.7 0.9 0.5 0.4 0.6 0.5 0.7
■ 2020 0.4 0.3 0.3 0.8 0.8 0.3 0.3 0.3 0.6 0.5 0.5
In earlier years, the survey showed that decontamination efforts had been much less effective in the forested
area in Zone 5 of Mr Anzai’s property. As is standard government practice, an area up to 20 metres from Mr.
Anzai’s house into the forest has been ‘decontaminated’. In November 2020, radiation levels in Zone 5 were still
an average of 0.8 µSv/h and a maximum of 1.4 µSv/h. The radiation levels on the steep slopes close to houses
are crucial as they have a direct impact on the levels inside the houses. We can also expect that radioactivity
from the non-decontaminated forest might recontaminate the already decontaminated area below and closer to
houses. Many houses in Iitate also located close to hillside forests where decontamination is not possible, were
similarly affected.
Chart 3 - Mr Anzai’s house: Radiation survey, Zones 2, 3 and 5, 2015-2020
■ 2015
■ 2016
■ 2017
■ 2018
■ 2019
■ 2020
Front and sides of house Under roof of house Forest behind house
Zone-02 Zone-03 Zone-05
■ 2015 0.6 0.7 1.4
■ 2016 0.4 0.4 1.0
■ 2017 0.4 0.4 0.9
■ 2018 0.4 0.4 1.0
■ 2019 0.3 0.3 0.9
■ 2020 0.3 0.3 0.8
19Greenpeace | Fukushima Daiichi 2011-2021
The data (see Chart 3) from Zones 2 and 3 show that the average radiation levels have remained the same
between 2019 and 2020, whereas there has been a decline in the steeply sloping, forested area of Zone 5.
It’s possible that the radiation levels in these lower zones are maintained through migration from the forested
slopes, which continue to leach radiation. Zone 5, where decontamination was more limited, remained the zone
with the highest average levels, along with Zone 4, in all previous years.
Chart 4 - Mr Anzai’s house: Radiation Survey, Zones 1-7, 2015-2020
■ 2015
■ 2016
■ 2017
■ 2018
■ 2019
■ 2020
Front and sides of Under roof of Field up and left of Forest behind
Path to house Field low Field high
house house house house
Zone-01 Zone-02 Zone-03 Zone-04 Zone-05 Zone-06 Zone-07
■ 2015 1.1 0.6 0.7 1.9 1.4 1.2
■ 2016 0.6 0.4 0.4 1.1 1.0 0.8 0.8
■ 2017 0.6 0.4 0.4 1.1 0.9 0.8 0.8
■ 2018 0.5 0.4 0.4 1.0 1.0 0.6 0.7
■ 2019 0.4 0.3 0.3 0.7 0.9 0.5 0.4
■ 2020 0.4 0.3 0.3 0.8 0.8 0.3 0.3
The decline in radiation levels measured between 2018 and 2019 in all zones is likely to be due to weathering
effects due to typhoon Hagabis passing shortly before the 2019 survey. In Zone 5, there was a significant
reduction of measurement points exceeding 1 µSv/h between 2018 and 2019. In terms of percentages, there
was a decline from 65% of all points in 2018 exceeding 1 µSv/h to 21% in 2019. The most noticeable decline in
levels between 2018 and 2019 was in Zones 2, 4 and 7.
Radiation levels rose again in 2020 in Zone 4. In November 2020, we measured a 15% increase in average
levels in Zone 4 with a decrease of 30% in Zone 7 (Table 2). The most noticeable decline in levels between 2018
and 2019 was in Zones 4 and 7. Radiation levels rose again in 2020 in Zone 4. There is no conclusive evidence
that the observations can be explained by weathering effects. The observations highlight the complexity of the
radioactive environment in Fukushima.
20Greenpeace | Fukushima Daiichi 2011-2021
Table 3 - Mr Anzai’s house: Radiation measurements all zones , November 2020
(Measurements taken walking on- and off-road, height: 1m)
In 2020, five of the zones at Mr Anzai’s home all exceeded the Japanese government’s long-term decontamination
target of 0.23 µSv/h. Across all measured points (Table 3), 85% of points exceeded the 1 mSv/y dose rate
according to Japanese government calculation methods and 2 mSv/y based on sustained exposure over one
full year.36 Decontamination of Mr Anzai’s land was completed in 2015, and yet nearly six years later radiation
levels remain well in excess of the Japanese government’s decontamination targets of 0.23 µSv/h. For 42%
of the area at Mr. Anzai’s land, dose rates would be in excess of 3 mSv/y based on Japanese government
methodology, and 4 mSv/y based on sustained exposure over one full year. As measured in 2020, in 5% of
the area around Mr Anzai’s property radiation exposure would be in excess of 5 mSv/y based on Japanese
government methodology, and 8 mSv/y based on sustained exposure over one full year.
Ten years after being forced from his home, Mr Toru Anzai remains an evacuee from his ancestral land in Iitate. In
85% of the land measured around Mr Anzai’s former home, radiation levels continue to exceed the International
Commission on Radiological Protection (ICRP) maximum recommended dose rate of 1 mSv a year for the
public.37
216
Namie town
and district Takase river in Namie, Fukushima prefecture.
(October 29, 2019)
© Christian Åslund / Greenpeace
The municipality of Namie lies 5-30 km north-northwest Namie kindergarten and school
of the nuclear plant. In 2011 it had a population of
21,434.38 A decontamination programme was run in Greenpeace Japan has conducted a radiation
the district from 2014 up to the lifting of evacuation survey at a kindergarten and school in the open area
orders in March 2017. However, in areas surveyed of Namie every year since 2017, most recently in
by Greenpeace since 2017, this decontamination November 2020. In particular, we have investigated
has clearly failed to reduce radiation levels to the radiation levels in a small, forested area adjacent to
government’s current long-term target of 0.23 the school. While it’s unlikely that these schools will
µSv/h. An area of Namie is designated a “Difficult to ever open again, they remain accessible to people
Return” exclusion zone and remains closed to human living in Namie town.
settlement. As with the other such zones, a limited
decontamination programme remains underway as
of March 2021.
22Greenpeace | Fukushima Daiichi 2011-2021
Table 4 - Kindergarten and school in open area of Namie: dose rates in all zones, 2017-2020
(Measurements taken walking on- and off-road, height: 1m)
As Table 4 and Chart 5 show, radiation levels have remained relatively stable over the four years. This suggests
they are likely to remain fairly constant in the future, with reductions reflecting the radioactive decay of Cs-137.
Chart 5 - Kindergarten and school in open area of Namie: Radiation survey, 2017-2020
2.0
1.8
1.6
1.4
1.2
μSv/h
1.0 ■ 2017
■ 2018
0.8 ■ 2019
■ 2020
0.6
0.4
0.2
0.0
Forest in front of school Road in front of school
Zone-01 Zone-02
■ 2017 1.9 0.5
■ 2018 1.8 0.4
■ 2019 1.6 0.5
■ 2020 1.6 0.4
In Zone 1, all of the 822 points measured in 2020 in the forested area remained above the 0.23 µSv/h target set
by the Japanese government, and 88% measured above 1 µSv/h. In Zone 2, three years after decontamination
was completed and evacuation orders were lifted in 2017, 93% of all data points measured in the area directly
outside the kindergarten and school, remain above the 0.23 µSv/h target. There has been fluctuation in radiation
levels in both zones, with a decline observed in Zone 1 and an increase in Zone 2 in 2019 (compared to 2017
and 2018). This could be a result of radioactivity being washed down from the forest onto the road by typhoon
Hagidis, which took place days before the survey. Given that Zone 2 consists largely of hard road and pavement
surface, the decrease in radioactivity on the road in front of the school, measured in 2020, can be explained by
23Greenpeace | Fukushima Daiichi 2011-2021
radioactivity being washed off of hard surfaces over the course of time. An increase in radioactivity observed in
the forest area in 2020, could be caused by the resuspension of radioactivity from higher up the sloping hillside
or through other routes of migration of radioactive materials.39
It is clear that both average and maximum radiation levels in both zones remain much too high for an area
declared open for human settlement, let alone a place where children are likely to gather.
Table 5 - Forested area adjacent to kindergarten and school, Namie: Radiation, Zone 1, November 2020
(Measurements taken walking on- and off-road, height: 1m)
In 33% of the forested area adjacent to the school (Zone 1), the annual dose would be 8-10 mSv according to
the government’s method of calculation and 13-17 mSv based on sustained exposure over a full year. For 29%
of the area, these figures would be 10-20 mSv/y and 17-33 mSv/y respectively. Of the 822 data points for Zone
1, no point measured below a level that would give a dose of 1 mSv/y.
Takase river
The Takase river, which flows through Namie district, divides the publicly open area and the 'difficult-to-return'
area that remains an exclusion zone. In an area where the evacuation order was lifted in March 2017, the
Greenpeace experts took measurements near the hamlet of Tawatsuda in 2018, 2019 and 2020. As with all the
rivers of Fukushima, the Takase river experienced major flooding in October 2019, less than a week before the
Greenpeace survey. This led to a large flux of radioactivity moving through the waters of the prefecture. It is worth
noting that the Takase river passes through Obori Village, which lies directly upstream from the surveyed area and
is one of the most contaminated areas in the Namie exclusion zone.
24Greenpeace | Fukushima Daiichi 2011-2021
As Table 6 shows, radiation levels in this area are consistently above the Japanese government’s 0.23 µSv/h long-
term target. After 2018, it was not possible to accurately measure Zone 2 due to deforestation and reconstruction
work being underway. Instead, we measured along a slope by the bank of the river in 2019 and 2020.
Table 6 - Takase river in open area of Namie: dose rates in all zones, 2018-2020
(Measurements taken walking on- and off-road, height: 1m)
In Zone 1 of the Takase river survey (the path along the river), average radiation levels were higher in 2019 (1.1
µSv/h) compared to 2020 (0.6 µSv/h) and 2018 (0.7 µSv/h). This could be caused by flooding due to the typhoon.
The maximum measurement of 3 µSv/h in 2019 and the return to 1.5 µSv/h in 2020 is further indication of such
external influence.
Table 7 - Takase river, Namie: Radiation on path along river, Zone 1, November 2020
(Measurements taken walking on- and off-road, height: 1m)
In 70% of the area measured in Zone 1, radiation levels would give an annual dose of 3-5 mSv/year based on
Japanese government calculation methods and 4-8 mSv based on full exposure over one year.
25Greenpeace | Fukushima Daiichi 2011-2021
Greenpeace survey team,
Takase river in Namie,
Fukushima prefecture.
(November 21, 2020)
© Greenpeace
Along the riverbank in Zone 3, where we measured 1,334 data points in 2020, levels averaged 1 µSv/h, the same
as in 2019, with a maximum of 2 µSv/h, up from 1.7 µSv/h in 2019. All average measurements exceeded the
government’s long-term decontamination target and average radiation levels are 20 times higher than the pre-
2011 background level of 0.04 µSv/h.
Table 8 – Takase river, Namie: Radiation along river bank, Zone 3, November 2020
(Measurements taken walking on- and off-road, height: 1m)
The 2020 survey shows that in 50% of the area along the Takase riverbank slope in the publicly accessible area
of Namie Town, radiation levels would give an annual radiation dose of 5-8 mSv/year based on government
calculation methods and 8-13 mSv based on full exposure over one year.
267
Namie ‘difficult-
to-return’
exclusion zone The house of Ms Kanno in Tsushima,
Namie, Fukushima prefecture.
(November 22, 2020)
© Greenpeace
Investigations at the house of Ms Kanno < = 2 and > =1.5μSv/h
< 1.5 and > =1 μSv/h
< 1 and > = 0.5μSv/h
The home of Ms Kanno is located in Shimo-Tsushima
9 < 0.5 and > = 0.23μSv/h
in the district of Namie, 30 km west-north-west of Zone 6 is not measured in 2020
the nuclear plant. It was subjected to significant
Rice field
radioactive contamination resulting from the March North
2011 accident and remains inside the Namie
6 9
'difficult-to-return' exclusion zone. The house is 5
surrounded on three sides by forest, which has grown Forest behind
extensively since 2011. The Japanese government house
selected Ms Kanno’s house to demonstrate its
Path to rice field
decontamination techniques and her home was the North
focus of considerable efforts during December 2011
Farmland
and February 2012.
1 4
Around house 2
3
Diagram2: Schematic of Ms Kanno’s Garden and farmland
house in Shimo-Tsushima, Namie 8 Around
warehouse
exclusion zone, Fukushima Prefecture, 7 and path
showing the designated Zones for the
Road
Greenpeace radiation survey team. Rice field, South
27Greenpeace | Fukushima Daiichi 2011-2021
Greenpeace conducted its first radiation survey at the home in September 2017, with follow-up surveys in
October 2018, October 2019 and November 2020. In each of the surveys, we focused on the immediate area
around the house, as well as on the family’s farmland and forest.
Table 9 – Ms Kanno’s house: Dose rates in all zones, 2017-2020
(Measurements taken walking on- and off-road, height: 1m)
In 2019, we found that the weighted average recorded was 0.9 µSv/h for the seven zones measured (Table
9). This 15% reduction in the weighted average levels compared to 2018, led Greenpeace to conclude that
significant variations cannot be explained by radioactive decay or by further official decontamination. Our 2020
survey shows an increase in radiation levels in four zones measured; in two zones the levels remained constant,
and only in zone 3 (garden next to path) a decline is observed compared to 2019.
For four zones (Chart 6), we have complete data sets covering 2017-2020. From 2018 to 2019, we measured
a reduction of the average levels, compared with a zero reduction between 2017 and 2018. One possible
explanation for this may be the small amount of rainfall compared to that which resulted from Typhoon Hagibis
in 2019.
28Greenpeace | Fukushima Daiichi 2011-2021
Chart 6 - Ms Kanno’s house: Average dose rates measured in four zones, November 2020
■ 2017
■ 2018
■ 2019
■ 2020
Around house Farmland right of house Forest behind house Path
Zone-01 Zone-04 Zone-05 Zone-09
■ 2017 0.7 0.9 1.9 1.7
■ 2018 0.6 0.8 1.4 1.7
■ 2019 0.5 0.6 1.5 1.1
■ 2020 0.5 0.7 1.9 1.3
Chart 7 - Ms Kanno’s house: Maximum dose rates measured in four zones, November 2020
■ 2017
■ 2018
■ 2019
■ 2020
Around house Farmland right of house Forest behind house Path
Zone-01 Zone-04 Zone-05 Zone-09
■ 2017 1.3 1.2 2.8 5.8
■ 2018 0.9 1.3 2.4 5.9
■ 2019 0.8 0.9 2.2 2.1
■ 2020 0.9 1.0 2.5 2.7
29Greenpeace | Fukushima Daiichi 2011-2021
In Zones 1, 4, 5 and 9 (see Charts 6 and 7), there has been an increase in measured radiation between 2019
and 2020. Average levels in Zone 9 increased from 1.1 µSv/h in 2019 to 1.3 µSv/h in 2020, and maximum levels
increased from 2.1 µSv/h to 2.7 µSv/h. Zones 1, 4 and 9 saw a dip in 2019, compared to 2018 levels, while Zone
5 (forest behind the house) shows an increase in average levels.
In Zone 5, radiation levels increased, from 1.5 µSv/h to 1.9 µSv/h, between 2019 and 2020. This area lies at the
bottom of a gently sloping hillside. In Zone 9, the path leading up the hillside to a former rice field, there was a
reduction in radiation levels between 2018 and 2019 (1.7 µSv/h to 1.1 µSv/h). This was followed by a rise to 1.3
µSv/h in 2020.
The observations may indicate migration of caesium contamination following Typhoon Hagibis in October 2019,
and possible re-contamination of some of the areas over the course of 2020. Radiation levels seem to decline
after heavy rainfall but settle over the following months and, through slow migration, return to prior levels. This
underscores the complexity of the behaviour of radiocaesium in the environment.
Table 10 – Radiation in all zones at Ms Kanno house, Namie November 2020
(Measurements taken walking on- and off-road, height: 1m)
Annual radiation dose rates for 98% of the areas measured at Ms Kanno’s house (Table 10) exceed the
International Commission on Radiological Protection (ICRP) recommended annual maximum exposure level of
1 mSv.40 For 70% of the area measured, dose rates could lead to an exposure of between 3 and 5 mSv/y based
on the government calculation method and 4 mSv/y or more based on sustained exposure over one full year.
98% of measuring points exceeded the government’s current long-term target level of 0.23 µSv/h.
308
Strontium-90
– an additional
threat Jan Vande Putte, Greenpeace Belgium collecting pine
needle samples in Okuma, Fukushima prefecture.
(October 16, 2018)
© Shaun Burnie / Greenpeace
Radioactive strontium-90 (Sr-90) is one of the most and investment in laboratory analysis compared with,
hazardous radionuclides produced by the fission for example, radiocaesium. As a result, Sr-90 remains
process in both nuclear weapons explosions and in one of the least studied of the radionuclides released
commercial nuclear reactors. Enormous amounts of from Fukushima Daiichi.
Sr-90 remain at the Fukushima Daiichi nuclear plant in
both the molten fuel cores and in contaminated water. In 2011, the Japanese government’s Ministry of
Preventing further releases into the environment is Education, Culture, Sports, Science and Technology
one of the greatest challenges. (MEXT) conducted a radiation monitoring survey at
55 sampling sites around Fukushima Prefecture.44
In the environment, Sr-90 behaves in a similar way Sampling reported by MEXT in 2012 for Sr-90 in soil
to calcium, being absorbed by plants, animals and showed a statistically significant difference to levels
humans through ingestion of contaminated food measured prior to the accident. The results measured
or water and, to a much smaller extent, through Sr-90 that was a legacy of nuclear weapons testing,
inhalation. Around 70–80% of Sr-90 is excreted, with but also as a result of releases from the Fukushima
the rest deposited in bones and bone marrow, and Daiichi accident. Rather than conducting large-
a very small amount (around 1%) in blood and soft scale and expensive Sr-90 laboratory analysis, the
tissues.41 Sr-90 has a half life of 29 years. In the human Japanese authorities have relied on Cs-137 analysis
body, it has a biological half-life (the time required for and the assumption of a constant ratio with Sr-90.
an amount to reduce to half of its original value) of 18 This has been the basis on which the government
years.42 Its presence can cause cancer of the bone, has estimated risks from Sr-90 released from
bone marrow and of nearby tissues.43 Identifying Sr- Fukushima Daiichi, including the dose delivered to
90 contamination in samples requires significant time the human population. However, the assumed ratio
31You can also read