FULL YEAR RESULTS 2017 - NAB

Page created by Pedro Frazier
 
CONTINUE READING
FULL YEAR RESULTS 2017 - NAB
Investor Presentation
                                                                      FULL YEAR                                           2 November 2017

                                                                      RESULTS                                             Andrew Thorburn
                                                                                                                          Chief Executive Officer

                                                                      2017                                                Gary Lennon
                                                                                                                          Chief Financial Officer

Sarah and Justin Montesalvo
Patriot Campers
© 2017 National Australia Bank Limited ABN 12 004 044 937 (NAB or the Company). NAB Group is NAB and its controlled entities.
FULL YEAR RESULTS 2017 - NAB
NAB 2017 FULL YEAR INDEX
This presentation is general background information about NAB. It is intended to be used by a professional analyst audience and is not intended to be relied upon as
financial advice. Refer to page 157 for legal disclaimer.
Financial information in this presentation is based on cash earnings, which is not a statutory financial measure. Refer to page 152 for definition and reconciliation to
statutory net profit/loss.

 Overview                                                                                                                                                                   3
 FY17 Financials                                                                                                                                                           10
 Accelerating Our Strategy                                                                                                                                                 22
 Additional Information                                                                                                                                                    33
    Australian Customers                                                                                                                                                   33
    Digital For Customers                                                                                                                                                  43
    Serving Our Community                                                                                                                                                  57
    Australian Products                                                                                                                                                    70
           – Business Lending                                                                                                                                              72
           – Housing Lending                                                                                                                                               73
           – Other                                                                                                                                                         80
    New Zealand Banking                                                                                                                                                    87
    Asset Quality                                                                                                                                                          94
    Capital & Funding                                                                                                                                                      124
    Economic Outlook                                                                                                                                                       134
    Group Margin & Earnings Reconciliation                                                                                                                                 150
    Glossary                                                                                                                                                               153

    OVERVIEW

    ANDREW THORBURN
    Chief Executive Officer
FULL YEAR RESULTS 2017 - NAB
IMPROVING TRENDS
    FY17 v FY161
    Cash earnings ($m)2                                                                                                                    6,642                                               2.5 %

    Cash EPS (cps - diluted)                                                                                                               239.7                                                   4.4c

    Dividend (cps)                                                                                                                           198                                                   flat

    Cash ROE                                                                                                                              14.0%                                               30 bps

    Statutory profit ($m)                                                                                                                  5,285                                               large

    CET1                                                                                                                                  10.1%                                               29 bps

    (1) Information is presented on a continuing operations basis including prior period restatements, unless otherwise stated
    (2) Refer to page 152 for definition of cash earnings and reconciliation to statutory net profit

4

ALL CUSTOMER BUSINESSES CONTRIBUTING
    CASH EARNINGS1 AND UNDERLYING PROFIT2 GROWTH (LOCAL CURRENCY) FY17 v FY16
            Consumer Banking                                       Business & Private                                        Corporate &                                              NZ Banking
                & Wealth                                                Banking                                         Institutional Banking

                                                                                                                                                  12.3%

                                                                                                                                                                                               8.9%

                                                                    7.0%
                                                                                         6.3%

                                                                                                                                                                                    4.6%
                                      4.3%

                  2.9%
                                                                                                                          2.7%

                                                               Underlying Profit                                                 Cash Earnings

    (1) Refer to page 152 for definition of cash earnings and reconciliation to statutory net profit
    (2) Underlying profit represents cash earnings before various items, including tax expense and the charge for bad and doubtful debts. It is not a statutory financial measure

5
FULL YEAR RESULTS 2017 - NAB
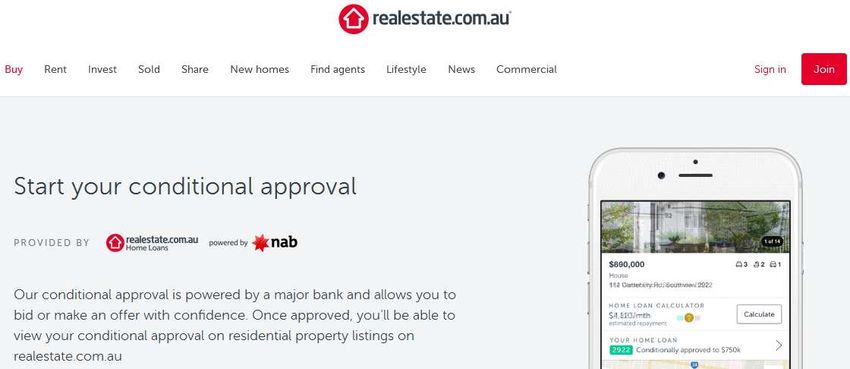
DELIVERING BETTER RETURNS
    CASH ROE v PEER AVERAGE (EX SPECIFIED ITEMS)1
                       16.8%
                                                                               15.9%

                                                                                                                                       14.3%
                        15.0%                                                                                                                                                     14.0%
                                                                                                                                       14.2%
                                                                               13.8%                                                                                               14.0%

                        Sep 14                                                 Sep 15                                                 Sep 16                                       Sep 17
                                                                                                   NAB            Peer Average

    CASH EARNINGS TO RWA BY DIVISION

                                                                                                                                                                    1.60%            1.59%              1.68%
                                                                2.50%            2.45%             2.62%
        2.40%                                                                                                                          1.30%            1.30%
                          1.92%             2.06%                                                                      1.10%

        2H16              1H17               2H17                2H16             1H17             2H17                2H16             1H17            2H17        2H16             1H17               2H17

                       Consumer Banking                                 Business & Private Banking                        Corporate & Institutional Banking                        NZ Banking

    (1) NAB ROE for September 2014 and September 2015 are as reported (excluding specified items), i.e. includes CYBG and 100% of NAB Wealth’s life insurance business. NAB ROE for September 2016 is
        on a continuing operations basis. September 2015 and September 2016 peer average ROE excludes specified items for ANZ. September 2017 peer average ROE is based on last reported peer result
        for ANZ, CBA and WBC

6

EARNING COMMUNITY RESPECT
    HELPING AUSTRALIANS WHEN THEY MOST NEED IT                                                                        MAKING BANKING EASIER AND FAIRER
    •    14-year partnership with Good Shepherd Microfinance                                                      •     Plain English contracts and communications for Small Business
                                                                                                                        launched October 2017
    •    Provided $212m low and no interest loans to support over 500,000
         people since 2005                                                                                        •     Proactively contacting customers with SMS alerts (up to 500,000 in
                                                                                                                        an average month) to remind them that their payment is due and
    •    Aim to quadruple our support to 100,000 loans annually by
                                                                                                                        helping them avoid late payment fees
         2019
                                                                                                                  •     Simple terms & conditions to be rolled out to other business
                                                                                                                        products and documents

    SUPPORTING CUSTOMERS IN HARDSHIP                                                                                  CONTRIBUTING TO THE COMMUNITIES WE OPERATE IN
    •     Specialist team NAB Assist for customers in financial difficulty                                         •     $1.4 million of grants made by NAB Foundation to support
                                                                                                                         domestic and family violence prevention and intervention
    •     90% of NAB Assist customers back on track with repayments
          within 30 days                                                                                           •     100+ employment opportunities in 2017 through Indigenous
                                                                                                                         Employment and African-Australian Inclusion Programs
    •     Goal to continue to have the lowest number of complaints
          referred to Financial Ombudsman Service1                                                                 •     16,115 volunteer days in FY17 – ambition to increase the
                                                                                                                         number of days in Australia by 50% in FY18
                Number of customers provided with hardship assistance

                         20,174                     21,303                  19,652

                          FY15                      FY16                     FY17

    (1) Refers to lowest absolute number of financial difficulty complaints of the four major Australian banks accepted by the Financial Ombudsman Service

7
FULL YEAR RESULTS 2017 - NAB
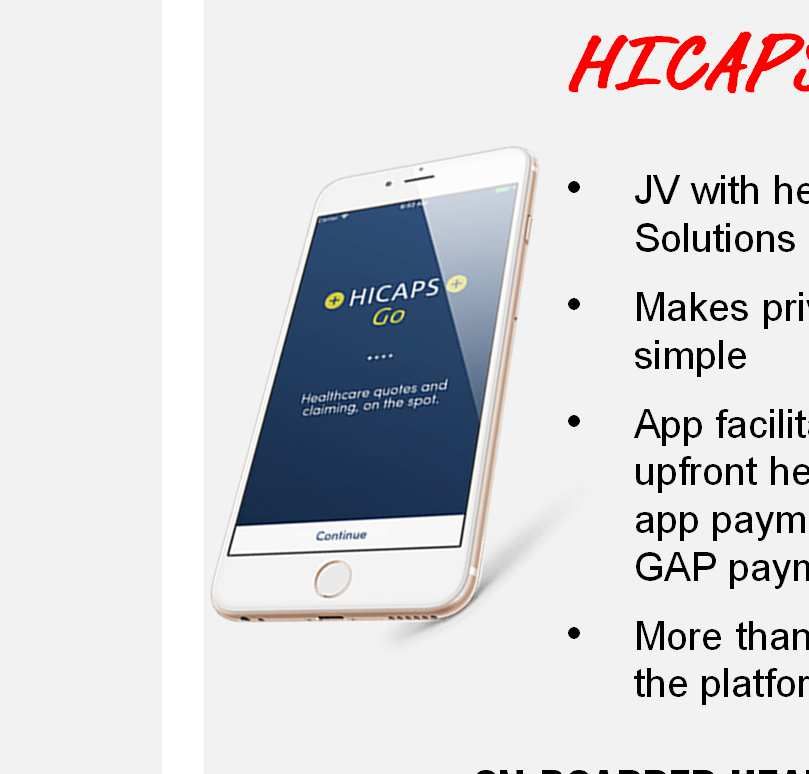
CUSTOMER FOCUS LEADING TO IMPROVED NPS1
    OVERVIEW                                                                                                          BRANCH INTERACTION NPS5
                                                                                                                           55
    • #1 in Priority Segments NPS2                                                                                                                                                                                               51
                                                                                                                           50

    • #1 and positive score for Medium Business customers3,4                                                               45

    • Branch interaction NPS5 now +51                                                                                      40

                                                                                                                           35
    • More than 200 pain points eliminated for customers
                                                                                                                           30
                                                                                                                                Sep       Oct   Nov    Dec    Jan    Feb     Mar     Apr     May   Jun       Jul      Aug    Sep
                                                                                                                                 16       16     16     16     17     17     17      17      17     17       17        17     17

    FY17 PRIORITY SEGMENTS NPS2                                                                                       MEDIUM BUSINESS NPS3
      -5                                                                                                                10

                                                                                                                                                                                                                                 +3
    -10                                                                                                                    0
                                                                                                           -13
                                                                                                           -14                                                                                                                    -5
    -15
                                                                                                           -14         -10                                                                                                        -6
    -20                                                                                                    -20                                                                                                                   -14

                                                                                                                       -20
    -25

    -30                                                                                                                -30
            Sep Dec Mar Jun Sep Dec Mar Jun Sep Dec Mar Jun Sep Dec Mar Jun Sep                                                 Sep Dec Mar Jun Sep Dec Mar Jun Sep Dec Mar Jun Sep Dec Mar Jun Sep
             13 13 14 14 14 14 15 15 15 15 16 16 16 16 17 17 17                                                                  13 13 14 14 14 14 15 15 15 15 16 16 16 16 17 17 17

                      NAB                   Peer 1                   Peer 2                  Peer 3                                             NAB           Peer 1               Peer 2              Peer 3
    (1)    Net Promoter® and NPS® are registered trademarks and Net Promoter Score and Net Promoter System are trademarks of Bain & Company, Satmetrix Systems and Fred Reichheld
    (2)    Priority Segments Net Promoter Score (NPS) is a simple average of the NPS scores of four priority segments: NAB defined Home Owners and Investors, as well as Small Business ($0.1m-
FULL YEAR RESULTS 2017 - NAB
FY17 FINANCIALS

       GARY LENNON
       Chief Financial Officer

GROUP FINANCIAL PERFORMANCE
 GROWTH IN KEY FINANCIAL INDICATORS
     ($m)                                                                                                    2.7 %

                                         2.5 %
                                                                                                                                       1.8%
                                                                  1.6 %
                                                                                                     9,995       10,260
                                 6,483           6,642
                                                                                                                               5,084          5,176
                                                          3,294           3,348

                                 FY16            FY17     1H17            2H17                       FY16            FY17      1H17           2H17

                                                 Cash earnings                                                       Underlying profit

                     2.7 %

                                                                           2.6%

                                         1.8 %
                                                                                                  1.7 %
                                                                                                                                    1.3%
                                                                                                                                                             5.6 %
            17,433      17,895
                                                                   7,438          7,635
                                 8,869       9,026                                                                           800           810
                                                                                          3,785       3,850                                           394            416

            FY16         FY17    1H17            2H17              FY16           FY17    1H17            2H17               FY16          FY17       1H17           2H17

                      Net operating income                                    Operating expenses                                           B&DD charge

11
FULL YEAR RESULTS 2017 - NAB
SOLID REVENUE PERFORMANCE
     NET OPERATING INCOME
                                                                                               HoH revenue growth 1.8 % (YoY 2.7%)
     ($m)

                                                                             262                  (98)
                                                                                                                       (68)
                                                                                                                                             (11)                   (34)                 10
                                                        96

                                                     Excludes Markets & Treasury
                                                                                                                                                                                                              9,026
                                 8,869
            8,724
            Sep 16               Mar 17              Volumes               Margin          Markets & Treasury       Derivative              Fees &                 Wealth               Other                 Sep 17
                                                                                                Income 1             Valuation            Commissions
                                                                                                                    Adjustment

     GROUP NET INTEREST MARGIN                                                                                     MARKETS & TREASURY INCOME
                                                                                                                   ($m)
                                0.03%       (0.03%)                                                                                                                             1,033
                                                                                                                                                     924
                                                         (0.01%)       0.00%        0.00%                                 893                                                                                867
                     0.07%

                                                                                                                                                        554                      684
                                                                                                                              555                                                                             491
                                                                                                1.88%
       1.82%
                                                                                                                           339                        392                        362                          371
                                                                                                                              (1)                     (22)                      (13)                          5
       Mar 17        Lending   Funding &      Bank           Mix     Capital &     Markets &    Sep 17
                     Margin     Liquidity     Levy                    Other        Treasury                               Mar 16                    Sep 16                    Mar 17                     Sep 17
                                                                                                                                                                                    2                                  2,3
                                                                                                                      Group Treasury            Customer risk management                  NAB risk management

     (1) Excludes Fees & Commissions and Derivative Valuation Adjustments
     (2) In 1H17 an amount of income previously classified as NAB risk management has been reclassified as Customer risk management
     (3) NAB risk management comprises NII and OOI and is defined as management of interest rate risk in the banking book, wholesale funding and liquidity requirements and trading market risk to support
         the Group’s franchises. Customer risk management comprises OOI
12

OPERATING EXPENSE GROWTH DRIVEN BY INVESTMENT UPLIFT
 OPERATING EXPENSES                                                                            HoH expense growth 1.7% (YoY 2.6%)
     ($m)

                                                                                                                                                              16                   53
                                                             (101)                                                                   61
                                                                                      22                      14

                                    3,785                                                                                                                                                                3,850
             3,683

            Sep 16                  Mar 17              Productivity           Redundancies           Remuneration            Technology and        Depreciation and              Other                  Sep 17
                                                          savings                                       increases               investment            Amortisation

 OPERATING EXPENSES CONSIDERATIONS                                                                                 PROJECT INVESTMENT SPEND (OPEX AND CAPEX)
                                                                                                                   ($m)
 • FY17 Productivity savings of $301m                                                                                         469                       531                     560                          654
     • 841 FTE reduction                                                                                                      2%

 • Positive FY17 ‘jaws’ including bank levy                                                                                    44%                                              38%                          36%
                                                                                                                                                        47%
 • Project investment spend up by ~$200m in FY17
                                                                                                                              19%                                               32%                          36%
     • Customer experience improvements                                                                                                                 24%
                                                                                                                              35%
     • New digital solutions                                                                                                                            29%                     30%                          28%
                                                                                                                           Mar 16              Sep 16                          Mar 17            Sep 17
                                                                                                                          Other                                             Infrastructure
                                                                                                                          Efficiency and Sustainable Revenue                Compliance / Operational Risk

13
FULL YEAR RESULTS 2017 - NAB
PRUDENT APPROACH TO PROVISIONING
     BAD & DOUBTFUL DEBTS (B&DD)                                                                                       90+ DPD, GIAs & WATCH LOANS AS A % OF GLAs
 ($m)

                                                     0.16%                                      0.15%
          0.13%                0.14%                                      0.14%

                                                                                                                                                  1.15%                 1.13%                 1.02%
                                                                                                                              1.22%                                                                                1.07%
                                 375                  425                   394                  416
            349
             53                                        100                   89                   160
                                                                                                                              0.63%               0.78%                 0.85%                 0.85%                0.70%
            296                  375                  325                   305                  256
                                                                                                                             Sep 15               Mar 16                Sep 16                Mar 17               Sep 17
          Sep 15               Mar 16               Sep 16                Mar 17               Sep 17
                                                                                                                               90+ DPD & GIAs as a % of GLAs                         Watch loans as a % of GLAs
            B&DD charge             CP overlays 1          B&DDs as a % of GLAs (half year annualised)

     NEW IMPAIRED ASSETS                                                                                              COLLECTIVE AND SPECIFIC PROVISIONS
 ($m)                                                                                                                 ($m)
                                                                                                                               3,502                 3,580              3,523               3,443               3,489
                                                                                                                                448                  602
                                                                                                                                                                        712                 748                  691
                                                                                                                                 102                 102
                                                                                                                                                                         202                                     451
                                1,291                                                                                                                                                        291
                                                      1,046
                                 522                   300                  690
                                                                                                   452                         2,952                 2,876              2,609
                                                                              31                                                                                                            2,404               2,347
                                                                                                    9
            570                  769                   746                   659
                                                                                                   443
          Sep 15               Mar 16                Sep 16                Mar 17                Sep 17                       Sep 15               Mar 16              Sep 16              Mar 17               Sep 17
                                                                                                   2
                   New impaired assets                         NZ Dairy impaired no loss                                 Collective provisions             Collective provisions overlay
                                                                                                                                                                                                  1
                                                                                                                                                                                                      Specific provisions

     (1) Represents collective provision overlays held for targeted sectors on a forward looking basis
     (2) NZ Banking dairy exposures currently assessed as no loss based on security held. Collective provisions are held against these loans

14

AUSTRALIAN HOUSING LENDING
     HOUSING LENDING PORTFOLIO PROFILE                                                                                HOUSING LENDING 90+ DPD & GIAs AS % GLAs
                                                                                                                       1.4%
 •       Prudent customer behaviour – on average customers are 30
         monthly payments in advance; 73% of all customers are at                                                      1.2%
         least 1 month in advance1                                                                                     1.0%

 •       Large equity buffers – average LVR at origination 69% and                                                     0.8%

         dynamic LVR 43%                                                                                               0.6%

                                                                                                                       0.4%
 •       Large interest rate buffers – apply a floor rate (7.25%) or
         buffer (2.25%) to new and existing debt                                                                       0.2%
                                                                                                                          Sep 11          Sep 12           Sep 13        Sep 14          Sep 15         Sep 16           Sep 17

 •       Granular expense evaluation – across 12 customer expense                                                              NSW/ACT                QLD            SA/NT            VIC/TAS              WA            Total
         criteria2

 INTEREST ONLY % OF NEW LENDING3 (QUARTERLY)                                                                           INTEREST ONLY CONVERSIONS TO P&I
                                                                                                                      ($bn)
     60%
                                                                                                                                                                             8.4        Recent monthly experience

                                                                                                                               6.8
                                                                                                                                               6.0
     40%                                                                                                                                                                     3.5
                                                                                                                                                              5.2
                                                                                                                               2.1            1.2
                                                                                                                                                              1.0                           1.8
                                                                                                                                                                                                          1.5
                                                                                                       25%                                                                                                               1.2
     20%
                                                                                                                               4.7            4.8                            4.9            1.0          0.7
                                                                                                                                                              4.2                                                       0.5
                                                                                                                                                                                            0.8          0.8            0.7
      0%                                                                                                                      1H16           2H16            1H17          2H17           Aug 17       Sep 17          Oct 174
              Dec 15     Mar 16     Jun 16      Sep 16      Dec 16    Mar 17       Jun 17    Sep 17
                                                                                                                                                      Early conversion
                                                                                                                                                      Contractual conversion
      (1) Including offset facilities. Average monthly payments in advance excludes line of credit, interest only loans and not reported for Advantedge
      (2) Use the greater of customer expense capture or scaled Household Expenditure Measure
      (3) The 30% Interest Only flow cap includes all new IO loans and net limit increases on existing IO loans. The cap excludes line of credit and internal refinances unless the internal refinance results in an
          increased credit limit (only the increase is included in the cap)
      (4) October figures have been estimated using intra-month data
15
FULL YEAR RESULTS 2017 - NAB
CONSUMER BANKING & WEALTH
     CASH EARNINGS AND REVENUE                                                                                        NET INTEREST MARGIN
     ($m)                                                              2.1%

                  4.3%
                                                                                                                                2.12%                                                             2.10%
                                                                                             3.6%
                                                                                                                                                         2.02%                   2.03%
                                          13.7%
                                                                5,368      5,481
            1,565       1,633
                                                                                      2,692       2,789
                                  764        869

            FY16        FY17      1H17      2H17                FY16       FY17        1H17       2H17
                                                                                                                                Mar 16                  Sep 16                  Mar 17           Sep 17
                          Cash earnings                                       Total revenue

 HOUSING LENDING MULTIPLE OF SYSTEM GROWTH1                                                                          NET INVESTMENTS INCOME TO AVERAGE FUM/A AND AUM2
                                                                                                                      ($m)

                                                                                                                             0.35%                     0.36%                    0.33%             0.32%

                                                                                               1.4     1.4
                                          1.2            1.2                    1.2                                                                      525
           1.0                                    1.1                   1.1                                                    506
                                                                0.9                    1.0                                                                                       499
                  0.9                                                                                                                                                                              488
                                  0.8
                          0.6
                                                                                                                             Mar 16                    Sep 16                   Mar 17            Sep 17
                                                                                                                                          Net Investments Income
       Sep        Oct    Nov Dec          Jan     Feb    Mar   Apr May Jun             Jul    Aug Sep
                                                                                                                                          Net Investments Income to Average FUM/A & AUM
        16        16      16  16           17      17    17    17   17  17             17      17  17

     (1)    APRA Monthly Banking Statistics
     (2)    For September 2017 there has been a change to how FUM/A and AUM are presented. For net investments income to average FUM/A and AUM, certain items will be represented in both the FUM/A
            and AUM components of the denominator. Comparative period information has been restated

16

BUSINESS & PRIVATE BANKING
     CASH EARNINGS AND REVENUE                                                                                        NET INTEREST MARGIN
     ($m)
                                                                      5.3 %
                  6.3%                                                                                                                                                                           2.91%
                                                                                                                                                                                2.84%
                                                                                                                                 2.80%                   2.79%
                                                                                             4.5%
                                         7.7%

                                                                6,003      6,319
            2,673       2,841

                                  1,368     1,473                                     3,090       3,229

            FY16        FY17      1H17      2H17                FY16       FY17        1H17       2H17                          Mar 16                  Sep 16                  Mar 17           Sep 17

                          Cash earnings                                       Total revenue

 BUSINESS & HOUSING LENDING GLAs                                                                                      BUSINESS LENDING GROWTH (YOY)1
     ($bn)
                                                                                                                           12.5%
                                3.2%                                               2.7%

                                                                                                                                             4.8%
                 96.9            97.8           100.0                              89.7              90.4                                                    3.5%
                                                                   88.0                                                                                                        2.8%
                                                                                                                                                                                         2.2%         ~2%

             Sep 16             Mar 17          Sep 17           Sep 16           Mar 17         Sep 17                 Government,          Agri            Health            CRE       Other     SME growth -
                                                                                                                         Education,                                                                average of 4
                                                                                                                        Community &                                                                  majors 2
                           Business Lending                                     Housing Lending                          Franchising

     (1)     Growth rates are on a customer segment basis and not industry
     (2)     Represents NAB internal estimates of SME business lending growth for the four Australian major banks including NAB based on latest publicly available peer data

17
FULL YEAR RESULTS 2017 - NAB
CORPORATE & INSTITUTIONAL BANKING
     CASH EARNINGS AND REVENUE                                                                                           NET INTEREST MARGIN
     ($m)
     ($m)
                                                                      (0.2%)
                                                                                                                                                                                                         1.58%
                                                                                                                                                                               1.53%
                12.3%                                                                                                             1.50%                 1.49%

                                                                                             (5.1%)                               0.83%                 0.80%                  0.81%                     0.84%

                                         (5.9%)
                                                               3,346        3,340

          1,367       1,535
                                                                                       1,714       1,626
                                   791          744

          FY16        FY17        1H17          2H17           FY16         FY17       1H17        2H17                           Mar 16               Sep 16                  Mar 17                    Sep 17
                        Cash earnings                                        Total revenue                                                 Corporate & Institutional Banking                  ex Markets

     COSTS                                                                                                               GLAs AND RWAs
     ($m)                                                                                                                ($bn)
                                                      (8.1%)                                                                                                                                  (7.7%)

                                                                                                                                            0.6%

                658                                                                                                                                                          124.3            114.2               114.7
                                         640                         631                                                    87.5            85.6          88.0
                                                                                             605
                                                                                                                           Sep 16          Mar 17        Sep 17             Sep 16            Mar 17            Sep 17
              Mar 16                    Sep 16                  Mar 17                    Sep 17
                                                                                                                                             GLAs                                              RWAs

18

NZ BANKING
     CASH EARNINGS AND REVENUE                                                                                           NET INTEREST MARGIN
 (NZ$m)
                                                                                                                                  2.27%
                8.9%                                                  3.5%
                                                                                                                                                       2.21%                                            2.21%

                                         6.8%                                                4.6%                                                                             2.15%

                      941                                      2,181        2,257
          864
                                  455           486                                    1,103       1,154

         FY16         FY17       1H17        2H17              FY16         FY17       1H17        2H17                          Mar 16               Sep 16                 Mar 17                     Sep 17
                       Cash earnings                                         Total revenue

     AUCKLAND RETAIL AND SME LOAN GROWTH                                                                                 TOTAL 90+ DPD AND GIAs AND AS % OF GLAs
     (NZ$bn)                                                                                                             (NZ$m)
                                                                                                                 2,000

                                                                                                                                                              1.69%                                                       1.80%

                           22.9%                                                                                 1,800

                                                                                                                                  1.43%                                               1.61%
                                                                               31.9%                             1,600

                                                                                                                 1,400                               1,251                    1,231                                       1.20%

                                                                                                                 1,200
                                                                                                                             1,017
                                                                                                                 1,000
                                                                                                                                                                                                             0.79%
                                                                                                                  800
                                                                                                                                                        823                     795                   625
                                             17.2                                                                                 579                                                                                     0.60%

                                  16.3                                                 8.7          9.1           600

                                                                                                                                                                                                            222
                       15.2                                                 7.6
                                                                                                                  400

            14.0                                               6.9                                                200

                                                                                                                                  438                   428                     436                         403
                                                                                                                     0                                                                                                    0.00%

                                                                                                                             Mar 16                   Sep 16                  Mar 17                     Sep 17
         Mar 16 Sep 16 Mar 17 Sep 17                       Mar 16          Sep 16   Mar 17      Sep 17
                                                                                                                                                Dairy Impaired Assets currently assessed as no loss 1
                Auckland Housing Volumes                       Auckland SME Lending Volumes                                                     90+ DPD and GIAs
                                                                                                                                                Total 90+ DPD and GIAs as % GLAs (RHS)

     (1) NZ Banking dairy exposures currently assessed as no loss based on security held. Collective provisions are held against these loans

19
CAPITAL AND FUNDING POSITION REMAINS STRONG
     GROUP BASEL III COMMON EQUITY TIER 1 CAPITAL RATIOS
      (%)
                                            Capital generation 26 bps (19 bps ex DRP)

                                            0.89                 (0.63)                                                                                                       4.44
                                                                                       0.00                 (0.17)               (0.14)
                                                                                                                                                                                                   14.50

                     10.11                                                                                                                             10.06

                                       Cash earnings        Dividend (Net             Underlying           Mortgage              Other                Sep 17            Internationally            Sep 17
                      Mar 17
                                                                DRP)                    RWA              Model impacts                                (APRA              Comparable           (Internationally
                                                                                                            to RWA                                  standards)               CET1               Comparable
                                                                                                                                                                         adjustments               CET1)1

     CAPITAL CONSIDERATIONS                                                                                          NET STABLE FUNDING RATIO
 •         Targeting ‘unquestionably strong’ CET1 ratio benchmark of                                                 •    NAB Group NSFR 108%
           10.5% by January 2020
                                                                                                                     •    Minimum 100% compliance required by 1 January 2018
 •         Internationally Comparable CET1 ratio of 14.5%
 •         Leverage ratio 5.5% on APRA basis and 5.9% on
           Internationally Comparable basis1,2                                                                       LIQUIDITY COVERAGE RATIO
 •         Dividend of 99 cents maintained and 1.5% discount on DRP                                                  •    NAB Group LCR 123%
                                                                                                                     •    Minimum 100%

     (1)   Internationally Comparable CET1 ratio at 30 September 2017 aligns with the APRA study entitled “International Capital Comparison Study” released on 13 July 2015. Refer to page 126 for more details
     (2)   Leverage ratio calculated using an Internationally Comparable Tier 1 capital measure, including transitional relief for non-Basel 3 compliant instruments

20

SUMMARY
            Operating trends continue to improve

            NIM well managed

            Strong performance in Business & Private

            Investing to drive better productivity and customer experience

            Prudent approach to asset quality with additional CP overlays

            Balance Sheet strong – funding and capital

21
ACCELERATING OUR STRATEGY

     ANDREW THORBURN
     Chief Executive Officer

GOOD PROGRESS EXECUTING STRATEGY

                                        • Deep focus on customers, roll out of bank-wide NPS system (#1 NPS1 of majors)
                                        • Upgraded digital capabilities, NAB Labs, innovative partnerships (e.g. realestate.com.au)
                                        • Significant investment in senior leadership capability

                                        • Improved ROE from 4th of majors to equal 2nd2
                                        • Good growth momentum in core SME franchise and other priority segments
                                        • Disciplined margin management across key products

                                        • Divested low returning businesses (GWB, CYB, UK CRE, Life Insurance)
                                        • Strengthened balance sheet, well funded and capitalised (CET1 ratio up 143bps3)
                                        • Significantly improved asset quality

     (1) As at September 2017 NAB is #1 in Priority Segments Net Promoter Score (NPS), which is a simple average of the NPS of four priority segments: NAB defined Home Owners and Investors, as well as
         Small Business ($0.1m-
THE WORLD IS MOVING, AND SO ARE WE
                                                                                                                                                NAB mobile logins
                                                             • Customers demand world class digital capabilities –                                              ~500m
           Higher Customer                                         faster, simpler, seamless
             Expectations                                    •     Behaviours rapidly changing; growth upside if                              ~250m
                                                                   expectations are exceeded

                                                                                                                                                FY14            FY17

                                                                                                                                       Global tech giants testing banking
                                                             • Disruptive new technologies                                             and payment services in Australia 1
      Changing Competitive
                                                             • Potential for lower market growth but opportunity for                   •   Ant Financial - AliPay
                                                                   step change in productivity                                         •   Google - Android Pay
           Dynamics                                                                                                                    •   Apple
                                                             •     Digitisation enables exponential scaling for minimal
                                                                                                                                       •   WhatsApp
                                                                   cost
                                                                                                                                       •   WeChat - WeBank and WePay

                                                                                                                                               # of NAB Compliance
                                                                                                                                            requirements & obligations
       Changing Risks and                                    • Nature of risks changing and evolving at a rapid
                                                                   pace (e.g. cyber security, AML)                                                     >7,000
      Increasing Regulatory
          Requirements                                       •     Heightened community and regulator expectations

                                                                                                                                                        2017

     (1) FinTech Australia, Submission to Open Banking Inquiry, September 2017

24

OUR LONGER TERM STRATEGIC FOCUS
 PURPOSE                                                   BACK THE BOLD WHO MOVE AUSTRALIA FORWARD

 VISION                                                     AUSTRALIA AND NEW ZEALAND’S MOST RESPECTED BANK
                                                            NPS positive and #1 of major Australian banks (priority segments)

                                                            Cost to Income ratio towards 35%
 OBJECTIVES1
                                                            #1 ROE of major Australian banks

                                                            Top quartile employee engagement

     HOW WE WILL WIN – BY BACKING OUR CUSTOMERS
                                     Best Business Bank                                                                        Simpler and Faster
                New and Emerging Growth Opportunities                                                                   Great Leaders, Talent and Culture

     GREAT PEOPLE LIVING OUR VALUES
                 •       Passion for Customers                                                                                    •   Respect for People
                                                                                                      •       Be Bold
                 •       Win Together                                                                                             •   Do the Right Thing

     FOUNDATIONS
                     •     Balance Sheet                                                                  •    Risk               •   Technology

     (1) Refer to key risks, qualifications and assumptions in relation to forward-looking statements on page 157

25
BEST BUSINESS BANK
     EMPOWERED RELATIONSHIP BANKERS                                                                              INDUSTRY SPECIALISATION
                                                                                                                          % of revenue by
                Targeted revenue per                       •      Simplified processes and                               specialised banker                         •     Broadening and deepening
                  banker (indexed) 1                              credit decisions                                                                                        specialisation, particularly
                                                           •      Skilling bankers for a digital                                                 50                       Agri, Health, Education,
                                        1.6X                      future                                                  80                                              Professional Services, CRE

                                                           •      Increased capacity to focus                                                    15                 •     Industry specific offerings,
                1.0                                                                                                                                                       e.g. HICAPS Go
                                                                  on more complex customers                                                      35
                                                                                                                          20                                        •     Data analytics driving better
                                                           •      New career pathing,
                                                                  increasing tenure                                      2017                 3 - 5 years                 customer insights
                                                                                                                     Generalist
                                                                                                                     Generalist banker with industry focus
               2017                   3 - 5 years                                                                    Specialised

     MARKET LEADING DIGITAL AND DECISIONING                                                                      STRENGTHEN SMALL BUSINESS CUSTOMER PROPOSITION
            % customer service needs
             that can be met digitally 2                    •     Ability to approve ~80% of                     •      Empowered bankers with capabilities and tools to make
                                                                  SME loans in 24 hours                                 decisions and resolve customer needs first time

                                         65%
                                                            •     Same day onboarding for                        •      Leverage CRM and voice biometric authentication and routing
                                                                  all transactions accounts                             technologies
                                                            •     Integrated banker and                          •      More proactive and effective customer contact supported by
               30%                                                customer digital platform                             analytics
                                                            •     Expanded QuickBiz                              •      Segment specific offering for entrepreneurs and growth
                                                                  product offering                                      businesses

               2017                    3 - 5 years

     (1) Reflects revenue generated in Business & Private Bank per relationship manager
     (2) Proportion of business servicing processes which have digital capability for self-service

26

SIMPLER AND FASTER
 TECHNOLOGY, NETWORK AND ORGANISATIONAL DESIGN                                                                   CUSTOMER JOURNEYS SCALED AND EXPANDED
       • Tech Simplification and Resilience                                                                      • 7 journeys underway, targeting 20 – home and
                 • Targeting 15-20% reduction in IT applications                                                       business lending most significant
                 • Strengthen controls environment                                                               • Targeting a doubling of FTE by 2020 to ~1,500
                 • Rebalance tech workforce – insource critical roles
                                                                                                                 • Fundamentally different approach to transform
       • Flatter structure – max 7 layers CEO to customer                                                              customer experience
       • Smarter physical network                                                                                      • Co-located multi-disciplinary teams
                 • Smaller, compact footprint – multi format
                 • Targeting 50% reduction in OTC transactions1                                                        • 90-day delivery cycle, issues resolved within 24
                 • Full rollout of Smart ATMs                                                                               hours
                                                                                                                       • Pace of delivery 2x faster than traditional models
     TARGETING FEWER & MORE DIGITISED PRODUCTS                                                                         • Customer involvement >3,000 hours of customer
                                                                                                                            testing
                          ~600                                                                                         • Real technology innovation – AI, robotic process
                                                  10% of products                                                           automation
                                                  digitally originated

                                                                                                                                               Targeted benefits2
                                                                 ~300

                                                                                          60% of products
                                                                                          digitally originated                NPS3                            Cost                            Revenue
                                                                                                                            increase                         savings                          benefits
                                                                                                                             of >20                           ~20%                            5 - 10%
                           2017                                 3-5 Years

       (1) Relates to cash withdrawals under $2,000 and deposits only
       (2) Represents the targeted cost savings or revenue benefits by individual customer journey
       (3) Refers to the Operational NPS for the respective experiences. Operational NPS is derived from surveys sent by NAB to NAB customers who have recently gone through the respective
           experiences

27
NEW AND EMERGING GROWTH OPPORTUNITIES
     NEW MARKETS AND CUSTOMERS                                                                                                AUSTRALIA’S LEADING DIGITAL BANK
     • Urban growth corridors in Greater Sydney and
            Melbourne                                                                                                         •      Accelerating standalone attacker strategy
               • Forecast growth of 0.9m people in 5                                            years1                        •      400,000 customers, NPS of +585
               • 10 new branches, 100 refurbished and                                                                         •      Growing at 3x system for home loans6
                      relocated, and more mobile bankers
                                                                                                                              •      Attractive home loan cost-to-acquire and
                                                                                                                                     and returns
     • Leverage NAB’s top 15 global position in
            Infrastructure financing2
               • US, Europe, Asia & Australia - infrastructure
                      needs of $80 trillion between 2016-20403                                                                PARTNERSHIPS AND INNOVATION
               • Pursue opportunities with existing customers
                      and partner with investors to drive balance                                                                 • Scaling NAB Labs and NAB Ventures
                      sheet efficiency                                                                                                    • Labs delivering more than 30 projects annually
     • Extend NAB’s Private Banking reach                                                                                                 • 5 equity investments to date
               • Only ~20% of Australian HNW customers                                                                            • 5 year strategic partnership with
                      have a Private                 Banker4                                                                           realestate.com.au to offer NAB loan products
               •      New product proposition and improved banker                                                                 • HICAPS Go – national roll-out underway,
                      capability                                                                                                       >500 health practitioners on the platform
     (1)   Melbourne: “Victoria in Future 2016”, Dept of Environment, Land, Water and Planning. Sydney: “2016 New South Wales State and Local Government Area Population Projections”, NSW Govt – Planning & Environment
     (2)   IJGlobal League Tables (2016)
     (3)   Global Infrastructure Outlook, Oxford Economics, 2017
     (4)   Growth Mantra Analysis primarily based on raw data from Investment Trends Segmentation Information 2015
     (5)   Refers to the Operational NPS for the home loan experience. Operational NPS is derived from surveys sent by NAB to NAB customers who have recently gone through the experience
     (6)   APRA Monthly Banking Statistics
28

GREAT LEADERS, TALENT & CULTURE
     • Build deep internal talent pipelines and pro-actively attract best in class external talent
     • Enable bankers to deliver world-class client experience, every day
     • Accelerate capability in key areas of digital, technology, data and AI
     • Cultivate truly differentiating culture with relentless focus on Purpose, Vision and Values
     • Helping our people transition to new careers – ‘The Bridge’

                                                                                               EMPLOYEE ENGAGEMENT
                                                                                                                                              67%
                                                                                            59%

                                                                                                   1                                                        2
                                                                                            NAB                                         Top Quartile

     (1) 2017 Employee Engagement Survey conducted by Aon Hewitt. The engagement score indicates the percentage of employees at NAB that are strong advocates (SAY), demonstrate a commitment to
         NAB (STAY) and exerts discretionary effort (STRIVE)
     (2) 75th percentile of 300 Australian and New Zealand companies

29
REQUIRES ADDITIONAL INVESTMENT OF ~$1.5BN1
 INVESTMENT SPEND                                                                                                     INVESTMENT FOCUS
     $bn
                                                                                                                      • Targeting an additional investment spend of ~$1.5bn2
       1.8                                                                                                                over FY18-FY20
                                                                           ~1.6                                       • FY18 investment spend focused on
       1.6                                              ~1.5
                                                                                            ~1.4                             • Customer journeys at scale
       1.4
                                      1.2                                                                                    • Enhance technology resilience (e.g. cyber
                                                          0.5               0.6                                                  security, AML, regulatory requirements)
       1.2                                                                                    0.4
                     1.0                0.2                                                                                  • Product and tech simplification
       1.0
                                                                                                                             • Digital capabilities, ecosystems
       0.8                                                                                                                   • Automation, straight through processing
                                                                                                                             • SME digital and decisioning investments
       0.6
                                                                                                                             • Pricing analytics – Price Discovery Tool 2.0
       0.4
                                                                                                                      • Timing and amount of investment spend may vary
                                                                                                                          depending on operating environment
       0.2

       0.0
                    FY16              FY17             FY18F             FY19F              FY20F

     (1)   Refer to key risks, qualifications and assumptions in relation to forward-looking statements on page 157
     (2)   Compared to baseline of $1.0bn

30

TARGETING COST SAVINGS OF MORE THAN $1BN1
 COST SAVINGS                                                                                                         TARGETED FTE CHANGES BY FY20
 •         Targeting >$1.0bn of cost savings by FY20
              •      Simplification and automation
                                                                                                                                               ~2,000        •   FY17 FTE of 33,422
              •      Flatter organisational structure
                                                                                                                                                             •   Excludes insourced
              •      Procurement and third party costs                                                                                                           FTE which is expected
 •         FY18 expenses expected to increase by 5-8% due to higher                                                                                              to be cost neutral
                                                                                                                            ~(6,000)
           investment spend, then targeting broadly flat expenses to
           FY20
              •      Excludes restructuring provision and large one-off
                                                                                                                          Productivity   Investment Uplift
                     expenses
              •      FY18 expense growth skewed to 1H18
              •      $0.5-0.8bn restructuring provision expected in 1H18
                                                                                                                      REVENUE AND DIVIDEND
                     (mainly redundancy and project management costs)                                                 •   Revenue benefits expected from better customer retention
                                                                                                                          and targeted market share gains
$bn                                                    FY18               FY19-20               TOTAL
                                                                                                                      •   Board expects to maintain FY18 dividends at the FY17 level
 Targeted incremental                                                                                                     subject to no material change to external environment and
                                                        ~0.5                 ~1.0                 ~1.5                    satisfactory Group performance
 investment spend

 Targeted cost savings
                                                        ~0.3                 >0.7                 >1.0
 (expected P&L impact)

 Expected restructuring
                                                      0.5-0.8                                   0.5-0.8
 costs

     (1)   Refer to key risks, qualifications and assumptions in relation to forward-looking statements on page 157

31
OVERALL SUMMARY
     • Significantly stronger bank with improving momentum
     • Environment requires a long term plan
     • Accelerating our strategy to drive productivity and growth
         • Best business bank
         • Simpler and faster
         • New and emerging growth opportunities
         • Great leaders, talent and culture
     • Real financial benefits, including targeting >$1bn of cost savings
     • Confident in our plan and our ability to execute

32

      ADDITIONAL INFORMATION
      AUSTRALIAN CUSTOMERS
PRIORITY SEGMENTS NPS                                                                                                                                                                                                 AUSTRALIAN CUSTOMERS

     SMALL BUSINESS                                                                                                               MEDIUM BUSINESS
     0                       Small Business Net Promoter Score vs. peers1                                                                                Medium Business Net Promoter Score vs. peers1

                                                                                                                                    10
                                                                                                                                                                                                                                             +3
-10                                                                                                             -16                    0                                                                                                         -5
                                                                                                                -16
                                                                                                                                   -10                                                                                                           -6
-20                                                                                                             -21                                                                                                                              -14
                                                                                                                                   -20
                                                                                                                -24
-30                                                                                                                                -30
           Jul    Dec       May       Oct       Mar       Aug       Jan        Jun     Nov        Apr      Sep                              Jul    Dec      May       Oct      Mar       Aug       Jan        Jun     Nov       Apr        Sep
           13      13        14       14        15         15        16         16      16        17        17                              13      13       14       14       15         15        16         16      16       17          17
                          NAB                  Peer 1                 Peer 2                  Peer 3                                                     NAB                Peer 1                Peer 2               Peer 3

     HOME OWNERS                                                                                                                  INVESTORS
                             Home Owners Net Promoter Score vs. peers2                                                                                         Investors Net Promoter Score vs. peers2
     0                                                                                                                             0

-10                                                                                                               -11            -10
                                                                                                                                                                                                                                                 -14
                                                                                                                  -19                                                                                                                            -16
-20                                                                                                                              -20                                                                                                             -18
                                                                                                                  -21
                                                                                                                                                                                                                                                 -20
                                                                                                                  -23
-30                                                                                                                              -30
           Jul    Dec       May        Oct       Mar      Aug        Jan       Jun       Nov       Apr       Sep                       Jul        Dec     May       Oct       Mar       Aug       Jan         Jun     Nov       Apr        Sep
           13      13        14        14        15        15         16        16        16       17         17                       13          13      14       14        15         15        16          16      16       17          17
                             NAB                 Peer 1                Peer 2                Peer 3                                                       NAB                 Peer 1               Peer 2                Peer 3

     (1)    DBM Business Financial Services Monitor; all customers’ six month rolling averages for Small Business ($0.1m-
OUR CUSTOMER JOURNEYS                                                                                                                                                                     AUSTRALIAN CUSTOMERS

     Seven journeys launched to date…
                                date                                                                             TARGETED BENEFITS1
     Everyday Banking
          • make it simple to open a bank account                                                                          NPS2                             Cost                           Revenue
                                                                                                                         increase                          savings                         benefits
                                                                                                                          of >20                            ~20%                            5 - 10%
     Plan for my retirement
           • straightforward retirement planning

     Business transaction onboarding                                                                             A NEW WAY OF WORKING
          • simplify business account set-up

     Business servicing
          • everyday support for our business customers

     Personal credit card servicing
          • easy credit card management

     Home lending
         • make buying a home uncomplicated                                                                          •     Co-located multi-disciplinary teams
                                                                                                                     •     90-day sprints and issues resolved within 24 hours
     Business lending
          • make it simple for businesses to grow                                                                    •     Pace of delivery 2x faster than traditional models
                                                                                                                     •     Direct customer involvement

     (1) Represents the targeted cost savings or revenue benefits by individual customer journey
     (2) Refers to the Operational NPS for the respective experiences. Operational NPS is derived from surveys sent by NAB to NAB customers who have recently gone through the respective experiences

36

UPLIFTING BUSINESS CUSTOMER ONBOARDING EXPERIENCE                                                                                                                                         AUSTRALIAN CUSTOMERS

     Business transaction account opening in 10 mins1
                                                                                   •     Fast-tracked account opening via nab.com.au, opening time
                                                                                         reduced from 4-6 days to 10 mins1

                                                                                   •     Accept Know Your Customer (KYC) documents by email and
                                                                                         without certification, supported by KYC Business Lookup

                                                                                   •     A single interface to speed up onboarding by integrating back-end
                                                                                         systems and automating processes

                                                                                   •     SMS customer alerts scheduled once accounts are open

                                CUSTOMER EXPERIENCE (NPS)2                                                                                      TARGETED COST PROFILE

                                      33pt increase                                                                              >20%
                                                                                                                                 >20% savings of underlying cost base

                                                                                28

                                                        13

                                 -5
                              2H16                    1H17                    2H17                                                 FY17              FY18              FY19              FY20

     (1) For simple business customers opening via digital
     (2) Refers to the Operational NPS for the respective experiences. Operational NPS is derived from surveys sent by NAB to NAB customers who have recently gone through the respective experiences

37
MAKING IT SIMPLE TO OPEN AN EVERYDAY ACCOUNT                                                                                                                                              AUSTRALIAN CUSTOMERS

     Straightforward and fast everyday accounts
                                                              •     Account opening and ready to transact with card time halved from 10 to 3 days

                                                              •     Enhanced electronic Know Your Customer authentication increasing conversion

                                                              •     Card & Pin self-activation deployed in August 2017

                                                              •     Statements simplified, impacting ~4 million customers

                                                              •     Customers notified via SMS of account and card status

                                   CUSTOMER EXPERIENCE (NPS)1                                                                                        TARGETED COST PROFILE

                                                                                                                                 >20% savings of underlying cost base
                                   14pt increase

                                                                              43
                                 29                    34

                               2H16                  1H17                   2H17                                                   FY17               FY18             FY19              FY20

     (1) Refers to the Operational NPS for the respective experiences. Operational NPS is derived from surveys sent by NAB to NAB customers who have recently gone through the respective experiences

38

CONSUMER BANKING & WEALTH: MAIN BANK OPPORTUNITY                                                                                                                                          AUSTRALIAN CUSTOMERS

 OUR FOCUS                                                                                                         HOUSING LENDING MARKET SHARE1
                                               DIGITAL
                                                                                                               2
                                                                                                                       16.2%     16.2%       16.3%       16.1%       15.8%
                                                                                                               2                                                                 15.6%       15.6%       15.7%

                                                                                                               1
                                 PHYSICAL               CAPABILITY
                                                                                                               1
                                                                                                                                               1.2                                                        1.2
                                                                                                                        1.0        1.0                                                         0.9
                                                                                                               0                                           0.7                     0.7
                                                                                                                                                                       0.4
                             Improve customer experience                                                       0
                           Grow share and improve efficiency                                                           Mar 14   Sep 14      Mar 15      Sep 15      Mar 16      Sep 16       Mar 17     Sep 17
                               Maintain portfolio quality                                                                                    System Multiple                 Market share

     DIGITAL
           •   Leverage PBOP and digital tools                                                                     INCREASING SELF-SERVICE TO RELEASE CAPACITY
           •   Grow strategic partnerships
           •   Accelerate digital adoption and education                                                           •     Increase digital education for
                                                                                                                                                                                           22%
     PHYSICAL                                                                                                            bankers and customers
           •   Rebalance and strategically position footprint                                                      •     Smart ATM rollout
           •   Improve experience for business customers within branch
               network (~50% branch transactions)                                                                  •     Increased functionality of
                                                                                                                         digital tools
     CAPABILITY
           •   Investment in home lending specialists and broker customer
                                                                                                                   •     Investment in banker
               on-boarding                                                                                               capability to assist with
                                                                                                                                                                              FY14                      FY17
           •   Implementation of customer focussed remuneration model and                                                complex customer needs
                                                                                                                                                                                Branch over-the-counter
               performance metrics                                                                                                                                              transaction

     (1)   APRA Monthly Banking Statistics

39
BUSINESS & PRIVATE BANKING: LEVERAGING MARKET LEADERSHIP                                                                                                                                                                                AUSTRALIAN CUSTOMERS

     OUR FOCUS                                                                                                                              MAKING IT EASIER FOR CUSTOMERS
 •         Build on strong position in high returning sectors                                                                               •       Faster, easier online credit access – up to $50K within
                •       #1    Small1,        Medium1            &   Agri2                                                                           one business day on receipt of signed contract via
                                                                                                                                                    QuickBiz
 •         Deepen and expand industry specialisation and partnerships
                                                                                                                                            •       Simpler standard loan contracts – transparent, user
 •         Deliver superior customer experience through relationship,                                                                               friendly, easy to read and much shorter
           digital and direct
                                                                                                                                            •       Increasingly connected with digital – launched NAB
 •         Banker disciplines and incentives focused on total customer                                                                              Connect mobile app and virtual assistant to help service
           needs and returns                                                                                                                        simple enquiries
 •         Simplification and streamlining                                                                                                  •       Providing payment time certainty – NAB one of the first
                                                                                                                                                    large companies to sign the Australian Supplier Code

     FOCUSED ON BANKER DISCIPLINES                                                                                                          SMALL, MEDIUM AND AGRI BUSINESS LENDING MARKET
                                                                                                                                            SHARE
             Fee collection rates3                                    Customers with a NAB
                                                                        Markets product                                                                                                                                                    32%
                                                                                                                                                                                                     29%
                                                                                                                                                                 25%

                                             81%
                                                                                                              29%
                 72%                                                           27%

               Sep 16                      Sep 17                            Sep 16                        Sep 17                                                                        1                                        1                         2
                                                                                                                                                     Turnover $0.1m to
CORPORATE & INSTITUTIONAL BANKING CASE STUDIES1                                                                                                                AUSTRALIAN CUSTOMERS

                                             ACCELERATING OUR ACTIVITY IN GLOBAL INFRASTRUCTURE & CLEAN ENERGY
                                          DEEPENING OUR RELATIONSHIPS WITH INVESTORS TO WIDEN FINANCING SOLUTIONS

                  23 DEALS TOTALLING OVER $16BN IN                                31 DEALS TOTALLING OVER $72BN IN TOTAL           ACCESS TO DIVERSE MIX OF INSTITUTIONAL
                     RENEWABLES2 PROJECT VALUE                                        INFRASTRUCTURE2 PROJECT VALUE                        AND RETAIL INVESTORS

 CASE STUDIES
     BUNGALA SOLAR                                                              NEXT DC                                            AUSGRID US PRIVATE
     FARM                                                                                                                          PLACEMENT
     • Construction financing for Australia’s                                   • Australian independent data-centre                • NSW-based electricity distribution
           largest solar farm3; expected to generate                               operator completed Australia’s largest             business raised US$1.9 billion
           ~570GWh of renewable energy each                                        non-rated, wholesale over-the-counter A$           (equivalent) in its inaugural US debt
           year, sufficient to power approx. 82,000                                bond issue4,with NAB acting as Sole                markets offering
           homes                                                                   Arranger and Sole Lead Manager
                                                                                                                                    • Largest ever cross-border US Private
     • Supporting DIF and Enel Green Power                                      • Strong support from a diverse mix of                Placement5
           S.p.A, expanding their presence in the                                  institutional and sub-institutional investors
                                                                                                                                    • Strong investor demand saw the
           Australian renewables market                                            via NAB’s proprietary Access Bond
                                                                                                                                      transaction >six times oversubscribed
                                                                                   Service platform, JB Were and NAB
     • Origin Energy, a major Australian utility                                   Private                                          • Secured A$ funding for only a 5bps
           and key relationship customer will be                                                                                      premium and priced the notes in both
           purchasing electricity and renewable                                 • This is the 3rd time Next DC has                    fixed and floating rate format
           energy certificates from the project                                    accessed the bond market through NAB,
                                                                                   highlighting the breadth of our distribution     • NAB took a leading role in distributing
                                                                                   reach across Institutional, Business and           the transaction, including bringing in the
                                                                                   Private franchise investors                        two largest investors
     (1)   All data relates to the 12 months ended 30 September 2017
     (2)   Debt size has been used as a proxy for those transactions where Project Value was not available or irrelevant
     (3)   Data Source: RenewEconomy, ‘Australia’s largest solar farm – 220MW – under construction’, 26 July 2017
     (4)   Data Source: BondAvisor (October 2017)
     (5)   Data Source: Private Placement Monitor (October 2017)
42

           ADDITIONAL INFORMATION
           DIGITAL FOR CUSTOMERS
ACCELERATING SHIFT TO DIGITAL                                                                                                                                                    DIGITAL FOR CUSTOMERS

 INTERNET BANKING AND MOBILE TRANSACTIONS

     Sep 13           Jan 14          May 14          Sep 14          Jan 15          May 15          Sep 15          Jan 16          May 16          Sep 16        Jan 17    May 17     Sep 17

                                                                                          Internet Banking          Mobile

     SIMPLE CONSUMER PRODUCT SALES VIA DIGITAL1                                                                  INVESTMENT IN DIGITAL & TECHNOLOGY ESSENTIAL
                                                                                                                 • Customers demand world class digital
                                                                                                                       capabilities - faster, simpler, seamless
                                                                                                                 • Changing competitive dynamics and increasing
                                                                                                                       threat of disruption
                                                                            31%
                            19%                                                                                  • Nature of risks changing and evolving at a rapid
                                                                                                                       pace (e.g. cyber security)
                           FY14                                             FY17

     (1) Simple consumer product sales includes the opening of savings and transaction accounts, personal loans and credit cards across all segments and channels

44

QUICKBIZ FOR OUR SMALL BUSINESS CUSTOMERS                                                                                                                                        DIGITAL FOR CUSTOMERS

 Up to $50k within the day1                                                                                                                QUICKBIZ CUSTOMER APPLICATIONS

                                              •    Simple digital application for small                                                                         53%
                                                   business unsecured lending
                                              •    Application and decisioning reduced from
                                                   2 weeks to under 10 minutes
                                              •    Direct connectivity to Xero or MYOB data,
                                                   or simple financial upload from any
                                                   accounting package
                                                                                                                                             1H17                               2H17

 2H17 extended to business cards and overdrafts
     BUSINESS CARDS                                                                                               OVERDRAFT
      •     Customers receive their card within 3-5 business
                                                                                                                                                                    •   Fast online application
                                                                                                                                                                        using QuickBiz
            days using the online application form and
            streamlined fulfilment process                                                                                                                          •   Flexibility with no set
                                                                                                                                                                        monthly repayment if within
                •     NAB Rewards Business Signature Cards
                                                                                                                                                                        agreed limit
                •     NAB Business Cards
                •     NAB Low Rate Business Cards                                                                                                                   •   Ongoing access to
                •     NAB Qantas Business Signature Cards                                                                                                               overdraft, renewable
                                                                                                                                                                        annually

     (1)   On receipt of completed contract

45
MORE INNOVATIONS FOR OUR BUSINESS CUSTOMERS                                                                        DIGITAL FOR CUSTOMERS

               New mobile app                                                        HICAPS Go mobile app
               •    Launched July 2017                                              •      JV with health-tech start-up Medipass
                                                                                           Solutions launched September 2017
               •    Simplifies transaction and payment
                    authorisations                                                  •      Makes private health insurance claims
                                                                                           simple
               •    Reduces the number of steps needed
                    to authorise a payment by 40%                                   •      App facilitates appointment booking,
                                                                                           upfront health insurance quote and in-
                                                                                           app payment of insurance claims and
                                                                                           GAP payments
                                                                                    •      More than 500 health practitioners on
                                                                                           the platform with more to come

       MONTHLY NAB CONNECT APP DOWNLOADS                                       ON-BOARDED HEALTH PRACTIONERS

                                                                                                                 515
                                      >6,000

          4,500
                                                                                  193

          July 17                      Oct 17                                    Pilot                          Oct 17

46

LEVERAGING AI FOR OUR BUSINESS CUSTOMERS                                                                           DIGITAL FOR CUSTOMERS

 Australia’s first virtual business banker

                                                         •    Provides instant answers and assistance to questions derived
                                                              from thousands of real-life customer enquires
                                                         •    Launched September 2017
                                                         •    To date derived >13,000 variants on >200 questions

                                                         by FY20
                                                             EXPECTED REDUCTION IN RELATED CONTACT CENTRE CALLS
                                                                              AND BANK VISITS
                                                                                         ~1 million

                                                                       FY17                            FY20

47
NEW MOBILE APP OUR CONSUMER CENTREPIECE                                                                                       DIGITAL FOR CUSTOMERS

                                                         •     In December 2016 relaunched our mobile banking app
                                                         •     Tap and pay with NAB Pay and NAB PayTag
                                                         •     Instant Digital Card Provisioning
                                                         •     Consumer card controls and management:

                          MOBILE APP LOGINS                                              CUSTOMER USES OF CARD CONTROLS

                                              16%                                                                      38%

               FY14       FY15           FY16           FY17                     1Q17              2Q17          3Q17          4Q17

48

CUSTOMER DRIVEN FEATURES                                                                                                      DIGITAL FOR CUSTOMERS

 Overseas travel notification                                              Look Who’s Charging
                                 •   Customers share their                                                •    Customers can check vendor
                                     travel itinerary                                                          details – ‘who & where’ –
                                 •   Enhanced security for                                                     for recent transactions
                                     card transactions                                                    •    Leveraging strategic
                                 •   2x increase in customer                                                   partnership with ‘Look Who’s
                                     spend                                                                     Charging’
                                                                                                          •    Easily submit disputes
                                                                                                               electronically

                      CUSTOMER NOTIFICATIONS                                                       # CUSTOMER USES
               ~200,000
                200,000 notifications since launch                                      ~430,000
                                                                                         430,000 uses since launch
     300,000
                                                                              300,000

     200,000                                                                  200,000

     100,000                                                                  100,000

          0                                                                        0
                      Launch                  Sep 17                                       Jul 17             Aug 17         Sep 17

49
PARTNERING TO TRANSFORM PROPERTY SEARCH AND LENDING                                                                                                                                   DIGITAL FOR CUSTOMERS

     Strategic partnership with realestate.com.au
 •       Five year strategic partnership with
         realestate.com.au to offer NAB loan products
 •       Instant conditional approval powered by NAB’s
         Personal Banking Origination Platform (PBOP)
 •       REA branded customer contact centre supported
         by NAB
 •       Mortgage broking partnership established with REA
 •       Largest audience of property seekers in Australia –
         49.9m site visits per month1

     SEARCH                                                                                                      INTERACTIONS DRIVING APPLICATIONS
     •   Home Loan approvals linked to property search
     •   Fully featured home loan calculators available on
         realestate.com.au
                                                                                                                    ~15,000
                                                                                                                     15,000 per day
                                                                                                                        unique customers interacting with new NAB powered
     APPLY                                                                                                              home loan calculators
     •    Instant Conditional Approval
     •    Live chat and automatic call backs via REA branded
          customer contact centre supported by NAB                                                                 >660,000
     BUY                                                                                                                unique customers financial profiles created since
                                                                                                                        launch
     •    Home Loan specialists available providing customers
          with choice, options and support
 (1)     Nielsen Online Market Intelligence Home and Fashion Suite Average monthly visits for the audited sites of realestate.com.au for the year ended 30 June 2017. Excludes apps

50

ACCESS TO VOICE-ACTIVATED TECHNOLOGY                                                                                                                                                  DIGITAL FOR CUSTOMERS

‘Ok Google, Talk to NAB’
                                                                             •     First Australian bank to offer voice-activated experience via Google Home or a
                                                                                   smartphone with the Google Assistant

                                                                             •     Provides instant guidance on simple banking questions – such as how to replace
                                                                                   a lost card or reset a password

                                                                             •     Launched in six weeks via NAB Labs

                                                                             •     Continue to experiment with virtual assistants in order to provide real-time service
                                                                                   to customers in their channel of choice

51
DIGITAL SOLUTIONS FOR CORPORATE & INSTITUTIONAL CUSTOMERS                                                                                                                     DIGITAL FOR CUSTOMERS

     86% FX TRANSACTIONS NOW BOOKED DIGITALLY

                                           StarXchange                                               NAB Connect FX
                                       •      Fully automated, institutional                        •     FX dealing close extended from
                                              and global FX platform                                      7pm to midnight.                                                               86
                                                                                                                                                                         73
                                       •      In FY17, transaction size limits                      •     Functionality featured in new                   58
                                              increased and expanded                                      NAB Connect mobile app
                                              access to customers via new
                                                                                                    •     Transactions up 15% in FY17
                                              electronic distribution                                                                                    FY15          FY16             FY17
                                              channels
                                                                                                                                                        % FX transactions booked digitally

     MORE FY17 CUSTOMER SOLUTIONS                                                                                     FY18 DIGITAL ONBOARDING
                        additional currencies and swaps available across                                              •      Global digital onboarding platform for all C&IB customers to
       >20              our digital platforms for market making and
                        risk management
                                                                                                                             be rolled out in Australia early FY18 and globally mid FY18
                                                                                                                               •   better and more consistent visibility and tracking of
                                                                                                                                   clients globally enhances regulatory capture and
                        of Fixed Income settlements experience ‘straight                                                           reporting
     >90%               through processing’ after implementation of
                        payment automation                                                                                     •   improves customer experience by removing
                                                                                                                                   duplications in the onboarding process by
                                                                                                                                   business/region
                        of Asset Servicing customers migrated to new
           95%          digital system enabling daily access to complete
                        investment portfolio via iPad or smartphone

52

DIGITAL INITIATIVES IN NEW ZEALAND                                                                                                                                            DIGITAL FOR CUSTOMERS

     Mobile App                                                                                                      Digital Wallet
                                        •      New features in FY17 focused on                                                                      •   BNZ and Google jointly launched
                                               servicing:                                                                                               Android Pay in December 2016
                                                   •    Tax Payments                                                                                      •     First to market in New
                                                                                                                                                                Zealand
                                                   •    Automatic Payments
                                                                                                                                                          •     Enabled for debit and credit
                                                   •    Secure Messaging
                                                                                                                                                                card transactions
                                        •      One of the first banks globally to
                                                                                                                                                    •   Apple Pay launched in October
                                               adopt Android Pay setup from
                                                                                                                                                        2017
                                               within mobile app

                                   MOBILE APP USERS1                                                                                             DIGITAL SALES
                                                                                                                                             AS % OF RETAIL SALES2
                                               64%
                                                                                                                                                                               45%

                                                                                                                                                         39%

                                                                                                                                      34%

                         2014               2015            2016              2017                                                    FY15              FY16                  FY17

     (1)   Year to May 2017
     (2)   Includes all core retail product account opening, including account opening in Internet Banking and Mobile apps

53
PARTNERSHIPS IN NEW ZEALAND                                                                                                     DIGITAL FOR CUSTOMERS

 • BNZ has been selected as one of five               • In December 2015 BNZ made a 15.6%            • In September 2016 BNZ partnered with
       organisations globally as part of the Intel       investment in Figured Ltd, a cloud-based       Nomis Pricing Solutions as part of its
       Saffron Early Adopter Program (EAP)               farm accounting software provider              pricing capability transformation roadmap

 • Intel Saffron uses explainable Artificial          • Figured allows farmers to manage their       • Nomis is a global Fintech with offices in the
       Intelligence (AI) to help make confident          farming operations and, in real-time,          United States, Canada and more recently
       decisions. Associative memory AI finds and        connect with their accountants, farm           Australia
       fully explains multi-dimensional patterns         consultants and rural bankers on one
       across a company’s data                           platform                                    • Nomis have partnered with 20 of the top
                                                                                                        100 banks globally and specialise in
 • This partnership will allow BNZ to take            • This partnership allows BNZ to distribute       software that combines cutting edge silicon
       advantage of its existing big data platform       Figured software licenses to its               valley approaches to big data, advanced
       to gain increasingly sophisticated insights       agribusiness customers, with the licenses      modelling, and deep analytics to help
       for innovative customer service                   being free of charge until 1 October 2018      banks better understand their customers
                                                                                                        pricing needs and behaviours
 • The EAP is designed for institutions whose         • Customers can access planning and farm
       ambition is to lead the pack on innovation        budgeting tools integrated with Xero        • The customer-centric pricing technology
       in financial services by taking advantage of      software                                       enables the bank to develop online
       the latest advancements in associative                                                           personalised pricing solutions, assisting
       memory artificial intelligence                                                                   digitalisation of Products and Services in
                                                                                                        the future

54

INVESTING IN START-UPS GLOBALLY                                                                                                 DIGITAL FOR CUSTOMERS

 $50m investment fund NAB Ventures

     $500k - $5m investments            Often with co-investors                 Interest in fintechs…    or sectors with natural synergies

To date…
   date
                   1,000+ companies tracked → 250 potential opportunities → 5 investments

NAB benefits
     • Provides early access to innovative business models & technology and facilitates NAB thought leadership in
        the Fintech sector
     • Increases industry engagement through portfolio companies as well as their wider start-up ecosystem
     • Provides cutting edge technology to NAB customers
     • Supports deep relationships with investors, having led four investment rounds worth more than $60m with
        participation from Google Venture, Kleiner Perkins, Silicon Valley bank and Softbank

55
REDUCTION IN CRITICAL AND HIGH PRIORITY INCIDENTS                                                                                                                                                    DIGITAL FOR CUSTOMERS

 ‘CRITICAL’ AND ‘HIGH’ PRIORITY INCIDENTS1
      Investment in technology driving lower instance of technology incidents over FY14 – FY17
      • 85% reduction in “High” priority incidents
      • 82% reduction in “Critical” priority incidents
               45                                                                                                                                                                                                 600

               40
                                                                                                                                                                                                                  500
               35

               30                                                                                                                                                                                                 400

               25
                                                                                                                                                                                                                  300
               20

               15                                                                                                                                                                                                 200

               10
                                                                                                                                                                                                                  100
                 5

                 0                                                                                                                                                                                                0
                             1H14                    2H14                    1H15                    2H15                    1H16                    2H16                    1H17                    2H17
                                                                                           Critical (left axis)               High (right axis)

     (1)   Critical Incidents – Significant impact or outages to customer facing service or payment channels. High Incidents – Functionality impact to customer facing service or impact/outage to internal
           systems

56

           ADDITIONAL INFORMATION
           SERVING OUR COMMUNITY
NAB AT A GLANCE                                                                                                                                                               SERVING OUR COMMUNITY

                      ~33,000                                                     9.4 million                                ~1,000                                    >150 years
                     Employees                                                    Customers                        Branches/ Business centres                         in operation

     CASH EARNINGS DIVISIONAL SPLIT                                                                               Key Financial Data                                          FY17

                        Consumer                                                    Corporate &
                                                                                    Institutional
                                                                                                                  Cash Earnings                                          $6,642m
                        Banking &
                        Wealth 25%                                                  Banking 23%
                                                                                                                  Cash ROE                                                14.0%

                                                                                                                  Gross Loans & Acceptances                               $565bn
                                                                                     NZ Banking
                                                                                        13%
                                                                                                                  Non-performing loans to GLAs1                           70bps
                        Business &
                          Private
                       Banking 43%                                                                                CET1 (APRA)
                                                                              Corporate &                                                                                 10.1%
                                                                               Other (4%)
                                                                                                                  NSFR (APRA)                                             108%

     GROSS LOANS & ACCEPTANCES SPLIT                                                                              Australian Market Share                           As at September 17

                                                                                                                  Business lending2                                       21.4%
                                                                             Mortgages 58%

                                                                                                                  Housing lending2                                        15.7%
                   Personal Loans
                        2%
                                                                                                                  Personal lending3                                       10.6%

                                                                                                                  Cards2                                                  13.6%
                             Business                                                                            Credit Ratings          S&P AA-/A-1+       Moody’s Aa3/P-1      Fitch AA-/F1+
                            Loans 40%                                                                            NAB Ltd LT/ST           (negative)         (stable)             (stable)

     (1)    90 days past due & Gross Impaired Assets to Gross Loans & Advances
     (2)    APRA Monthly Banking Statistics
     (3)    Personal loans business tracker reports provided by RFI (September 2017), represents share of RFI defined peer group data

58

NAB’S ROLE IN THE COMMUNITY                                                                                                                                                   SERVING OUR COMMUNITY

                                                                                                    NAB REVENUE
                                                                                Supports all stakeholders and business partners
                                                                    Is shown after interest payments to 4.6 million Australian and
                                                                    New Zealand retail and business deposit customers who have
                                                                                 deposited over $390 billion with us

 BORROWERS                                                                                          Retained
                                                                                                    as capital
                                                                                                                          Non
                                                                                                                       personnel
                                                                                                                                                    SUPPLIERS & COMMUNITY
           Total of over $330 billion in                                                                                                                +1,800 supplier agreements
                                                                                                      $1.7bn            expense
           Home Lending and $236 billion in                                                                                                             +26,000 microfinance loans provided
           Business Lending                                                                                                $3.3bn
                                                                                                                                                        Carbon neutral since 2010, 75% of
           $1.7 billion retained as capital to                                                                                                          Australian key office buildings4 are
           support new lending and further                                                                                                              Green Star Rated
           strengthen capital position to                                      Dividends2
           meet future regulatory
           requirements                                                            $5.3bn
                                                                                                    NAB REVENUE1
                                                                                                       $17.1bn
                                                                                                                                        Personnel
                                                                                                                                         expense

 SHAREHOLDERS                                                                                                                           $4.3bn             OUR PEOPLE
 (INCL. SUPER FUNDS)                                                                                    Taxes paid3
                                                                                                                                                              Employ over 33,000 people5
                                                                                                                                                              Over 50% of our workforce
           Over 571,000 shareholders
                                                                                                          $2.5bn                                              directly engages with
           79% of NAB’s cash profits                                                                                                                          customers
           distributed in dividends

       Figures based on NAB’s FY17 cash earnings
       (1) Revenue shown net of $0.8bn of bad and doubtful debts
       (2) Dividends declared in respect of FY17
                                                                                               GOVERNMENT
       (3) Includes income tax, GST, FBT, payroll tax and other taxes borne by NAB that were        Australia’s fourth largest income tax payer
            paid during the year ended 30 September 2017
       (4) ‘Key office buildings’ are all NAB commercial tenancies over 4,000m2
       (5) Represents full time equivalent employees as at 30 September 2017 for NAB Group
                                                                                                    Signatory to the Voluntary Tax Transparency Code
59
BACKING OUR CUSTOMERS                                                                                                                                                                                                             SERVING OUR COMMUNITY

     IN FY17                                                                                                                            MAKING BANKING SIMPLER AND EASIER
 •           $80 billion in new home lending1                                                                                           In FY17 we:

 •           $80 billion in new lending to business, backing the growth of                                                              •        Overhauled and simplified standard business contracts for
             the Australian and New Zealand economies2                                                                                           130,000 Small Business owners

 •           $394 billion in deposits managed for retail and business                                                                   •        Reduced the application time for Everyday Accounts for
             customers                                                                                                                           consumer banking customers to seven minutes

 •           $195 billion in assets under management – helping
                                                                                                                                        •        Introduced a 24/7 digital virtual banker for business
                                                                                                                                                 customers
             customers plan and save for their retirement
                                                                                                                                        •        Addressed 215 Customer Pain Points, improving over 24
                                                                                                                                                 million customer interactions

     NAB ASSIST – SUPPORTING CUSTOMERS IN HARDSHIP                                                                                       PRIORITY SEGMENTS NET PROMOTER SCORE V PEERS4
     •           97% of customers back on track with repayments 90 days                                                                     -5
                 after receiving assistance
                                                                                                                                         -10                                                                                                             -13
     •           +69 average net promoter score of customers after receiving                                                                                                                                                                             -14
                                                                                                                                         -15
                 financial hardship assistance3                                                                                                                                                                                                          -14
                                                                                                                                         -20                                                                                                             -20
                    Number of customers provided with hardship assistance
                                                                                                                                         -25

                                                                                                                                         -30
                                                          21,303                                                                                 Sep Dec Mar Jun Sep Dec Mar Jun Sep Dec Mar Jun Sep Dec Mar Jun Sep
                         20,174                                                              19,652                                               13 13 14 14 14 14 15 15 15 15 16 16 16 16 17 17 17

                                                                                                                                                            NAB                       Peer 1                      Peer 2                       Peer 3
                          FY15                             FY16                               FY17
           (1)    Drawdowns (excluding redraws) by Australian and New Zealand customers
           (2)    For new and increased (on and off balance sheet) commitments by Australian and New Zealand customers. New lending has been derived from year on year customer limit movements
           (3)    Refers to the Operational NPS for the respective experiences. Operational NPS is derived from surveys sent by NAB to NAB customers who have recently gone through the respective experiences
           (4)    Priority Segments Net Promoter Score (NPS) is a simple average of the NPS of four priority segments: NAB defined Home Owners, Investors, Small Business ($0.1m-
BACKING OUR PEOPLE WITH ‘THE BRIDGE’                                                                                                                             SERVING OUR COMMUNITY

                                                         •     Help our people move from ‘our’ place to the next place
                                                         •     Reflecting NAB’s purpose, we’ll provide care, commitment and coaching to
                    Our intent                                  • embrace new opportunities
                                                                • learn new skills
                                                                • prepare them to be future ready

                                                         •     Provide market leading, world-class career and wellbeing services for people leaving NAB
                  Our offering                           •     Increasing our investment per individual to ensure they are properly set up for a future
                                                               outside of NAB

                                                                                                                                           Active Job
                                                               Career         Health &       Financial           Re-skilling                                    Small
                                                                                                                                              and
                The elements                                 Planning &       Wellbeing      Planning           and Training                                 Business Set
                                                                                                                                          Volunteering
                                                              Coaching        Benefits       Services             Access                                      Up Support
                                                                                                                                           Placement

62

 CONTRIBUTION TO SHAREHOLDERS                                                                                                                                     SERVING OUR COMMUNITY

     NAB’S SHAREHOLDERS                                                                       TOTAL SHAREHOLDER RETURN1,2
     • >571,000 shareholders                                                                                                  2nd

     • 97% in Australia and New Zealand
     • Providing returns to millions of Australians through                                             4th
           superannuation funds                                                                                           69.9%                      1st                   1st

     • 79% of NAB’s cash profits distributed in dividends in                                          31.2%
           FY17                                                                                                                                    21.0%                 20.1%

                                                                                                      10 YEAR            5 YEAR                    3 YEAR                1 YEAR

     SHAREHOLDERS BY REGION                                                                   ANNUAL DIVIDENDS DECLARED3 ($BN)

                   Rest of World
                        3%

                                                                                                                                                                   5.0    5.2     5.3
             New Zealand                                                                                                                          4.5      4.7
                                                                                                                                    3.8     4.1
                 2%                                                                                      3.3           3.2
                                                                           Australia 95%        3.0             2.9

                                                                                               FY07     FY08    FY09   FY10     FY11       FY12   FY13     FY14   FY15   FY16     FY17

     (1)   Source: IRESS. TSRs to 30 September 2017
     (2)   NAB TSR rankings in dotted boxes are against major bank peers
     (3)   Dividends declared in respect of each financial year

63
MOVING AUSTRALIA FORWARD                                                                                                                                                                       SERVING OUR COMMUNITY

     DRIVING THE ECONOMY                                                                                             SOCIAL IMPACT
     TOTAL LENDING (EAD $974.3bn) BY ANZSIC             INDUSTRY1                                                    •     26,775 microfinance loans provided in 2017 (+ 17% YoY)

                        8%
                             1%    6%
                                                             Accommodation, cafes, pubs and restaurants              •     Three ‘Good Money’ stores launched – Morwell, Cairns,
                                        2%
                                                             Agriculture, forestry, fishing and mining                     Gold Coast – providing one-stop financial counselling and
            3%    2%                         8%              Business services and property services                       products
                                                             Commercial property
                                                  1%
                                                             Construction                                            •     Launched pilot digital microfinance offering ‘Speckle’2
                                                             Finance and insurance
                                                             Manufacturing                                           AUSTRALIANS SUPPORTED WITH                              NUMBER OF MICROFINANCE LOANS
                                                             Personal                                                MICROFINANCE PRODUCTS (CUMULATIVE)                      PROVIDED
      39%
                                                             Residential mortgages                                                                                                                           26,775
                                                  26%
                                                             Retail and wholesale trade                                                                      513,941            23,475          22,886
                                                             Transport and storage
                              2%        2%                   Other

                                                                                          3
                                                                                                                       9,314
      INFRASTRUCTURE PROJECT                               TOTAL TAXES PAID ($bn)
      FINANCING (GLAs $bn)
                                         11.3                                                                                                                                    2015            2016         2017

                          10.1                                                                                     •      NAB Foundation provided over $1.4 million in grants to
            9.7                                                                                                           organisations helping to address domestic and family
                                                                2.6            2.9                                        violence, and in recovering from financial shocks. Grants
                                                                                              2.5
                                                                                                                          now open to support sustainable regions

                                                                                     4
           FY15           FY16           FY17                 FY15           FY16             FY17

     (1)   Industry classifications are aligned to those disclosed in Pillar 3 report – Table 5.1D
     (2)   Speckle is the branded digital microfinance offering of Good Shepherd Microfinance, supported by NAB. The offering provides small loans to customers who need access to finance. Pilot launch
           taking place in Victoria and Tasmania
     (3)   Includes income tax, GST, FBT, payroll tax and other taxes borne by NAB that were paid during the year ended 30 September 2017
     (4)   As per Tax Transparency report for the year ended 30 September 2016
64

CORPORATE RESPONSIBILITY                                                                                                                                                                        SERVING OUR COMMUNITY

     OUR APPROACH TO CORPORATE RESPONSIBILITY
 Corporate responsibility is about getting the basics right, balancing the risks and opportunities affecting our ability to continue to create
 long-term value for our customers, employees, shareholders and community, and investing in social challenges where we can drive
 significant impact:

                       FINANCIAL INCLUSION                                                               SOCIAL COHESION                                                  ENVIRONMENTAL WELLBEING

                   513,000+
         low income Australians assisted with
                                                                                                         16,000+                                                          $13.4 billion
                                                                                                                                                               in financing to help address climate change and
                                                                                         volunteer days contributed by our people in
     microfinance products and services since FY05                                                                                                             support the transition to a low carbon economy
                                                                                                            FY17
                                                                                                                                                                             since 1 October 2015

     EXTERNAL ASSESSMENTS OF NAB’S ESG PERFORMANCE1
 •          NAB is committed to transparency and disclosure across our
            operations

 •          During the year, NAB has continued to be recognised as a
            leader in ESG performance through external assessments.
            These range from overall ESG assessments, to specific
            areas such as gender or climate disclosure

 (1) Further information on: (I) the initiatives NAB participates in, and (II) external assessments of NAB’s ESG performance, is available on our website:
     http://www.nab.com.au/about-us/corporate-responsibility/responsibility-management-of-our-business/performance-and-reporting/memberships-commitments-and-recognition

65
You can also read