FUNDING PUBLIC EDUCATION - through Stewardship of Natural Resources Jodi Smith, Commissioner North Dakota Department of Trust Lands
←
→
Page content transcription
If your browser does not render page correctly, please read the page content below

FUNDING PUBLIC
EDUCATION
through Stewardship of
Natural Resources
Jodi Smith, Commissioner
North Dakota Department of Trust Lands
THE ENABLING ACT OF 1889

 The United States
 government granted
 the state of North
 Dakota 3.2 million acres
 of land to be used
 specifically for funding
 public education.
MISSION & VISION

 MISSION
 The mission of the Board of University and School Lands is to prudently and professionally,
 manage assets of the permanent trusts in order to preserve the purchasing power of the funds,
 maintain stable distributions to fund beneficiaries, and manage all other assets and programs
 entrusted to the Board in accordance with the North Dakota Constitution and applicable state law.

 VISION
 The Department of Trust Lands is known nationally for superior management of its land and
 mineral assets, unclaimed property, energy grant distributions, and investment portfolio.
BOARD OF UNIVERSITY AND SCHOOL LANDS

 Management of School
 Trust Lands is
 entrusted to the North
 Dakota Department of     Chairman Governor      Vice Chairman Secretary        Attorney General
                            Doug Burgum              of State Al Jaeger         Wayne Stenehjem
 Trust Lands under
 direction of the Board
 of University and
 School Lands.

                                        State Treasurer        Superintendent of Public
                                        Thomas Beadle         Instruction Kirsten Baesler
SURFACE
MANAGEMENT
DIVISION
Mike Humann, Division Director
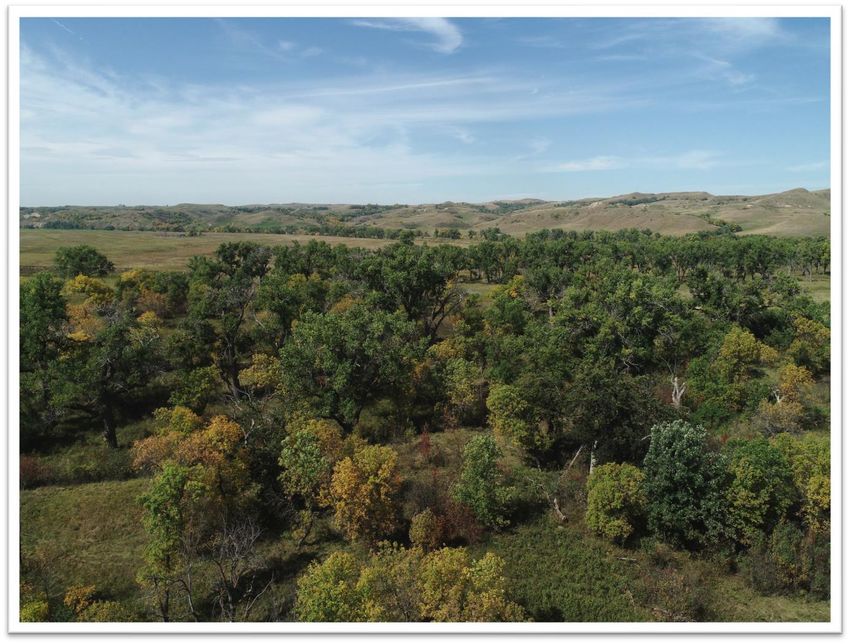
SURFACE MANAGEMENT DIVISION

The Surface Management Division
manages more than 706,000 surface
acres held in trust for various schools
and institutions. The division obtains
fair market value returns or royalties
for use of these resources.
SURFACE MANAGEMENT RESPONSIBILITIES

 • Processing easements and surface            • Noxious weed control
   damage agreements                           • Public access
 • Surface leasing (97% grassland leases)      • Grazing land inspections
 • Construction aggregate leasing              • Flood inspections
 • Reclamation of oil well sites, pipelines,   • In-lieu taxes and roads and bridges fee
   roads, coal and construction                • Acquired properties management
   aggregate impacted lands range              • Land sales
   improvement – grazing management
 • Permanent improvements – livestock
   water developments
SURFACE MANAGEMENT FAST FACTS

• 280 rights of way granted
  in the 2019-21 biennium
• More than 1,500 annual
  integrity and reclamation
  inspections
• More than 1,200 active
  pipelines
• Currently, about 5,000
  active surface land leases

                               Photo credit: NDDTL drone footage
EXPANDED ACCESS TO ROW AGREEMENTS

  • A new IT system soon to be launched by the NDDTL will expand access to right of
    way agreements on the department’s website.
  • Right of way transactions conducted on the website will include:
      • Submitting applications online
      • Tracking right of way status
      • Viewing and tracking right of way payment invoices
      • Viewing rights of way linked to an account
      • Managing an account from a mobile device

  • The new IT system will replace hardware built in 1988 and in danger of failing.
    Updates and fixes to the current system are no longer available.
SOIL CARBON STORAGE • Working group led by the Baker Institute at Rice University • Remove carbon dioxide from atmosphere and store it in the soil as organic carbon • Primary source of storage will be grasslands
MINERALS
MANAGEMENT
DIVISION
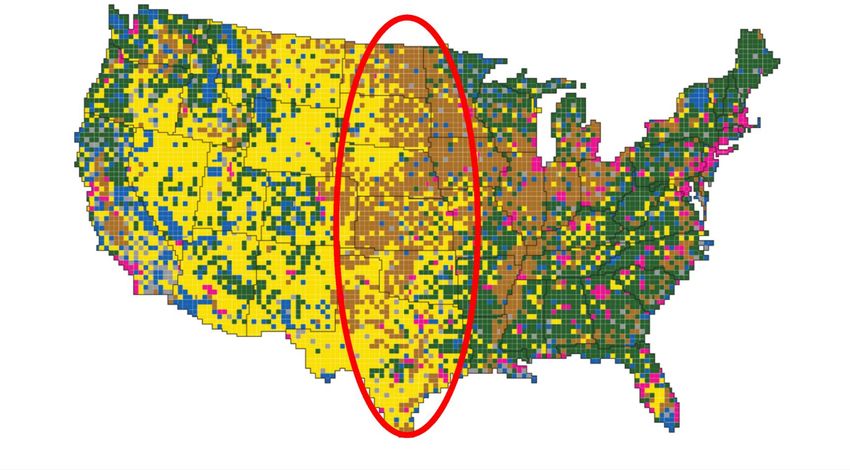
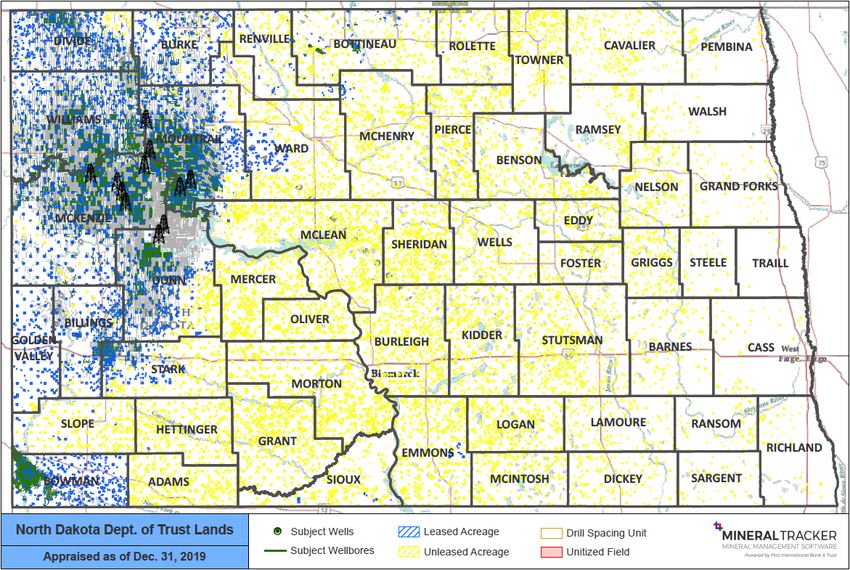
MINERALS MANAGEMENT DIVISION

The Minerals Management Division oversees 2.6 million mineral acres and
administers mineral interests held in trust by various schools and institutions,
minerals under navigable rivers and lakes, and mineral interests formerly
owned by the Bank of North Dakota and the Office of the State Treasurer.

The division leases oil, gas, coal, potash and other mineral assets for
production, ensuring ownership integrity of the mineral asset. The division
manages leasing, drilling, and mining activity to ensure Land Board rules and
terms are followed.
MINERALS MANAGEMENT DIVISION

 NDDTL currently
 manages interest
 in 7,613 producing
 properties.
 This equates to
 more than 45% of
 the 16,618
 producing wells in
 North Dakota.
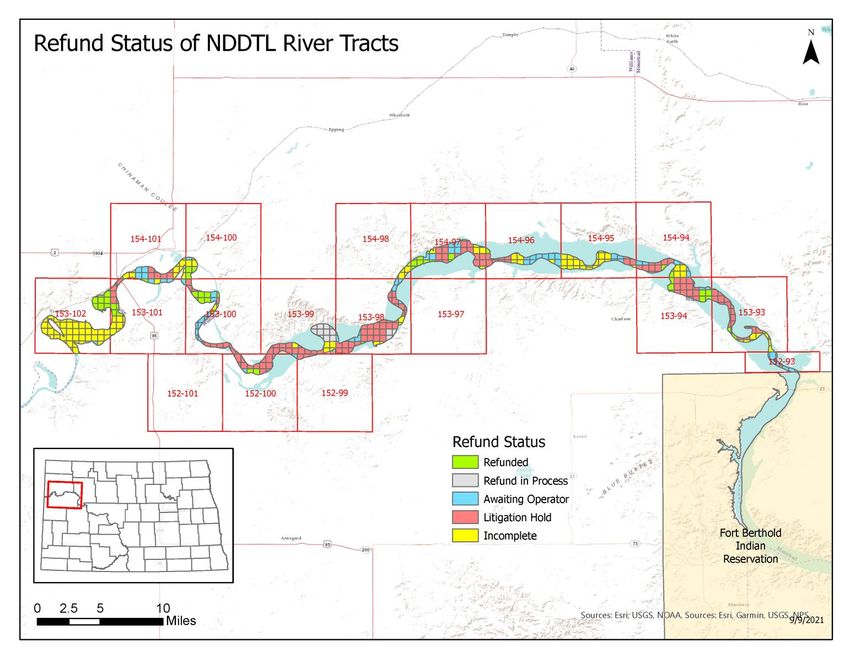
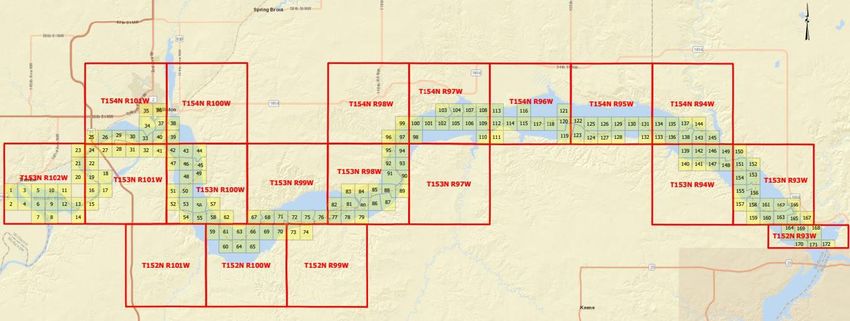
ACREAGE ADJUSTMENT SURVEY

As directed by the 2017 ND Legislative Assembly, the Department of
Mineral Resources reviewed US Army Corp of Engineers survey segments
from the northern boundary of the Fort Berthold Indian Reservation to the
southern border of Sections 33 and 34, Township 153 N, Range 102 W.

The purpose of the survey was to define state ownership of minerals on
sovereign lands.
HISTORY OF SOVEREIGN LANDS

 In 2017, the ND Legislative
 Assembly adopted Senate
 Bill 2134 and established
 state ownership of minerals
 below the ordinary high-
 water mark of the historical
 Missouri riverbed channel
 (Historical OHWM)
 inundated by Pick-Sloan
 Missouri Basin project dams.
HISTORY OF SOVEREIGN LANDS

In 2019, the ND Legislative Assembly
amended NDCC Ch. 61-33.1 related to
ownership of mineral rights on land
subject to inundation by Pick-Sloan
Missouri Basin project dams. The Land
Board contracted with KLJ:
 “… to analyze the final review findings
  and determine the acreage on a
  quarter-quarter basis or government
  lot basis above and below the
  [Historical OHWM] as delineated by
  the final review findings of the
  industrial commission.”
ADOPTION OF ACREAGE ADJUSTMENT

On June 25, 2020, the Land Board adopted the majority of the Acreage Adjustment Survey.
ACREAGE ADJUSTMENT HURDLES

 • Clouded Titles
 • Bankruptcies
 • Failure to File
    Assignments
VALUATION SUMMARY INCOME APPROACH Provides an indication of the value by converting future cash flows to a single current capital value. MARKET APPROACH Provides an indication of value by comparing the subject asset with identical or similar assets for which price information is available. Mineral Estate Valuation as of Dec. 31, 2019: $1,449,002,408.00
ASSET HIGHLIGHTS: COUNTIES

              CURRENT WELL        DTL NET M INERAL      APPRAISE D
COUNTY
                 COUNT                 ACRES              VALUE

MCKENZIE                2,508                 161,184     $608,484,525
MOUNTRAIL               2,159                  99,464     $244,573,582
                                                                         OTHER
WILLIAMS                1,548                  92,062     $231,579,222                                          ACREAGE EXPOSURE
DUNN                     861                   97,214     $200,633,596                                             BY COUNTY
BOWMAN                       22                61,219      $55,354,279
DIVIDE                   463                   71,913      $34,871,862
STARK                    177                   54,320      $13,240,596
BURKE                    151                   50,451      $12,103,827
                                                                                                                 SLOPE
BILLINGS                 131                   58,108      $29,455,838                                WARD                    MCKENZIE

BOTTINEAU                    31                36,989       $5,628,651                     MCHENRY
                                                                                    G. VALLEY                                            MOUNTRAIL
MCLEAN                       19               124,618       $6,059,432
                                                                                 RENVILLE
RENVILLE                     22                24,455        $716,961
G. VALLEY                    13                41,863       $2,680,902
MCHENRY                      2                 66,693        $289,173                                                                         WILLIAMS
                                                                                 MCLEAN
WARD                         2                 73,951         $62,143
SLOPE                        1                 52,446       $1,871,501           BOTTINEAU                                                  DUNN
OTHER                        0              1,431,046       $1,396,318                    BILLINGS
                                                                                                                                   BOWMAN
                                                                                                     BURKE
GRAND TOTAL             8,110               2,597,998   $1,449,002,408                                       STARK       DIVIDE
ASSET HIGHLIGHTS: OPERATORS
CURRENT DTL NET APPRAISED
OPERATOR
WELL COUNT* MINERAL ACRES VALUE
CONTINENTAL 1,063 64,273 $281,186,631
WHITING 1,028 42,145 $122,956,341
HESS 917 47,170 $132,776,136
CONOCOPHILLIPS 545 15,831 $106,700,247 ACREAGE EXPOSURE
OASIS 490 24,461 $67,574,422 BY OPERATOR
MARATHON 472 18,914 $97,330,285
XTO 457 35,435 $138,670,895
EQUINOR 361 17,343 $61,776,611
SLAWSON 324 14,419 $61,685,125
EOG 321 13,750 $25,193,266
UNDEVELOPED
PETRO-HUNT 297 21,967 $31,982,283
MUREX CONTINENTAL
QEP 198 5,896 $26,655,729 CRESCENT POINT RESOURCES
OTHER
LIME ROCK 160 13,389 $17,289,249 KRAKEN
OVINTIV 133 4,133 $22,320,508 NINE POINT
WHITING
BRUIN 122 12,279 $13,258,123 RESOURCE
RESOURCE ENERGY 116 6,477 $4,468,581 ENERGY
NINE POINT 108 3,824 $7,480,854 BRUIN
OVINTIV HESS
KRAKEN 100 7,107 $25,206,864
CRESCENT POINT 78 6,957 $11,336,635 LIME ROCK CONOCOP
MUREX 73 8,142 $13,707,385 HILLIPS
QEP OASIS
OTHER 747 88,236 $141,344,139 EOG
PETRO-HUNT MARATHON
UNDEVELOPED - 2,125,850 $38,102,100 SLAWSON XTO
EQUINOR
GRAND TOTAL 8,110 2,597,998 $1,449,002,408MINERAL TRACKER FEATURES • Revenue estimate comparison • Decline curve forecasts • Summarize by operator • Detail down to the individual well level • Interactive mapping
DEFERRED PRODUCTION CHART

• Illustrates a growing
                                                        600,000                                                                                               2,500

  number of hard and soft                               500,000
                                                                                                                                                              2,000

  shut-ins from April-June
                                                        400,000
  2020, resulting in

                                Monthly Net Oil (BBL)
                                                                                                                                                              1,500

                                                                                                                                                                      Wells Shut-In
  decreased production                                  300,000

• 45% of net production                                 200,000
                                                                                                                                                              1,000

  was deferred in June 2020
                                                                                                                                                              500
                                                        100,000

• Results in significant loss
  of revenue                                                 -
                                                                     1/1/2020     2/1/2020   3/1/2020   4/1/2020   5/1/2020        6/1/2020      7/1/2020
                                                                                                                                                              -

                                                                  Hard Shut-Ins         Soft Shut-Ins      Historical Production              Deferred Production
FORECAST IN LOST REVENUES
The cumulative forecasted revenues for the various scenarios
considered herein for oil production from August 2020 through
June 2021 is detailed in the table below.
August 2020 - June 2021 | Royalties
Oil Price $50/BBL $45/BBL $40/BBL $35/BBL $30/BBL $25/BBL $20/BBL
0% Deferred $209M $190M $170M $150M $130M $110M $90M
10% Deferred $188M $171M $153M $135M $117M $99M $81M
20% Deferred $168M $152M $136M $120M $104M $88M $72M
30% Deferred $147M $133M $119M $105M $91M $77M $63M
40% Deferred $126M $114M $102M $90M $78M $66M $54MWHAT’S NEW? A new NDDTL IT System coming this fall! • Phase One will focus on surface management transactions conducted on the NDDTL website, including expanded access to right of way agreements. • In 2022, Phase Two will improve access to mineral transactions, including oil and gas leases and related documents.
INVESTMENT
DIVISION

Mike Shackelford, Division Director
INVESTMENT DIVISION
OTHER FUNDS

 Strategic Investment and Improvement Fund
 • Minerals under navigable rivers and lakes are also included in this
   fund.
 • By statute, the SIIF receives a portion of the state’s share of oil and
   gas production and extraction taxes. During the 2017-19 biennium,
   the SIIF share was more than $780 million.
 • One-time expenditures are used to improve state infrastructure.
IMPACTING NORTH DAKOTANS

• NDDTL manages $6.8 billion in total investment assets as of June 30, 2021
  (unaudited).
• $183,378,000 was distributed to K-12 and public higher education in 2021.
• $1,605 per-pupil, per-year funding was provided for K-12 students in 2021.
• A staff of just 30 manages all assets under the discretion of the Board.
• As established in the North Dakota Constitution, the NDDTL is self-funded and
  does not receive state general funds.
THANK YOU FOR YOUR INTEREST!

Jodi Smith, Commissioner
North Dakota Department of Trust Lands
land.nd.gov
701.328.2800
You can also read