FY 2021 RESULTS - PharmaBiz.NET
←
→
Page content transcription
If your browser does not render page correctly, please read the page content below
FY 2021 RESULTS
FY 2021 RESULTS

Disclaimer

Cautionary note concerning forward-looking statements
This presentation contains statements with respect to the financial            Group’s control. Among other risks and uncertainties, the material or
condition, results of operations and business of the Reckitt group of          principal factors which could cause actual results to differ materially are:
companies (the “Group”) and certain of the plans and objectives of the         the general economic, business, political and social conditions in the key
Group that are forward-looking statements. Words such as ‘‘intends’,           markets in which the Group operates; the ability of the Group to manage
‘targets’, or the negative of these terms and other similar expressions of     regulatory, tax and legal matters, including changes thereto; the reliability
future performance or results, and their negatives, are intended to identify   of the Group’s technological infrastructure or that of third parties on which
such forward-looking statements. In particular, all statements that express    the Group relies; interruptions in the Group’s supply chain and disruptions to
forecasts, expectations and projections with respect to future matters,        its production facilities; the reputation of the Group’s global brands; and the
including targets for net revenue, operating margin and cost efficiency, are   recruitment and retention of key management.
forward-looking statements. Such statements are not historical facts, nor      These forward-looking statements speak only as of the date of this
are they guarantees of future performance.                                     announcement. Except as required by any applicable law or regulation, the
By their nature, forward-looking statements involve risk and uncertainty       Group expressly disclaims any obligation or undertaking to release publicly
because they relate to events and depend on circumstances that will occur      any updates or revisions to any forward-looking statements contained
in the future. There are a number of factors that could cause actual results   herein to reflect any change in the Group’s expectations with regard
and developments to differ materially from those expressed or implied by       thereto or any change in events, conditions or circumstances on which any
these forward-looking statements, including many factors outside the           such statement is based.

                                                                                                                                                                 2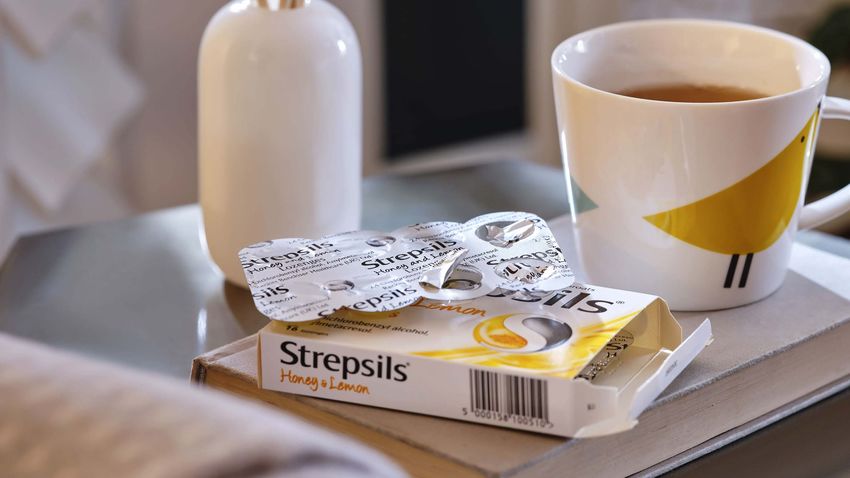
LAXMAN
NARASIMHAN
Chief Executive Officer
FY 2021 RESULTS

Key messages

STRONG MOMENTUM                MANAGING THE PORTFOLIO          TRANSFORMATION FIRMLY
IN 2021                        FOR HIGHER GROWTH               ON TRACK
Targeting revenue growth and   9% portfolio turnover through   Stronger business, well-
margin expansion in 2022       targeted acquisitions and       positioned to deliver medium
                               divestitures                    term targets

                                                                                              4
AGENDA   2021 highlights

         Financial review
         & outlook

         Strategic update

                            5
FY 2021 RESULTS

2021 highlights – strong momentum

                                                                    LFL net revenue growth1                                                                                    2-year stacked
                                                                                                                                                                          LFL net revenue growth1,2

                                                                                       3.5%                                                                                               17.4%
                              MARKET SHARE                                                                                                    EXECUTION                                                 SUSTAINABILITY

                             +62%                                                                                           +20% pts                                                                      66%
                                                                                                                                                                                                                                   2030
                                                                                                                                                                                                                                target
                                                                                                                                                                                                                               achieved

                         of core CMUs holding /                                                                                 Improvement in                                                    absolute carbon reduction from
                              gaining share                                                                               customer relationship scores3                                               operations since 20154

1 – Refer to adjusted measures presented within the FY 2021 Results announcement | 2 – 17.4% two-year stack based upon excluding IFCN China from both 2021 and 2020 LFL calculation
3 – Based on Advantage Group 2021 survey of retailers. 20% pts increase in markets rated top-tier from 26% in 2020 to 46% in 2021 | 4 – Meeting our 2030 science-based target ahead of schedule
                                                                                                                                                                                                                                          6
FY 2021 RESULTS

2021 highlights1 - underlying momentum across the portfolio is strong

c.70%
of the portfolio less impacted
by COVID dynamics2                                                                                                                            MSD growth in each quarter
                                                                                                                                              Average 2021 growth: >5%

                                                                                                                                 >5%
                                                                                                                                 LFL growth
                                                                                                                                  vs. 2020

                                                                                                                                               2021 Q1    2021 Q2    2021 Q3   2021 Q4

1 – All adjusted to exclude IFCN China | 2 – Remaining 30% of portfolio comprises Lysol, Dettol, Mucinex, Strepsils and Lemsip

                                                                                                                                                                                         7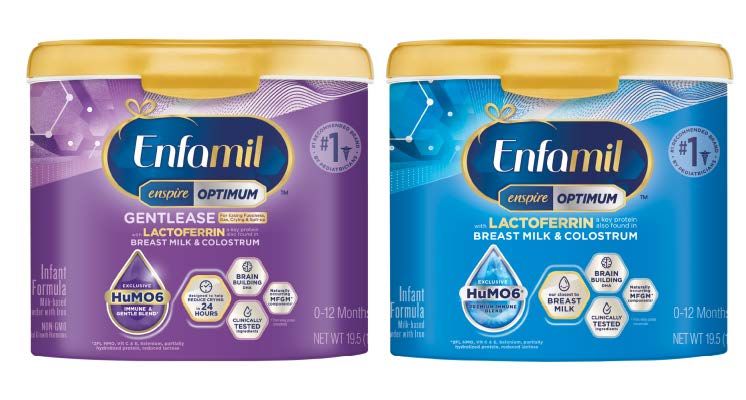
JEFF CARR
Chief Financial Officer

FY 2021 RESULTS

Net revenue

Group 2021 LFL revenue growth1                                                                                                                      Group FY LFL revenue growth1
                                                                                               2-year stacked LFL growth1
                                                                                                                                                                +3.5%
                                                                                                            27.0%
                                                                                                                                                     Volume             Price / Mix

                                                                                                17.4%                                                +0.6%               +2.9%
                                                                                                                        12.0%                     2-year stack LFL revenue growth1

      3.5%
                               7.5%
                                                                                                                                     6.0%                     +17.4%
                                                                                   0.6%                                                          eCommerce sales         Q4 LFL1
                                                       (0.1)%
                                                                                                                                                      +17%               +3.3%
       Group                   Hygiene                    Health                   Nutrition     Group      Hygiene         Health   Nutrition   12% of FY revenue

1 - Refer to adjusted measures presented within the FY 2021 Results announcement

                                                                                                                                                                                      9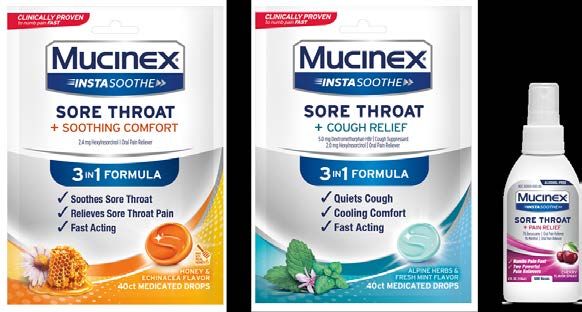
FY 2021 RESULTS

Group margins1
                                                                                                                                                              FY                    Change
£m                                                                                                                                                    2021         2020     Actual FX   Constant
                                                                                                                                                                                             FX2

Net Revenue2                                                                                                                                         12,851        13,132      (2.1)%         3.3%

  LFL growth                                                                                                                                          3.5%         13.9%

     Gross Margin %                                                                                                                                  58.5%         60.5%    (200)bps

     BEI %2                                                                                                                                          12.6%         13.2%       60bps

     Other Costs %                                                                                                                                   23.0%         22.8%     (20)bps

Adjusted Operating Profit2                                                                                                                           2,944         3,216       (8.5)%        (2.6)%

   Adjusted Operating Profit Margin2                                                                                                                 22.9%         24.5%     (160)bps

1 – All amounts shown exclude IFCN China for both 2021 and 2020 | 2 – Refer to adjusted measures presented within the FY 2021 Results announcement

                                                                                                                                                                                                  10
FY 2021 RESULTS
Margin bridge1
(200)bps
24.5% 60bps (20)bps
22.9%
AOP 2020 ex Change in Change in AOP 2021 ex
Change in BEI
IFCN China gross margin other costs IFCN China
1 – All excluding IFCN China
11FY 2021 RESULTS
Cost inflation c. 11% in 20211
MATERIALS (C.70%) CONVERSION
K-Y (C.20%) LOGISTICS (C.10%)
Low double digit Mid single digit Double digit Total COGS1
£5.3bn
growth in 2021 growth in 2021 growth in 2021
Materials contribute towards Factory costs Freight and other logistics
c. 60% of COGS inflation
Average market price increase 2021 vs Conversion cost inflation: Global ocean freight yoy %3:
20202:
Labour and energy
Crude oil 69%
Mid single digit growth
Surfactants China to North America 152
61% Materials
Plastic 56% China to Europe 60 Logistics
Soap noodles 56%
Global composite index 79 Conversion
Tin plate 56%
Dairy 31%
1 – Excluding IFCN China | 2 – Commodity prices sourced from relevant market indices or exchanges | 3 – Drewry prices at 3 February 2022 China (Shanghai) to North America (Los Angeles), China (Shanghai) to Europe (Rotterdam)
12FY 2021 RESULTS
Hygiene
LFL revenue growth1 by quarter FY 2021
28.5% LFL revenue growth1 Volume Price / Mix
+7.5% +5.1% +2.4%
2-year stack LFL Net Revenue
£5,911m
7.8% revenue growth1
2.9%
+27.0% PY: £5,816m
AOP1 AOP Margin1
£1,401m 23.7%
(6.1)%
Q1 Q2 Q3 Q4
(1.3)% at constant FX (220)bps
1 – Refer to adjusted measures presented within the FY 2021 Results announcement
13FY 2021 RESULTS
Health
LFL revenue growth1 by quarter FY 2021
17.5%
LFL revenue growth1 Volume Price / Mix
(0.1)% (2.1)% +2.0%
3.6%
2-year stack LFL Net Revenue
£ 4,646m
revenue growth1
(5.6)% +12.0% PY: £4,890m
(14.1)%2 AOP1 AOP Margin1
Q1 Q2 Q3 Q4
£1,187m 25.5%
(5.5)% at constant FX (180)bps
1 – Refer to adjusted measures presented within the FY 2021 Results announcement | 2 – Health Q1 2021 LFL net revenue growth restated for the disposal of Scholl
14FY 2021 RESULTS
Nutrition1
LFL revenue growth2 by quarter FY 2021
3.8% 3.8%
LFL revenue growth2 Volume Price / Mix
1.6%
+0.6% (4.9)% +5.5%
2-year stack LFL Net Revenue
£2,294m
revenue growth2
+6.0% PY: £2,426m
AOP2 AOP Margin2
(5.3)%
Q1 Q2 Q3 Q4
£356m 15.5%
+2.4% at constant FX Unchanged
1 – Nutrition performance presented excludes IFCN China for the current and prior periods | 2 – Refer to adjusted measures presented within the FY 2021 Results announcement
15FY 2021 RESULTS
Total adjusted EPS bridge
327.0p (12.1)p
(9.0)p
(20.3)p (0.1)p
288.5p
2020 IFCN China IFCN China AOP Finance Tax / NCI FX Dilution 2021
trading exit costs expense
16FY 2021 RESULTS
Free cash flow generation
£m FY 2021 FY 2020 Change Expect 2022 capital
expenditure c.4.0% of
Adjusted operating profit1 2,877 3,301 (424)
net revenue (3.3% in 2021)
Depreciation and share-based payments 401 407 (6)
Capital expenditure (441) (476) 35 Working capital
unwinding from 2020
Movement in working capital and provisions (356) 895 (1,251)
Exceptional cash flow1 (86) (46) (40) Excluding one-time costs
Interest paid (222) (267) 45 and tax costs for IFCN China,
free cash flow is c. £1.5bn
Tax paid (915) (762) (153)
Free Cash Flow1 1,258 3,052 (1,794) Continue to expect strong
cash flow conversion
Free Cash Flow Conversion1 61% 131% (70)%
1 – Refer to adjusted measures presented within the FY 2021 Results announcement
17FY 2021 RESULTS
Net debt
2.4X 2.6X
Net Debt/ Adj. EBITDA1:
£(1.3)bn £1.3bn £(0.7)bn
£0.1bn
£9.0bn
£8.4bn
1 – Refer to adjusted measures presented within the FY 2021 Results announcement
18FY 2021 RESULTS
2022 outlook – breakdown of LFL growth
Brands less Brands more impacted by COVID
sensitive to
COVID
Approx.
weighting c.70% c.25% c.5% +1% TO
+4%
2022 Mid single- Double-digit Low single- Double digit LFL1 revenue
illustration digit growth decline digit growth growth growth
1 – Refer to adjusted measures presented within the FY 2021 Results announcement
19FY 2021 RESULTS
2022 outlook and guidance
LFL net revenue growth Adj. Net Finance Expense Adjusted Tax Rate
+1 – 4% £220 – 240m 23 – 24%
AOP margin FX impact on EPS1 Capex
Growth
vs 2021 (base of 22.9%)
FLAT c.4.0%
of Net Revenue
See FY 2021 Results announcement for full Outlook statement | 1 – Assuming exchange rates were to hold flat at the December 2021 closing rates for 2022
20LAXMAN NARASIMHAN Chief Executive Officer
FY 2021 RESULTS

Addressing four of the world’s largest problems

                  SIGNIFICANT UNREALISED MARKET OPPORTUNITY ASSOCIATED WITH ADDRESSING THESE PROBLEMS

                                         How do we enable         How do we support intimate        How do we provide
     How can hygiene be the          consumers to self-care at      wellness and eradicate         enhanced nutrition for
      foundation for health?        a time when health systems      the menace of sexually     infants and for the increasing
                                    are under massive pressure?      transmitted diseases?     number of seniors in society?

                         CAPITALISING ON THE BROAD AND RISING IMPACT OF DIGITAL AND SUSTAINABILITY
                                                                                                                                22
FY 2021 RESULTS
We are in the right categories for long term growth
HYGIENE HEALTH NUTRITION
Surface and disinfection Laundry additives
c. 4-6% c. 2-4%
Germ protection Intimate Wellness Core Enfa Speciality Infant
c. 4-6% c. 7-9% c. 0-2% c. 7-10%
Auto-dish Sanitisation and bathroom
c. 3-5% c. 3-6%
Air Pest OTC Personal Care VMS Adult
c. 3-5% c. 2-4% c. 2-4% c. 2-3% c. 4-6% +100bps contribution
Medium term Medium term Medium term
net revenue growth net revenue growth net revenue growth
+4-5% pa +4-6% pa +3-5% pa
23FY 2021 RESULTS
Our growth drivers
01 02 03 04
PENETRATION MARKET SHARE NEW PLACES & NEW SPACES &
CHANNELS ADJACENCIES
24FY 2021 RESULTS
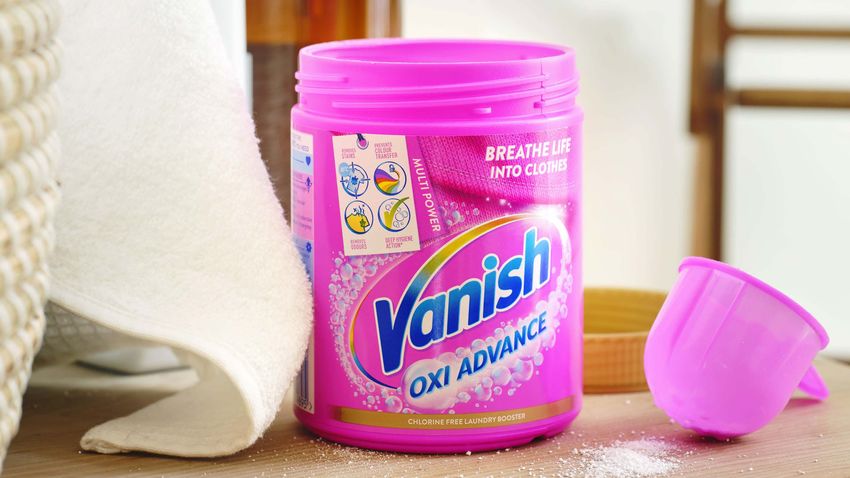
Our growth drivers: penetration
FINISH TURKEY DETTOL
K-YINDIA NEURIVA US
Dettol India penetration %2
9.1
5.3
5.1
3.6
Q2 Q3 Q4 Q1 Q2 Q3 Q4 Q1 Q2 Q3
2019 2019 2019 2020 2020 2020 2020 2021 2021 2021
Liquid Handwash Antiseptic Liquid
11m
households
52.8% +45bps
household
68%
2021 brand of sales from
reached1 penetration1 penetration3 new customers3
1 – As at November 2021 | 2 – LHW (liquid handwash) and ASL (antiseptic liquid) household quarterly penetration increase Q3 2021 vs Q2 2019 | 3 – 52 weeks ending 18 December 2021 vs prior year
25FY 2021 RESULTS
Our growth drivers: market share gains
LYSOL US IFCN
K-YUS DUREX INDIA
Lysol ‘Back to School’
programme
Surface care Disinfectant spray Nutramigen Enfa
+630 bps +160 bps +70 bps +55 bps +210 bps
market share
+61 %
distribution
market share market share market share market share
gains2 increase vs 2019
gains1 gains1 gains2 gains2,3
1 – represents share gains over the ‘Back to School’ period typically Aug to Sep vs prior year | 2 – YTD Dec 2021 vs prior year | 3 – Enfa excluding WIC programme
26FY 2021 RESULTS
Our growth drivers: new places
FINISH EMERGING MARKETS VMSK-Y
CHINA NUROFEN
Expanding internationally
(cross-border)
+70m c.80%
NR growth across
c.60%
dishwashers1 NR CAGR 16-21
total developing
(to c.$100m)
markets vs 2019
1-160m addressable households 2020-2025 vs 90m addressable households 2015 – 2020
27FY 2021 RESULTS
Our growth drivers: new spaces
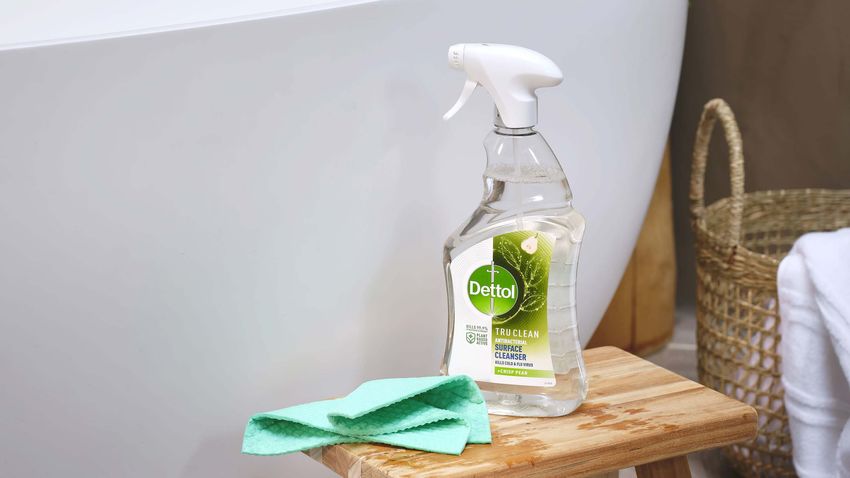
DETTOL UK LYSOL
K-Y GLOBAL BUSINESS SOLUTIONS
Dettol ‘Tru Clean’ Lysol laundry sanitiser
28FY 2021 RESULTS
Improved hygiene habits are sticking
80%
of people globally say they will
maintain new hygiene behaviours
49%
disinfecting their
home more1
VACCINATED
people are more likely to
maintain hygiene behaviours2
acquired during covid
1 – Jan 2022 past week vs pre-COVID (83% in March 2020) | 2 – vs non vaccinated people
29FY 2021 RESULTS
Dettol net revenue stable at c.40% above 2019
>£100m additional revenue contribution from Dettol Net Revenue c.£1.4bn
new places and spaces since 2019 (MAT1)
Q3 and Q4
stable at 40%
above 2019
Disinfectant Laundry 38
spray sanitiser new markets
+c.40%
Step-change in developing markets
penetration (+25-44% vs 2019)
2019 Q1 20 Q2 20 Q3 20 Q4 20 Q1 21 Q2 21 Q3 21 Q4 21
60% of peak consumption maintained
1 – MAT: Moving Annual Total
30FY 2021 RESULTS
Lysol sustainably higher due to quality of growth over 2019-21
Lysol Net Revenue
£m
+700bps
c.90% GROWTH US share gains vs 20193
c.35% pts CORE
c.55% pts c.£1.6bn Heavy users contribute 500bps increase vs 2019 of
c.£1.7bn
to 54% of Core growth US consumers buying 2 or
in the US more Lysol products
NEW PLACES AND SPACES
>£250m additional revenue contribution from new places
and spaces since 2019
38
new
2019 Core1 New places 2021 markets GBS Laundry Neutra Air On the Go
since 2019 sanitiser
and spaces2
1 – Includes Lysol Disinfectant Spray and Wipes | 2 – includes adjacencies (lavatory care and non-wipes MPC) | 3- Across total Lysol
31FY 2021 RESULTS
We are building a stronger business through our strategic imperatives
01 02 03 04 05 06
GROW BRANDS DRIVE SUPERIOR INVEST IN INCREASE EMBED ACTIVELY
& INNOVATE EXECUTION CAPABILITIES PRODUCTIVITY SUSTAINABILITY MANAGE THE
PORTFOLIO
32GROW BRANDS & INNOVATE DRIVE SUPERIOR EXECUTION INVEST IN CAPABILITIES INCREASE PRODUCTIVITY EMBED SUSTAINABILITY ACTIVELY MANAGE THE PORTFOLIO
FY 2021 RESULTS
Award winning campaigns driving brand strength
Brand Equity1 Growth
Is effective at killing germs +1000bps Dettol: Fight to Protect Durex: Everyday Celebrations
Highly effective at killing germs +100bps
Is recommended by dishwasher
manufacturers +400bps
Works every time +400bps
Challenges preconceived ideas
about sex +300bps
Finish: Tomorrow’s Water
1 – Measures brand perceptions amongst consumers
Dettol: Nov 21 vs Dec 20 Lysol: YTD Sep 21 vs YTD Sep 20; Finish: YTD Sep 21 vs YTD Sep 20; Gaviscon: July 21 vs Jul 20; Durex: Nov 21 vs Dec 20 33GROW BRANDS & INNOVATE DRIVE SUPERIOR EXECUTION INVEST IN CAPABILITIES INCREASE PRODUCTIVITY EMBED SUSTAINABILITY ACTIVELY MANAGE THE PORTFOLIO
FY 2021 RESULTS
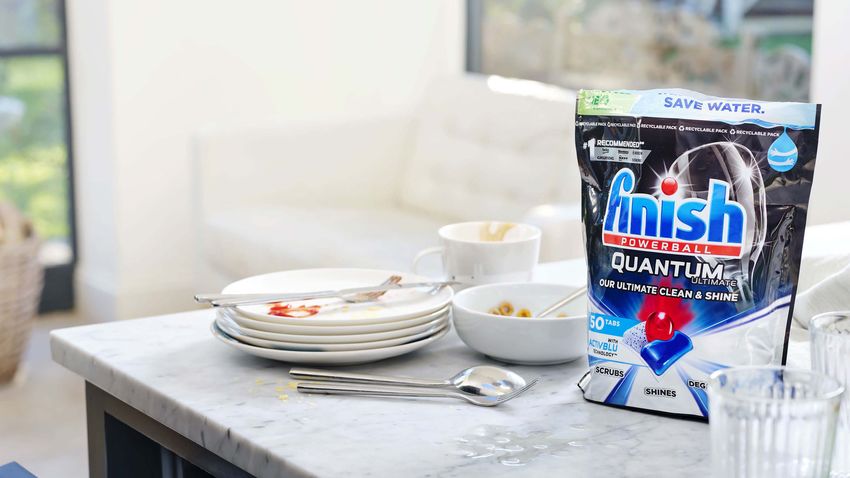
50% larger innovation pipeline starting to deliver
HYGIENE HEALTH NUTRITION
Finish Quantum All in 1 Mucinex InstaSoothe Enfamil Enspire Optimum
Launching in 2022 Launched in 2021 Launching in 2022
Deep clean and sparkling shine Only US sore throat product clinically Our closest formula to breastmilk
without the need for pre-rinse proven to numb pain fast
Up to 5x the amount of HuMO6 and HMOs
Packaged in recyclable materials found in other infant formulas
Pipeline value represents the increased revenue opportunity from innovation in 2022 compared to 2021
35GROW BRANDS & INNOVATE DRIVE SUPERIOR EXECUTION INVEST IN CAPABILITIES INCREASE PRODUCTIVITY EMBED SUSTAINABILITY ACTIVELY MANAGE THE PORTFOLIO
FY 2021 RESULTS
Customer execution improving significantly
+110bps Awards from our retail partners
Total Reckitt share of TDPs
23.3% Supplier of the Year 2021
Total Reckitt share of total
distribution points (TDPs) Walmart US
22.2%
Sep-21
Feb-21
Mar-21
Apr-21
Oct-21
Jan-21
May-21
Jun-21
Jul-21
Aug-21
Dec-20
Nov-21
Supplier of the Year 2021
Dollar General US
+20% ppts
2020 vs 2021 Advantage survey performance
46%
Supplier of the Year 2021
26% Superdrug UK
Improvement in customer
relationship scores1
#1 Advantage Survey
2020 2021
Tesco UK
Bottom Tier Mid Tier Top Tier
1 – Based on Advantage Group 2021 survey of retailers. 20% pts increase in markets rated top-tier from 26% in 2020 to 46% in 2021
36GROW BRANDS & INNOVATE DRIVE SUPERIOR EXECUTION INVEST IN CAPABILITIES INCREASE PRODUCTIVITY EMBED SUSTAINABILITY ACTIVELY MANAGE THE PORTFOLIO
FY 2021 RESULTS
Supply chain - significant improvement in quality KPIs
27%
Improvement
12%
Reduction
11%
Reduction
in Quality1 in Cost of Non-Quality in Turn Around Time
e.g. fewer instances of processes e.g. savings related to reduction in reduction in time taken for finished
not being adhered to, requiring the need for changing labels or sending goods to be tested, as a result
documentation and resulting in delays goods to landfill due to quality issues of greater efficiency
Quality metrics vs 2019 | 1 – based upon Quality Deviations metric
37GROW BRANDS & INNOVATE DRIVE SUPERIOR EXECUTION INVEST IN CAPABILITIES INCREASE PRODUCTIVITY EMBED SUSTAINABILITY ACTIVELY MANAGE THE PORTFOLIO
FY 2021 RESULTS
eCommerce continued strong growth
+17% BE BIG BE FAST
LFL1 net revenue Executing large brands at scale Driving growth in new
growth in 2021 channels including DTC
DEDICATED FOCUS ON PUREPLAY AND OMNICHANNEL
>85%
2-year stacked LFL1 +15% +24% BE ABLE
Investing in platform
revenue growth growth from Pureplay growth from omnichannel
capabilities
12%
of Group net BE BOLD & OPEN
revenue Investing into next
DOUBLE DIGIT
generation brands
growth across
most regions2
1 – Refer to adjusted measures presented within the FY 2021 Results announcement | 2 – Double digit growth across all regions except for Greater China (growth9%)
38GROW BRANDS & INNOVATE DRIVE SUPERIOR EXECUTION INVEST IN CAPABILITIES INCREASE PRODUCTIVITY EMBED SUSTAINABILITY ACTIVELY MANAGE THE PORTFOLIO
FY 2021 RESULTS
Productivity embedded into the business and on track to deliver £2bn
£0.7bn
Design to Value
e.g. analysis of >1,000
products to optimise cost
and value, and reduce
Network / Cost environmental footprint Direct
Optimisation Procurement
Savings delivered in 2021 e.g. organisational optimisation e.g. Improved relationships
and reversal of RB2.0 with suppliers to drive
mutual efficiencies
£1.1bn
Savings delivered to date1
Revenue Growth
Management
Improved analytics to drive
Fully
embedded
effectiveness of trade spend in operation and
culture of the
c.14,000
company
Supply Chain Marketing and
Lean manufacturing Indirect Procurement
Individual initiatives practices and continuous
improvement,; elimination Improved supplier negotiations,
of transportation costs e.g. consolidation of regional
media-buying
1 – Programme began in 2020, savings tracked at 2020 average exchange rates
39GROW BRANDS & INNOVATE DRIVE SUPERIOR EXECUTION INVEST IN CAPABILITIES INCREASE PRODUCTIVITY EMBED SUSTAINABILITY ACTIVELY MANAGE THE PORTFOLIO
FY 2021 RESULTS
Strong progress on ESG
PURPOSE-LED BRANDS HEALTHIER PLANET FAIRER SOCIETY
29.3%
of 2021 net revenue from
66%
absolute carbon reduction
£38m
Fight for Access Fund
more sustainable products1 from operations since 2015
Meeting our 2030 science-based
target ahead of schedule
AA
(upgraded in April 2021)
22.9
(as of January 2022)
1 – Net revenue (excluding Nutrition)
40GROW BRANDS & INNOVATE DRIVE SUPERIOR EXECUTION INVEST IN CAPABILITIES INCREASE PRODUCTIVITY EMBED SUSTAINABILITY ACTIVELY MANAGE THE PORTFOLIO
FY 2021 RESULTS
We continue to actively manage our portfolio towards higher growth
DIVESTING ACQUIRING
Slower growth or Higher growth or strategically
less scalable brands important brands
3-year CAGR2
+10%
IFCN China & EnfaBebe
Personal Care brands:
3-year CAGR1
-14% Important strategic entry into the
world’s largest analgesics market
1 – 2019 to 2021 CAGR. For IFCN China, Scholl and E45 2021 growth is calculated to end of last full month of ownership by Reckitt | 2 – 2019 – 2021 CAGR. Reckitt ownership since 12 July 2021
41GROW BRANDS & INNOVATE DRIVE SUPERIOR EXECUTION INVEST IN CAPABILITIES INCREASE PRODUCTIVITY EMBED SUSTAINABILITY ACTIVELY MANAGE THE PORTFOLIO
FY 2021 RESULTS
Biofreeze – a strong start
EFFECTIVE 360° MEDIA DISRUPTIVE IN-STORE DISPLAY STRONG INNOVATION PIPELINE
Precision Relief Pen Flexible Relief Strips
2-1 Relief Value Pack Build Your Own Pack
First ever regional TV media Partnering with customers to Leveraging our capabilities and
campaign in the US drive better visibility in store platforms to strengthen launches
42FY 2021 RESULTS
Our culture is evolving
LEADERSHIP Engagement1
BEHAVIOURS
>30,000 +100bps
increase in NPS for LGBTQ+
colleagues actively engaged
OWN CREATE in inclusion activities community in 2021
DELIVER CARE +75%
feeling positive impact of
Leadership Behaviours Recognised in Fortune’s
launched in 2021 2022 World’s Most
Admired Companies list
1 –June 2021 Reckitt all employees pulse survey
43FY 2021 RESULTS
Key messages
STRONG MOMENTUM MANAGING THE PORTFOLIO TRANSFORMATION FIRMLY
IN 2021 FOR HIGHER GROWTH ON TRACK
Targeting revenue growth and 9% portfolio turnover through Stronger business, well-
margin expansion in 2022 targeted acquisitions and positioned to deliver medium
divestitures term targets
44APPENDIX
FY 2021 RESULTS

Group margins1
                                                                                                                                                     H1 2021                H2 2021                FY 2021
£m                                                                                                                                      £m            Actual FX      £m       Actual FX     £m      Actual FX

Net Revenue2                                                                                                                      6,274                   (2.7)%   6,577         (1.6)%   12,851        (2.1)%

LFL growth1                                                                                                                                                3.6%                   3.3%                   3.5%

   Gross Margin %                                                                                                                 58.1%                (280)bps    58.9%       (120)bps   58.5%      (200)bps

   BEI %2                                                                                                                         12.7%                   50bps    12.5%         90bps    12.6%         60bps

   Other Costs %                                                                                                                 22.7%                   (10)bps   23.3%        (50)bps   23.0%        (20)bps

Adjusted Operating Profit2                                                                                                         1,425                 (11.9)%    1,519        (5.0)%   2,944         (8.5)%

 Adjusted Operating Profit Margin2                                                                                               22.7%                 (240)bps    23.1%       (80)bps    22.9%       (160)bps
1 – All amounts shown exclude IFCN China for both 2021 and 2020 | 2 – Refer to adjusted measures presented within the FY 2021 Results announcement

                                                                                                                                                                                                             46
You can also read