FY 2022 BOARD BUDGET RETREAT - February 27, 2021

Page created by Claude Moss
 
CONTINUE READING
FY 2022 BOARD BUDGET RETREAT - February 27, 2021
FY 2022
   BOARD
BUDGET RETREAT
    February 27, 2021
FY 2022 BOARD BUDGET RETREAT - February 27, 2021
Welcome & Open Remarks
 Audit, Budget, Finance Co-Chairs
  Board Members Avant & Love
FY 2022 BOARD BUDGET RETREAT - February 27, 2021
Today’s Agenda
            8:00 am – 9:00 am Breakfast
            9:00 am – 9:05 am Welcome & Open Remarks
            9:05 am - 9:15 am Ice Breakers
                                District’s Long Term Financial Outlook
           9:15 am – 10:30 am
                                & Board Discussion
          10:30 am – 11:00 am Reimagining 901

 Board    11:00 am - 12:00 pm Operating & CIP Budget Development

Budget
          12:00 pm – 12:45pm Lunch
          12:45 pm – 3:00 pm ESSER Funds & Board Discussion

Retreat                      Additional Discussions (As Needed)
           3:00 pm – 3:30 pm & Closing Remarks
FY 2022 BOARD BUDGET RETREAT - February 27, 2021
ICE BREAKER #1
FY 2022 BOARD BUDGET RETREAT - February 27, 2021
“A SCS Story”
1.   Shelby County Schools has a ______ member board with ______ past district employees.

2. There are many ways that they each show their devotion and support for Shelby County Schools. The Chair, a strong education advocate and proud
mom of Langston serves graciously with ____ board members who started their board tenures before the year _____. It takes passion to serve and
devote the amount of time committed within those years.

3. One Board member can even boastfully state that she has ____ children and ____ grandchildren that either graduated or attend SCS.

4. Another Board member who often prays over us all has a true passion for ______ and _______. She retired after 38 years of service.

5. While there are many board members who have served multiple years, there is one newly elected board member who proudly serves District 5 that
_____ her Hound Dog, named _________ .

6. There are ____ gentlemen on the board that proudly serve District’s ____ and ____. They have been Board Members since ____.

7. This Board member’s daughter (Peyton) attends _______. She is a strong community and education advocate, and received the following award
________.

8. This Board Member is passionate about her community. Her advocacy began in ______ at ________ Headstart.
The SCS Board Members are passionate and the absolute best Board Members in the nation!
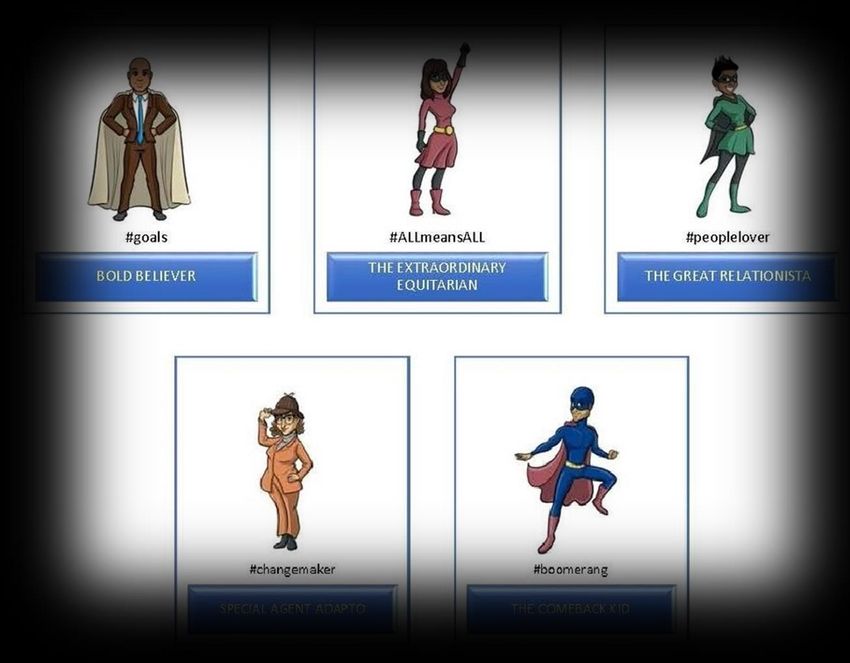
FY 2022 BOARD BUDGET RETREAT - February 27, 2021
Ice Breaker
       #2
    What Kind of
     Education
Superhero Leader, are
        you?
FY 2022 BOARD BUDGET RETREAT - February 27, 2021
Education Superhero Leaders
Today, education leaders are our newest superheroes. From the start of the pandemic, principals sprang into action delivering meals and learning devices.
Educators shifted instruction. School communities came together in their loss and in defense of racial justice. Five months later, educators and leaders
across the country continue to meet this moment: protecting learning, preserving community, and promoting connectedness in every form of classroom. –
New Leaders
FY 2022 BOARD BUDGET RETREAT - February 27, 2021
Long Term
Financial Outlook
FY 2022 BOARD BUDGET RETREAT - February 27, 2021
Today’s Journey
                     Journey Begins with Enrollment

                 •    Projections for Historical Enrollment
                 •    Where does enrollment take us?
                 •    Board member Group Break out Sessions

                     Journey Continues Revenues & Expenditures

  Long Term      •    Revenue & State Funding Assumptions
                 •    General Fund Per Pupil Spending
   Financial     •    Board member Reflections
                 •    Student Based Budgeting Pop Quiz & Recap
    Outlook      •    Summary of Long-Term Financial Outlook

(General Fund)
FY 2022 BOARD BUDGET RETREAT - February 27, 2021
2035

                                                                               68,614                            38,094
                                                                                                                                2034

                                                                              62,376                            44,332
                                                                                                                                2033

                                                                             56,706                            50,002
                                                                                                                                2032

                                                                            51,551                         55,157
                                                                                                                                2031

                                                                           46,864                         59,844
                                                                                                                                2030

                                                                          42,604                       64,104
                                                                                                                                2029

                                                                          38,731                      67,993
                                                                                                                                       PreK
                                                                                                                                2028

                                                                    35,210                           71,517
                                                                                                                                       Adult
                                                                                                                                2027

                                                                  32,009                            74,713
                    Current Enrollment Cap 22,994

                                                                                                                                       Contract Schools
                                                                                                                                2026

                                                                 29,099                             77,609
                                                                                                                                2025
                                                                26,454                             80,346
Enrollment Trends

                                                                                                                                2024
                                                                24,049                             82,830

                                                                                                                                       Charters
                                                                                                                                2023
                                                               21,863                             85,088

                                                                                                                                       SCS
                                                                                                                                2022
                                                               19,875                             87,137

                                                                                                                                2021
                                                                19,203                            85,437

                                                                                                                                2020
                                                               17,934                             87,623

                                                                                                                                2019
                                                               15,774                             88,347

                                                                                                                                2018
                                                               14,928                            89,076

                                                                                                                                2017
                                                               13,305                            90,147

                                                                                                                                2016
                                                              12,187                             94,116

                                                    120,000

                                                                100,000

                                                                               80,000

                                                                                        60,000

                                                                                                      40,000

                                                                                                                   20,000

                                                                                                                            0
Historical Growth Trends of Charters
$200,000,000                                                                                                                                                     25,000
                                                                                                                                                  $185,441,812
                                                                                                                                      $172,333,143
$180,000,000
                                                                                                                            $160,191,634
$160,000,000                                                                                                                                                     20,000
                                                                                                                    $140,920,374
$140,000,000                          Historical                                                          $126,572,780
                      Charter growth on average 10- 12% annually                                 $109,911,287
$120,000,000                                                                                                                                                     15,000
                                                                                         $93,070,446
                                                                               $81,234,456
$100,000,000
                                                                      $66,980,339
 $80,000,000                                                 $55,327,390                                                                                         10,000
                                               $51,101,585
 $60,000,000
                                    $38,449,101
 $40,000,000              $29,227,295                                                                                                                            5,000
               $20,408,967
 $20,000,000

         $-                                                                                                                                                      -
                   2009       2010      2011        2012        2013      2014      2015     2016        2017       2018    2019      2020     2021      2022
                                                               Enrollment      Allocations     Linear (Allocations)
General Fund Financial Outlook
     As student enrollment shifts and fixed cost remain constant in the short run, budget reductions
     will shift pressures to decentralization and a charter majority school district.
                                             BUDGET REDUCTIONS TO MAINTAIN OPERATIONS
                                                                  2025
                                                                
                                                                                   Decreasing Ability to Fund Centralized Operations &
                             Majority District-Run Schools &                                       District-Run Schools
                              Centralized Administration
                                                                                    2027-2030
                                                                                   Decentralization

•   Assumes no trade-offs                          2023                                 
•   10% Average Charter Growth                   
•   Assumes minimal inflation in major contracts
•   Employee average 2% raises
•   Holding Schools with General Fund SBB Funding                                           2033
    and sustaining school programs                                                                 Charter Majority District
Instructions
            Based on the information presented, discuss in your
            groups and answer the following questions:

                1. Is there support for limiting the rate of new
                   Charter school growth to ensure a balanced
                   portfolio of District-run and Charter Schools
                   supported by a centralized administration and
                   why?

                2. What does a balanced portfolio look like?
  Board         3. What lessons have you learned from the
 Member            charter school movement that you think would
                   apply to the scalability of the district?
Break Out
            Supplemental Documents:
 Sessions   •   Charter School Policy
            •   One pager of the State’s Charter Commission
The Journey
     Continues
Revenues & Expenditures
Revenues Trends
$1,400,000,000
                                                                     •   The State’s Basic Education Program formula has
                                                 Total                   increased unit variables primarily through a 2%
$1,200,000,000                                   Revenue                 instructional component increase or $6-7M.

                                                                     •   The County has held the maintenance of effort
$1,000,000,000                                                           $427.3M. SCS’s portion of the County funding is
                                                                         approximately 77%. This is for SCS, Charters, and ASD.
 $800,000,000
                                                                     •   Federal and local revenue includes indirect cost from
                                                     State               grants and miscellaneous revenues collected.
 $600,000,000
                                                                         •    Building rents are declining due to sales.
                                                     County
 $400,000,000                                                            •    Investment income has declined based on
                                                                              market and economy.

 $200,000,000

                                                     Federal &
           $-                                        Local
                 2015    2020   2025   2030   2035            2040
State Funding
          Instructional Salary Increases
1. State’s Calculation includes SCS, Charters, & ASD.

2. Shelby County School’s Average Salary is approximately $9K-10K
   Higher than the State’s Unit Variable for Average Salary.

3. Shelby County Schools has 1K+ positions higher than the State’s
   Instructional Salary Component Calculation.

     **Funding received from the State’s Instructional Salaries
  Does Not Cover an Equivalent % Raise to SCS Instructional Staff **
BEP Instructional Salaries Component
State Send Funds for SCS, ASD, Charters                           SCS Portion of State Funding                                  SCS Disbursements
             State’s
             Funded            BEP               State’s
              Salary         Funded           Instructional                     SCS’s                        SCS Funding                  SCS’s
           (Including      Positions for      Increase on         SCS’s     Funding from   SCS’s Positions   Disbursed to     SCS’s      Average
               CDF)       State & Local            BEP           Portion     State of TN      Funded         Instructional   Positions    Salary       Compensation
                                                                                                                                                      Performance Based
                                                                                                                                                    (included in base pay)
                                                                                                                                                   TEM 3 $750, TEM 4 $1000,
2018- 3%    $47,787            7,965                                  79%    $6,818,692        6,292          $8,479,726      7,854      $58,773     TEM 5 $1500, Veteran
                                               $8,631,256                                                                                          Performer, Hard-to-Staff,
                                                                                                                                                   Advanced Degree, Stay
                                                                                                                                                             Pay

                                                                                                                                                    3% applied (included in
                                                                                                                                                   base) Veteran Performer,
2019-3%     $48,672            8,020           $9,339,091             78%    $7,284,491        6,256         $11,079,087      7,510      $59,474
                                                                                                                                                   Hard-to-Staff, Advanced
                                                                                                                                                       Degree, Stay Pay
                                                                                                                                                   3% applied (included in
                                                                                                                                                           base)
 2020                                                                                                                                                    TEM Bonus
            $49,474            8,011           $7,364,374             78%    $5,744,212        6,249         $17,612,974      7,522      $58,787
  3%                                                                                                                                                 Teacher Max Bonus
                                                                                                                                                         Retention
                                                                                                                                                    Advanced Degrees
                                                                                                                                                          1% applied
 2021                                                                                                                                               (included in base pay)
            $49,969            8,130           $10,245,225            76%    $7,786,371        6,179         $12,296,352      7,303      $58,582
  1%                                                                                                                                                 $1,000 Certified; $500
             *Non Reoccurring 1% Raise Due to Special Legislation *                                                                                        Classified
2022-3%     $51,453            8,130           $6,552,444             75%    $4,914,333        6,098          $8,631,975                 $59,053        2% Base Pay
Board Member
              Thoughts on State Funding

              1. What resonated with you on the state’s
                 instructional salary slide?

              2. How do we present this clear? So that our
                 stakeholders can better understand?
  Board       3. Feedback?
 Member
Reflections
General Fund Operating Cost Per Pupil
On average, SCS receives $9,700 for students from State and Local Funding Sources
             120%

             100%
                                       15%
              80%                      12%

              60%                      27%

              40%

              20%                      46%

               0%
                                     Per Pupil
                             Site Based
                             Expenditures Fixed or Mandated
                             School Programs
                             School Supports & Central Office
Fixed & Mandated Cost (Per Pupil)
1200

1000

 800

 600

 400

 200

  0

            2016   2017   2018   2019   2020   2021      2022   2023   2024   2025
                                               Amended
“POP QUIZ ON SBB”

             1. What does SBB stand for?

             2. Why did we implement SBB?

             3. What is a weight?
  Board      4. How many weights are there?
 Member
-Pop Quiz-
School Allocations with SBB

                                        2018-2019     2019-2020     2020-2021     2021-2022
                SCS K-12 for Staffing     86,351        84,857        83,672        83,865
                       Only

                       SBB Pool         398,925,819   405,021,599   386,880,226   381,886,187

                 Staffing Allocations   365,425,439   375,002,884   370,249,031   367,725,029
                Based on Enrollment
              Additional SBB Dollars    33,500,380    30,018,715    16,631,195    14,161,158
                   Budgeted

*Excludes Principals
Schools Examples “If Pool Is Reduced”
                                     SBB Allocation                                          FY' 22     FY' 22
                         Actual 20th
                                     revised based
                                                                        Projected FY '22
                                                                                           enrollment dollars vs.      At this time,
                                      on 20th day     Projected FY' 22                     vs. Actual Actual
            School          Day
                                          count          Enrollment
                                                                         BASELINE ONLY
                                                                                            20th day 20th day       school’s pool will
                         Enrollment                                    No Additional SBB $
                                       (with extra                                         enrollment dollars        remain funded!
                                          Pool)                                               FY'21     FY'21
           School A                                         348
                            321        1,886,031                            1,718,755          27      (167,276)     Enrollment Shifts
           School B         176        1,179,387            185             1,175,234           9       (4,153)        will Only Be
                                                                                                                      Considered to
           School C         544        2,199,511            615             3,487,145          71      1,287,633    Ensure Resources
           School D        1,586       6,126,265           1,522            5,176,431          (64)    (949,834)
                                                                                                                     Follow Students

Scenarios
▪ School A – gaining 27 students, will however need to reduce budget by $167K.
▪ School B – example of very smalls school, won’t really be impacted.
▪ School C– example of a few schools that are expecting a significant gain, so they will need additional staff.
▪ School D– large schools will be impacted the most.
Timeline for Schools

SBB Retreat (tentatively planned March 11 or 12)
SBB Workbooks delivered to Principals March 15th
Budget Checkout kicks off April 5 – April 20th (after Spring Break)
Causes of Operating Budget Pressures
       Internal Factors                  External Factors
Fixed Expenditures                     Underfunded
                                           BEP

         Enrollment Shifts                    State
                                             Mandates          Operating
                                                             Budget Pressures
                                                 Education
                 Sustainability of
                                                Landscape            =
             Student Based Budgeting
                                                             Decentralization
                                                                    &
              Other Factors                                     Charter
                                                             Majority District

               Return of ASD
                  Schools

          Legislature
      Continued Voucher
           Attempts
Board Member Thoughts
                   on the Long Term
                  Financial Outlook?

              1. What resonated with you on the Long-Term
                 Financial Outlook?

              2. What do you think our next steps should be?

  Board       3. Feedback?

 Member
Reflections
Reimagining
    901
FY 2022
    Operating
Budget Development
District Priorities

     WHEREAS, the Strategic Plan includes the following priorities:

Priority   1: Strengthen Literacy
Priority   2: Improve Post-Secondary Readiness
Priority   3: Develop Teachers, Leaders and Central Office to Drive Student Success
Priority   4: Expand High-Quality School Options
Priority   5: Mobilize Family and Community Partners; AND

     WHEREAS, this Strategic Plan includes the following initiatives:

Initiative 1: Strengthen Early (K-2) and Continuing Literacy (3-12);
Initiative 2: Recruit and retain the best district leaders and teachers in the nation, immerse them in professional
development to embrace and teach foundational literacy skill concepts, and entrench them in the community and
classroom;
Initiative 3: Create relevant and equitable academic choices and learning environments to ensure scholars are
prepared for the global workforce;
Budget Priorities
       Strategic Budget Development

    Investments                                  $21,474,899

     Proposals
                                                    Create relevant
                            $19,077,225              and equitable
                          Recruit and retain       academic choices
    $120,541,664           the best district
                             leaders and
                                                   to ensure scholars
                                                    are prepared for
                               teachers                the global
                                                       workforce
                        General Fund
                                                              General Fund
General Fund Specific   $16,207,225
                                                               $4,550,376

Investment Proposals
                                         $48,022,251
                                     Strengthen Early (K-2)

    $20,757,601
                                    and Continuing Literacy
                                             (3-12)
Summary
              •   Investments in schools are sustained and the highest priority. We
                  will continue to support schools by maintaining a $14M
                  investment in schools-based allocations above enrollment
                  based on projected revenue allocations.

              •   The budget includes a 2% salary increase for both certified and
                  non-certified personnel. $16M

              •   Charter & Contract Schools are projected to increase by $13M.

  FY 2022
              •   Investments have been made in the universal screening for
                  Clue, African American Male Initiative, and programming for
                  the New Health High School $3M.
 Operating    •   Contract costs have increased for both transportation and

  Budget          custodial. $7M

Development
              •   Reduced $22M across the General Fund, primarily in Central
                  Office with non-critical, duplication of resources, one time
                  expenses, and leveraging grants.
FY 2022 General Fund
                                                                                                                       Revenue Development

                                                                                                                                                                                    $572.46
                                                                                                                                                                                              $579.28
                                                                                                                                                                          $544.51
                                                                                                                                                                $538.52
                                                                                                                                                      $522.45
                                                                                                                                            $502.01
                                                                                                                                  $482.37
                                                                                         $479.02
                                                                               $478.88

                                                                                                   $478.41
                                                                                                             $474.21
                                                                     $463.10
                                                           $455.92

                                                                                                                       $473.58

                                                                                                                                                                                                                                                                                                                                                                 $32.84
                                                                                                                                                                                                                                                                                                                                                                          $32.84
                                                                                                                                                                                                                                                                                              $29.30
                                                                                                                                                                                                                                                                            $23.50

                                                                                                                                                                                                                                                                                                                $16.42
                                                                                                                                                                                                                                                                                                       $15.45
                                                                                                                                                                                                                        $12.54

                                                                                                                                                                                                                                                                                     $11.98
                                                                                                                                                                                                                                         $11.10

                                                                                                                                                                                                                                                          $10.62
                                                                                                                                                                                                               $10.01

                                                                                                                                                                                                                                                                   $15.37

                                                                                                                                                                                                                                                                                                                                                                                   $11.70
                                                                                                                                                                                                                                                  $6.99

                                                                                                                                                                                                                                                                                                                         $5.75
                                                                                                                                                                                                                                 $1.60
$1.49
         $1.45

                         $1.45
                 $1.42

                                 $1.33
                                         $1.33

                                                                                                                                                                                                                                                                                                                                 $5.59
                                                 $1.33

                                                                                                                                                                                                                                                                                                                                             $-
                                                                                                                                                                                                                                                                                                                                                  $-
                                                                                                                                                                                                                                                                                                                                                       $-
                                                                                                                                                                                                                                                                                                                                                            $-
        CITY OF MEMPHIS                                  SHELBY COUNTY REVENUES                                                  TN REVENUES (E.G., BEP)                                                      FEDERAL GOVERNMENT                                            OTHER LOCAL SOURCES                                             PLANNED USE OF FUND
                                                                                                                                                                                                                                                                                                                                                 BALANCE

                                                            2016-17 Actuals                                      2017-18 Actuals                      2018-19 Actuals                                   2019-20 Actuals                       2020-21 Amended Budget                           2020-21 Forecast                          2021-22 Budget
General Fund
Budget Changes

          Amended Budget FY 2021       1,080,499,222
Change In Fund Balance Assignments     (28,405,809)

                         Additions:
             Instructional Resources    11,364,881
         Charter & Contract Schools     13,532,969
            Strategic Compensation      15,688,000
           Transportation Contracts     5,695,421
  Academic Enrichment Investments       3,289,790
                              Other     8,575,957
                                        58,147,018
General Fund Budget Changes

                                 Reductions:
                    Duplication of Resources       1,673,447
          Removal of One-time expenditures         3,252,492
    Non-Critical to Operational Sustainability     9,393,500
Unallocated Expenditures Carrying in Budgets       5,098,432
                Limiting Travel Due to COVID        499,560
                      Removal of Vacancies         1,827,486
 Leveraging Grants & Other Funding Sources         1,648,589
                             Total Reductions     (23,393,506)

          Initial Budget Development FY 2022     $1,086,846,946
General Fund Balance

$196.8                     $198.8

                                                          $158.3
                                                                                       $156.1

                                                                                                                      $156.1                   $156.1
         $108.5                          $122.6
                   $88.2                                                                                                               $95.0
                                                  $76.2                $74.7 $83.6                  $72.8 $83.3                $72.8                    $72.8 $83.3

         2016-17                        2017-18                       2018-19                      2019-20                 2020-21                  2021-22

                                    Total Fund Balance        Nonspendable, Restricted & Assigned Fund Balances   Unassigned Fund Balance
Process for Project Prioritization
                 Highest Priority Scores receive highest priority for capital investment / selection

                                                               Maintenance Type is weighted as follows:
                  Projects are listed to include:
                                                                    o 5 = Construction, HVAC,
                                                                       Renovation, Roofing
                  o   School / Building Location
                                                                    o 4 = ADA, Fire Alarm System,
                  o   FCI (Facility Condition Index)
                                                                       Windows
                  o   Utilization – from Facilities Planning
                                                                    o 3 = Carpentry, Electrical, Paving,
                  o   Maintenance Type and Weight
                                                                       Plumbing
                  o   Severity/Urgency
                                                                    o 2 = Athletics, Grounds
                  o   Priority Score
                                                                    o 1 = Energy Mgt, Intercom System,
                  o   Total Cost Estimate
                                                                       Painting, Stage Curtain

   FY 2022       Severity/Urgency is weighted as follows:        Priority Score is calculated as follows:

     CIP               o
                       o
                           1 = Urgent
                           2 = Extremely Urgent
                                                                       Selection Score =

Prioritization
                       o   3 = Critically Urgent                       [(1-FCI) x (Utilization) x
                                                                       (Maintenance Weight) x
                                                                       (Severity/Urgency Weight) x 100]

   Process
Description                 # of Projects   Project Estimates

               Classroom Addition                   1             4,000,000
               Classroom Addition- Design
               Only                                 8             2,500,000

               Fire Alarm Replacement               2             1,700,000

               Gym                                  1             5,000,000

               Gym- Design Only                     3              240,000

               HVAC Boiler Replacement              1             1,400,000

               HVAC Replacement                     6             12,790,000
               HVAC Replacement & Fire
               Alarm Replacement                    1             1,250,000
               HVAC Replacement/ Interior
               Painting                             1             4,000,000

  FY 2022
               HVAC/ Controls Replacement           1             3,100,000
               HVAC/ Fire Alarm
               Replacement/ Int. Painting           1             1,900,000

CIP Proposal   New Build- Design Only

               Roof Replacement
                                                    1

                                                    6
                                                                  4,770,000

                                                                  18,850,000
               Roof Replacement/ Civil
               Improvements                         1             2,400,000
               Roof/ HVAC/ Fire Alarm
               Replacements                         2              6,600,00

               Stadium Improvements                 2             3,500,000

               STEM Building Addition               1             1,000,000

               Grand Total                          39           $75,000,000
Board Member Reflections on
              General & CIP Budgets ?

            1. What resonated with you on the General &
               CIP Budgets?

            2. What do you think our next steps should be?
  Board     3. Feedback?
 Member
Check in?
ESSER
COVID Relief
  Funds
Our ESSER To-Do?
          ESSER Introduction

              •    ESSER 1.0
              •    ESSER Allowability & Criteria
              •    Special Legislation
              •    Performance Management of ESSER Funds

              •    ESSER 2.0- How Much Funding?
              •    Needs Assessment

          The ESSER 2.0 Money Game

          A Review with Administration Proposals
  ESSER            •    Learning Loss

Summary            •
                   •
                        Social Emotional Learning
                        ACT Preparatory
                   •    Digital Pedagogy
                   •    Teacher Supports
                   •    Operations & Safety

          Building A Plan with the Board’s & Administration’s Thinking
ESSER 1.0 Update

                            Budget      Reallocation   Amended Budget
           1:1 Device     20,667,790     10,681,543      31,349,333
  Extended Learning;      12,160,222    (10,681,543)      1,478,679
Fall, Spring, Saturdays
          Safety (PPE)     6,121,174         -            6,121,174
       ESSER Finance       224,985           -                -
           Personnel
         Indirect Cost     503,665           -             503,665
      Charter School       7,795,835         -            7,795,835
          Allocation
    Private Allocation     1,159,994         -            1,159,994
       CARES Federal      $48,633,665        -           $48,633,665
            Funding
ESSER 2.0 Areas of Focus by USDOE & TNDOE

• Addressing learning loss
• Addressing learning acceleration
• School facility repairs and
  improvements
• Planning for long term closures
• Unique needs of special populations
• Purchasing educational technology
• Mental health supports
• Other approved activities
2021 Special Session Legislation
                                Programming
                                                                             After School Summer Learning
   Summer Learning Camps              Learning Loss Bridge Camps
                                                                                      Mini Camps

• 6 hours of daily programming • 6 hours of daily programming            • These are also known as “STREAM”
                                                                           Mini Camps. (STREAM is “Science
• 4 Hours Daily: 1hr. Reading,     • 4 Hours Daily: 1hr. Reading, 1hr.     Technology, Reading, Engineering,
  1hr. Math, 1 hr. intervention,     Math, 1 hr. intervention, and 1       Arts, and Math)
  and 1 hr. play.                    hr. play.
                                                                         • 1 hr. of programming focused on a
• Students entering grades 1-5     • Students entering grades 6-8          STREAM educational approach

• 5 Days per week for 6 weeks      • 5 Days per week for 4 weeks         • Students entering grades 1-5

                                                                         • 4 Days per week for 6 weeks
                                                                           provided by a licensed teacher or
                                                                           TN ALL Corps Member.
2021 Special Session Legislation
                                     Participation Eligibility
                                                                                                After School Summer Learning
     Summer Learning Camps                       Learning Loss Bridge Camps
                                                                                                         Mini Camps
•   Students entering grades 4-5 who        •   Students entering grades 6-8 who scored   •   Students entering grades 4-5 who scored
    scored proficient in math or ELA on         at Approaching or Below in math or ELA        proficient in math or ELA on the student’s
    the student’s most recent TCAP              on the student’s most recent TCAP or          most recent TCAP
                                                state adopted bench assessment.
•   Students entering grades 1-3 who            2022/2023                                 •   Students entering grades 1-3 who attends a
    attends a school with fewer than 50%                                                      school with fewer than 50% of grades of 3-5
    of grades of 3-5 students are                                                             students are proficient in math or ELA on the
    proficient in math or ELA on the most   •   Students entering grades 4-8 who scored       most recent TCAP
    recent TCAP                                 at Approaching or Below in math or ELA
                                                on the student’s most recent TCAP or      •   Students entering grades 1-4 who scored
•   Students entering grades 1-4 who            state adopted bench assessment. 2024          below proficient in math or ELA on the state-
    scored below proficient in math or                                                        adopted bench mark assessment.
    ELA on the state-adopted bench
    mark assessment.                                                                      •   Students entering 1-5 who is eligible for TANF.

•   Students entering 1-5 who is eligible
    for TANF.
Performance Management
              • All key strategies for ESSER funds are being folded into
                the performance management cadences that are for
                the strategic plan initiatives

                 • Meetings specific to recovery strategies every
                   week.

              • All strategies are being frontloaded with literature
                reviews to affirm and inform best practices and a
    ESSER       complete evaluation plan

Performance      •   Where did the money go?
                 •   Did it have an impact?
Management       •   How do we know?
                 •   Data will be used to inform Long term impact and
                     future resource allocation
Performance Management
                  Dashboard Sample

    ESSER
Performance
Management
ESSER 2.0 Funding

                       Funding    224,032,803
     Charter Schools Allocation   (40,224,117)
                  Indirect Cost   (23,895,129)
       Net ESSER 2.0 Allocation   $159,913,557

   Summer Learning Camps (ES)      7,969,531
       STREAM Mini Camps (ES)      2,277,009
            Bridge Camps (MS)      2,974,690
        Charter School Camps      (2,379,821)
     Total Allocation for Camps    10,841,408

        Total Funding Available   $170,754,965
Administration’s Need’s Assessment
Addressing COVID-19 Impact                                                 Operations &
                                                                           Safety Supports
                             Remote Learning            Social Emotional
                                Supports                    Supports          Addressing
                                                                              Learning Loss

                                                        Teacher & Leader
                                                        Supports
     ESSER & Grant
     Management

                                           Academic
                                          Enrichments

                                                   Returning Stronger & Sustainability
The Money Game

                ❑ Each Board Member has the following:

                   •   Criteria for ESSER 2.0 Spending
                   •   Copy of the Board’s Strategic Priorities
                   •   Legislation Update
                   •   Dollars in $170M
The ESSER 2.0      •   Administration’s Proposals

Money Game      ❑ Take 15 min individually on your flip charts and
                  draft how you would propose spending funds

                ❑ Each Board Member Reports Out
ESSER 2.0 Continuation

                ❑ Administration Review of Proposals

                ❑ After each section, we will review for alignment
                  and pause for Board Member Questions.

                ❑ Discuss next steps
The ESSER 2.0
 Continued
Learning Loss
Winter 2020-21 i Ready
                   Diagnostic Summary
                The following slides provide a high-level summary
                of the iReady Winter 2020-21 Diagnostic
                Assessment Participation/Completion rates and
                student-level placement for grades K-8 with some
                comparisons to previous diagnostic window
                data.
Learning Loss   The iReady Winter Diagnostic (the District’s
                Intervention Program for progress monitoring)
                window was from January 11 – 29, 2021. The data
                for this presentation was downloaded directly
                from the iReady platform on February 4, 2021.
Winter 2020-21
                                       iReady Diagnostic Summary
                                              K-8, Reading
   On average, for the Winter 2020-21 iReady Reading Diagnostic, the higher the grade, the higher the percentage of students at two or
   more grade levels below. Kindergarten and 3rd grade students had the highest percentage of students on or above grade level.

   The slides that follow show a comparison by grade of the previous year’s diagnostic assessments. Kindergarten students had a significant
   increase in the percentage of students scoring on or above grade level in reading compared to previous diagnostics.

                                             On or Above Grade Level   One Grade Level Below   Two + Grade Levels Below
          100%
                                       5%
           90%
                        27%                   26%
           80%                                                   39%             39%
           70%                                                                                    53%                58%            60%
                                       54%                                                                                    61%
           60%
                                              36%
           50%                                                   19%
                                                                                 34%
           40%
                        73%                                                                       21%                16%      12%   13%
           30%
           20%                         41%    38%                42%
                                                                                 27%              25%                26%      27%   27%
           10%
            0%
                         K              1      2                  3                4               5                      6    7     8

Data pulled from iReady on 2/04/2021
Winter 2020-21
                                             iReady Diagnostic Summary
                                                      K-8, Math
   On average, for the Winter 2020-21 iReady Math Diagnostic, the higher the grade, the higher the percentage of students at two or
   more grade levels below. Kindergarten and 1st grade students had the highest percentage of students on or above grade level. The
   slides that follow show a comparison by grade of the previous year’s diagnostic assessments.

   Kindergarten students had a significant increase in the percentage of students scoring on or above grade level in reading compared to
   previous diagnostics.
                                                On or Above Grade Level   One Grade Level Below   Two + Grade Levels Below
      100%
                                       9%
       90%
                                                27%
                                                                    33%
       80%          40%                                                             38%              43%                 48%
       70%                                                                                                                       55%   56%

       60%                             54%

       50%                                      44%
                                                                    42%
       40%                                                                          38%
                                                                                                     34%                 28%
                                                                                                                                 22%   19%
       30%          60%
       20%                             36%
                                                29%                 25%                                                  24%           26%
       10%                                                                          23%              22%                         23%
        0%
                     K                  1        2                   3                4               5                      6    7     8

Data pulled from iReady on 2/04/2021
Learning Loss Recovery

  Strategy/Accountability         Description              Cost                        Benefits                           Evidence of
                                                                                                                     Success/Implementation
6-week                         Target students    $69.4M                  •   Mastery of pre-requisite skills   •   10% increase on pre-post
5th Quarter for all Students   below a specific                           •   Reduce Behavior                       assessment during institute
Summer 2022/2023               academic           YR 1 - $34.7M               challenges                        •   93% attendance rate for
                               threshold will                             •   Reduce dropouts                       enrolled students
ACT Prep Summer                receive            YR 2- $34.7M            •   Increase in student school        •   7-10% reduction in RTI
Academy for High School        instructional                                  and district performance              diagnostic data for student 2+
Students                       support in ELA                                                                       grade levels below
                               and Math.

                                                       Annual Cost Details
                                                          Contracts
                                      Stipends                                   Supplies            Total
                                                       (Transportation)
                                       $19.5M                $4.4M                $10.8M           $34.7M
Learning Loss Recovery Interventionists

  Strategy/Accountability                Description                  Cost                  Benefits                        Evidence of
                                                                                                                       Success/Implementation
Provide intensive instructional     A Multi-Tiered Student    $5.8M          •   Tier II and Tier III student’s   •   Reduced number of Tier II and
support in ELA & Math to Tier II    Support Specialist will                      academic deficit areas               Tier III students at each priority
and Tier III students in Priority   provide instructional     YR 1 - $2.9M       addressed                            school
Schools                             support to Tier II and                   •   Small group intervention         •   Proficiency rates increase by 5-
                                    Tier III students in a    YR 2- $2.9M        support provided by a                10% at each priority school
                                    small group setting                          trained professional             •   Reduction in behavioral
                                                                             •   Academic intervention                infractions due to increased
                                                                                 needs being met in a                 student engagement
                                                                                 structured environment

                                                               Annual Cost Details
                                            FTE’s                Positions        Stipends               Total

                                              36                  $2.7M             $168K               $2.9M
ESL Support

      Strategy/                     Description                      Cost                     Benefits                        Evidence of
    Accountability                                                                                                      Success/Implementation
•    Additional        •   Extension to full day of ESL Year 1   $600K            •     Full day allows more time   •     Pre & Post Assessments
     support for ELs       Student Summer Camp (K-11) for                               for newcomers to develop
     during 5th            learning loss                         YR 1 - $300K           language and engage         •     Increased instructional
     Quarter                                                                            with academic discourse           scaffolds and use of
                       •   Provide targeted EL support within    YR 2- $300K            with peers                        language objectives
                           5th quarter via hiring ESL teachers                    •     Targeted EL support               across all content areas
                           and Bilingual Mentors                                        provides continued
                                                                                        language development to     •     Increased percentage of
                                                                                        WIDA levels 1.0-3.4               ELs reaching ESSA ELPA
                                                                                                                          Growth Measure

                                                         Annual Cost Details
         Let’s Check Our Thinking
           Where do we align?                            PTE’s              Positions

                                                          50                   $300K
Social Emotional
    Supports
Social Emotional Supports

     Strategy/                   Description                       Cost                   Benefits                                 Evidence of
   Accountability                                                                                                             Success/Implementation
Expansion of ReSet      •   Designed to help prevent       $9.2M          •   Allows implementation of effective
Rooms to all                the escalation of                                 practices that decrease out-of-            •   30 Pilot schools in the first year of
Elementary and Middle       inappropriate student          YR 1 - $4.6M       school suspensions, improve grades,            implementation averaged a 6%
schools                     behaviors by addressing                           improve attendance, improve SEL                decrease in exclusionary
                            academic, emotional,           YR 2 - $4.6M       skills, and increase instructional time        consequences and greatly
                            and/or behavioral issues                          due to few behavior infractions.               improved time on task in
                            before they become a                                                                             classrooms.
                            crises.
                                                                          •   Expanding direct mental health             •   1,373 students visited ReSet rooms
                                                                              services to include evening hours              in Pilot schools, with 75% returning
                        •   Creation of two Mental                            will provide flexibility for parents and       successfully to class within 30-60
                            Health Centers to operate in                      students, without disrupting                   minutes
                            the North and South areas                         instructional time and provide
Creation of two             of the County and provide                         convenient times for working
evening Mental Health       individual and family                             parents to participate in therapy          •   Three schools saw 15- 17%
Centers                     therapy through 7 PM.                                                                            decreases in student suspensions.
Social Emotional Supports Continued
Strategy/Accountabili                 Description                   Cost                     Benefits                             Evidence of
          ty                                                                                                                 Success/Implementation
                                                               $9.2M          • Strengthen universal prevention and
Universal ACEs/trauma        •   Early identification of                        early identification of students who    •   This proposal calls for student and
screening for all students       trauma-related distress       YR 1 - $4.6M     have been adversely impacted by             parent education to inform about
and professional                 would begin with                               the socio-economic disruption               the warning signs of trauma-related
development for                  screening, parent             YR 2 - $4.6M     caused by the coronavirus                   distress and actions that can be
school/district staff,           outreach, behavioral                           pandemic;                                   taken to reduce vulnerabilities and
parents, and                     monitoring, and transition                                                                 hasten recovery. For students
administrators                   to systematic mental health                  • Provide critical prevention and early       already manifesting signs of
                                 services for students with                     intervention support to teachers and        trauma, an early identification
                                 evidence of traumatic                          student support staff who may be            campaign designed to divert at-risk
                                 exposure.                                      experiencing occupational burnout           students to secondary and tertiary
                                                                                secondary to the extreme adaptive           intervention would significantly
                                                                                challenges presented by the                 enhance coronavirus response
                                                                                pandemic and compassion fatigue             efforts within this school district.
                                                Let’s Check Our Thinking        associated with their roles as first
                                                  Where do we align?            responders to student trauma.
                                                                                                                Annual Cost Details
                                                                       FTEs     Positions       Contracts        Supplies        Equipment            Total

                                                                       76        $3.3M             $1.1            $120K            $106K            $4.6M
Academic
Enrichments
ACT Preparation

    Strategy/                      Description                     Cost                  Benefits                   Evidence of
  Accountability                                                                                              Success/Implementation
ACT Prep University   The program offers academic              $2.6M          •   Metrics of Success:        SCS is using the research
                      support for high school students by                         Increase the number of     from the University of
                      utilizing college students as mentors    YR 1 - $1.3M       students who score 21 or   Chicago, as well as the
                      and tutors.                                                 above in the ACT.          Network for College Success
                                                               YR 2- $1.3M                                   and the National Freshman
                                                                                                             Institute.

                                                     Annual Cost Details
    Let’s Check Our Thinking
      Where do we align?                                      Contracts

                                                               $2.6M
Enhancing Digital
   Pedagogy
Digital Pedagogy
  Strategy/Accountability         Description              Cost                          Benefits                        Evidence of
                                                                                                                    Success/Implementation
Provide professional           Year-long          $4.1M                      •   In-depth understanding of     •   Academic performance
learning support to            professional                                      the different instructional       increase in all content areas
teachers, principals,          development        YR 1 - $2.05M                  models in a blended           •   Lower chronic absenteeism
families, and central office   focused on                                        learning environment;         •   Increased participation in
status on blended learning     instructional      YR 2- $2.05M                   maximum use of digital            professional learning
                               models and                                        devices; increased student        opportunities from teachers
                               strategies to                                     engagement through use        •   Instructional culture survey
                               increase                                          of teacher pedagogy and           results increase
                               academic                                          student buy-in
                               performance
                               through digital
                               devices

                                                     Annual Cost Details
                                                 Contracts        Supplies          Total

                                                  $1.95M           $100K          $2.058M
Remote Learning Continued Supports

       Strategy/                        Description                    Cost                    Benefits                    Evidence of
     Accountability                                                                                                  Success/Implementation
Our 1:1 digital device        •   Our initial device plan          $17.3M           •   Minimize the learning loss   Enhance local economic
plan is part of our               included $105 million                                 resulting from the current   development, reduce crime
ongoing commitment to             commitment to supports           YR 1 - $8.65M        health crisis while          and unemployment in the
student equity and 21st           over a four-year span. The                            permanently closing the      Shelby County community
century learning to               following support will           YR 2- $8.65M         digital divide and           by improving literacy and
prepare our students for          alleviate fiscal burden for                           academic gaps that           creating a technologically-
college and careers. We           the following cost: Florida                           currently exist for Shelby   literate graduating
believe the addition of           Virtual Schools, Student                              County students by           workforce.
modern technology into            Internet Access, IT Personnel                         providing access to
daily instruction will open       Supports, Cyber Security,                             meaningful learning
up amazing new learning           and Lost/Replacement                                  technology resources.
possibilities!                    Devices.

                                                        Annual Cost Details
         Let’s Check Our Thinking                  Contracts      Equipment         Total
           Where do we align?
                                                     $6.5M          $2.1M          $8.65M
Teacher & Leader
    Supports
Build Teacher Capacity
       Strategy/                   Description            Cost                      Benefits                        Evidence of
     Accountability                                                                                            Success/Implementation
Reduce Adult/Student    •   Classrooms will           $20.8M          •    Reduce unemployment            •   10% increase in On
Ratio in K-1                receive a fulltime ed                     •    Community investment               Track/Mastery for students in
                            assistant who has         YR 1 - $10.4M   •    Poverty rate reduction             3rd grade on TN Ready in 2022-
•   95% attend in PD        been supported on                         •    Market share increase              2023 (annually)
•   Logged support          foundational skills       YR 2 - $10.4M   •    More students attending SCS;
    transcripts             instruction and best                           more state/federal funding     •   5% reduction in K-1 vacancies
•   Support Summer          instructional                                                                     in 2022-2023 (7-10% annually)
    Learning                practices.
                                                                                                          •   50% reduction in K-1
                                                                                                              behavioral referrals in 2022-
                                                                                                              2023 (7-10% annually)

                                                                                                          •   7-10% increase in ready
                                      Annual Cost Details                                                     graduate and graduation rate
                                                                                                              for cohort of students once
                            FTEs          Positions    Supplies           Total                               they are seniors.

                            250            $9.7M        $760K         $10.4M
Teacher Recruitment
      Strategy/                Description               Cost                    Benefits                      Evidence of
    Accountability                                                                                        Success/Implementation
Teacher Recruitment     Viable staffing option for   $5.24M          •   National recruitment is      Providing qualified, licensed,
Opportunities           school districts with                            required to bring teacher    candidates to fill SCS’s high-need
                        existing vacancies in        YR 1 - $2.87M       candidates to Memphis and    teaching vacancies.
                        elementary and                                   support teacher licensure.   Candidates are licensed and do
Virtual Teacher         secondary settings (ES &     YR 2 - $2.87M                                    not require permits.
Recruitment             MS & HS).                                                                     Develop and support existing
(Additional EOC)                                                                                      District employees, reducing the
                        Virtual learning can be                                                       need to hire new educators on
                        an option to fill semester                                                    permits.
Teacher Licensing       or year-long vacancies
                        in any subject

                                                                                                      Number of vacancies filled

                      Annual Cost Details
             FTEs       Positions      Supplies         Total
                                                                          Let’s Check Our Thinking
                                                                            Where do we align?
             250         $9.7M           $760K         $10.4M
Operations &
Safety Supports
Operations- Needlepoint Bipolar Ionization

    Strategy/                  Description             Cost               Benefits                       Evidence of
  Accountability                                                                                    Success/Implementation
Improve Indoor Air        Install Needlepoint                    •   Improves IAQ of school     •    Reduced VOC’s in the air
Quality (IAQ) of school   Bipolar Ionization       YR 1 - TBD        and central office         •    Eliminated presence of the
and central office        Technology in all HVAC   Waiting on        buildings                       COVID-19 virus in school and
building                  systems                  competitive   •   Reduces airborne                central office buildings
                                                   bidding           transmission of COVID-     •    MERV-13 rating achieved for
                                                   process           19 and other pathogens          HVAC filtration systems
                                                                 •   Deactivates and kills up
                                                                     to 99.94% of the COVID-
                                                                     19 virus.
                                                                 •   Increases effective
                                                                     MERV rating of existing
                                                                     HVAC filtration from
                                                                     MERV-8 to MERV-13.
Needlepoint Bipolar Ionization

NPBI Advantages
Needlepoint Bipolar Ionization

NPBI Testing Summary
Operations- COVID Testing
      Strategy/                  Description                 Cost                     Benefits                        Evidence of
    Accountability                                                                                               Success/Implementation
•   COVID Testing for     •   Districts can expand        $6.0M            Testing performed in                 Public health officials and school
    Students, Teachers,       capacity to administer                       schools can play an important        administrators may consider
    and Staff.                coronavirus testing,        YR 1 - $3.0M     role in assisting public health      placing a higher priority for testing
                              monitor the virus, and                       officials in identifying teachers,   in schools that serve populations
                              support other activities    YR 2- $3.0M      staff, or students who have          experiencing a disproportionate
                              related to coronavirus                       COVID-19 symptoms or who             burden of COVID-19 cases or
                              testing for students,                        had recent close contact             severe disease. These may
                              teachers, and staff                          (within 6 feet for a total of 15     include:
                                                                           minutes or more) with                Schools with moderate or large
                                                                           someone with COVID-19.               proportions of racial and ethnic
                                                                                                                groups that have experienced
                                                                                                                higher rates of COVID-19 cases
                                                                                                                relative to population size.
                                                         Annual Cost Details                                    Schools in geographic areas with
                                                                                                                limited access to testing due to
                                                                  Other Charges                                 distance or lack of availability of
                                                                                                                testing.
                                                                        $3.0M
Operations- Addressing Facilities Needs

      Strategy/                 Description           Cost                    Benefits                      Evidence of
    Accountability                                                                                     Success/Implementation
•   Address Deferred      Replace HVAC equipment   $5.5M            •   Replace aged, unreliable   •    Reduced equipment
    Maintenance needs                                                   HVAC equipment                  downtime
    of school buildings   •   Havenview MS         YR 1 - $5.5M     •   Reduce equipment           •    Reduced maintenance costs
                          •   Crump ES                                  downtime an repairs        •    Reduced energy costs
                          •   Egypt ES                              •   Improve IAQ                •    Improved IAQ
                          •   Fox Meadows ES

                                               Annual Cost Details
                                                   Capital Outlay

                                                       $5.5M
Athletics Safety
                          Reconditioning/Recertification
      Strategy/                    Description                      Cost                     Benefits                             Evidence of
    Accountability                                                                                                           Success/Implementation
•    Helmet               National Athletic Equipment Re-       $500K           •   Cleaning, sanitizing,                •    Increased compliance with
     reconditioning and   conditioners Association                                  repair/restoration and testing of         National Guidelines for safety
     recertifying         recommends helmets issued during      YR 1 - $250K        athletic equipment to the            •    Support for additional supplemental
     according to         the time of Covid-19 and prior to                         original performance standard             safety equipment needed to avoid
     manufacturer         being reissued to another athlete     YR 2 - $250K    •   National Operating Committee              loss of athletic programs
     guidelines           be reconditioned/recertified along                        on Standards for Athletic            •    Documentation supporting
                          with sanitizing non-certifiable                           Equipment standards are                   appropriate use
•    Equipment            equipment                                                 adopted by National
     sanitization in                                                                Federation of State High School
     accordance to                                                                  Associations
     manufacturer                                                               •   Safety equipment while
     guidelines &                                                                   participating in sports is crucial
     purchasing of                                                                  in preventing and lessening the
     recommended                                                                    impact of sports-related injuries.
     safety equipment

                                                               Annual Cost Details

            Let’s Check Our Thinking                               Capital Outlay

              Where do we align?                                        $250K
Budget Priorities
                    Strategic Budget Development
                                                FY 2022 Investments
                                                    $120,541,664
  Strengthen Early (K-2) and Continuing     Recruit and retain the best        Create relevant and equitable             Operational Safety Supports
             Literacy (3-12)               district leaders and teachers   academic choices to ensure scholars
                                                                           are prepared for the global workforce

Fifth Quarter Extended $34.7M              2% Annual Salary Increase       1 to 1 Device Initiative $8.7M            Needlepoint Bipolar Ionization $23M
Build Teacher Capacity: Reduce             $15.7M                          ESL Support $300K                         Covid Testing $3M
Adult/Student ratio K-2 Class Size Ratio   Recruitment & Early             ACT Preparation $1.3M                     Addressing Facility Needs and
$10.4M                                     Incentives For Prospective      Digital Pedagogy $2.1M                    Deferred Maintenance $5.58M
Learning Loss Recovery Interventionists    Teachers $100K                  Clue Expansion $1M                        Athletics Safety $251K
$2.9M                                      Relocation For Teachers         Equity African American Male Initiative
                                           $308K                           $979K
                                           Teacher Referral $15K           District Branding $900K
                                           Grow Your Own Partnerships      Health High School $1.5M
                                           $100K                           Social Emotional Supports $4.6M
                                            Leadership Professional
                                           Development $250K
                                           Teacher Recruitment $2.6M
How do we incorporate the
                    Board’s Thinking?
                • Gather All Feedback from Today

                • Cross Check with Administration

                • Highlight Non-negotiables

                • One on Ones with Each Board member

The ESSER 2.0   • Check in with Board Chair and ABF Co Chairs

  Review?       • ABF Summary Where Idea’s were Incorporated
Next Steps, Board Feedback & Touch Points
                      Feb 27, 2021                              March 9, 2021
     01                High Level
                        Review &
                                             03                 Audit, Budget,
                                                               Finance FY 2022
                                                                                      05
                    Discussion Board                               Budget
                         Retreat                                  Discussion

 Feb 19, 2021                          Week of March 1, 2021                     March 23, 2021
 Detail Review                          One on Ones for
                                                                                 Proposed Budget
of Budget Details
                         02             Further Budget
                                            Details
                                                                    04             Delivered to
                                                                                  Board for Vote
Discussions &
Closing Remarks
Thank you
You can also read