FY20 Results Presentation - 26 February 2021 Hadyn Stephens - CEO Kerri Leech - CFO
←
→
Page content transcription
If your browser does not render page correctly, please read the page content below
FY20 Results Presentation
26 February 2021
Hadyn Stephens – CEO
Kerri Leech – CFO
Important Notice and Disclaimer

 This presentation has been prepared by Waypoint REIT (“WPR” or                Industry data and third party market data                                            exchange rates, competition in the markets in which WPR operates
 “Waypoint REIT”) which is a stapled entity comprising shares in               This presentation contains statistics, data and other information relating           and the inherent regulatory risks in the business of WPR such forward
 Waypoint REIT Limited (ABN 35 612 986 517) (“Company”) stapled                to markets, market sizes, market shares, market positions and other                  looking statements, and many of these factors are beyond WPR’s
 with units in the Waypoint REIT Trust (ARSN 613 146 464) (“Trust”).           industry data pertaining to WPR’s business and markets. You should                   control.
 VER Limited (ABN 436 609 868 000 and AFSL 483795) is the                      note that market data and statistics are inherently predictive and
 Responsible Entity of the Trust. The information provided in this             subject to uncertainty and not necessarily reflective of actual market               You should rely on your own independent assessment of any
 presentation should be read in conjunction with WPR's other periodic          conditions.                                                                          information, statements or representations contained in this
 and continuous disclosure announcements lodged with the ASX which                                                                                                  presentation and any reliance on information in this presentation will be
 are available at www.asx.com.au.                                              Future performance and forward looking statements                                    entirely at your own risk. This presentation may not be reproduced or
                                                                               This presentation contains forward-looking statements, including                     published, in whole or in part, for any purpose without the prior written
 Summary information                                                           statements regarding the plans, strategies and objectives of WPR                     permission of WPR. WPR disclaims any intent or obligation to update
 The information in this presentation is in summary form and does not          management, distribution guidance. Forward looking statements can                    publicly any forward-looking statements, whether as a result of new
 purport to be complete. This presentation is for information purposes         generally be identified by the use of forward looking words such as,                 information, future events or results or otherwise.
 only, is of a general nature, does not constitute financial product           'expect', 'anticipate', 'likely', 'intend', 'should, 'could', 'may', 'predict',
 advice, nor is it intended to constitute legal, tax or accounting advice or   'plan', 'propose', 'will', 'believe', 'forecast', 'estimate', 'target', ‘guidance’   Effect of rounding
 opinion. This information does not purport to include or summarise all        and other similar expressions. Indications of, and guidance or outlook               A number of figures, amounts, percentages, estimates, calculations of
 information than an investor should consider when making an                   on, future earnings or financial position or performance are also                    value and fractions in this presentation are subject to the effect of
 investment decision nor does it contain all information which would be        forward looking statements. Such prospective financial information                   rounding. Accordingly, the actual calculation of these figures may differ
 required in a Product Disclosure Statement, or other disclosure               contained within this presentation may be unreliable given the                       from the figures set out in this presentation.
 documents prepared in accordance with the requirements of the                 circumstances and the underlying assumptions to this information may
 Corporations Act 2001 (Cth) (“Corporations Act”).                             materially change in the future. Any forward-looking statements,                     To the maximum extent permitted by law and subject to any continuing
                                                                               including projections, guidance on future revenues, earnings and                     obligations under the ASX listing rules, WPR and VER Limited and
 No investment or financial product advice                                     estimates, are provided as a general guide only and should not be                    each of their respective associates, related entities, officers, directors,
 This presentation has been prepared without taking into account the           relied upon as an indication or guarantee of future performance. You                 employees, agents, consultants and advisers do not accept and
 investment objectives, financial situation or particular needs of any         are cautioned not to place undue reliance on any forward looking                     expressly disclaim any liability for any loss or damage (including,
 particular person. Before making an investment decision, investors            statement. While due care and attention has been used in the                         without limitation, any liability arising out of fault or negligence and
 must consider the appropriate of the information (including but not           preparation of forward looking statements, forward-looking statements                whether direct, indirect, consequential or otherwise) arising from the
 limited to the assumptions, uncertainties and contingencies which may         involve known and unknown risks, uncertainties and other factors that                use of, or reliance on, anything contained in or omitted from this
 affect future operations of WPR and the values and the impact that            may cause WPR’s actual results, performance or achievements to                       presentation. Statements made in this presentation are made only at
 different future outcomes may have on WPR) and rely on their own              differ materially from any future results, performance or achievements               the date of the presentation. WPR is under no obligation to update this
 examination of WPR, including the merits and risks involved having            expressed or implied by these forward-looking statements.                            presentation. The information in this presentation remains subject to
 regard to their own investment objectives, financial situation and needs.                                                                                          change by WPR without notice.
 Each person should consult a professional investment adviser and          A number of important factors could cause WPR’s actual results to
 seek legal, accounting and taxation advice appropriate to their           differ materially from the plans, objectives, expectations, estimates and
 jurisdiction before making any decision regarding a financial product.    intentions expressed in such forward looking statements, and many of
                                                                           these factors are beyond WPR’s control. For example, the factors that
                                                                           are likely to affect the results of WPR include, but are not limited to,
                                                                           general economic conditions in Australia, New Zealand and Asia,

                                                                                                                                                                                                                                                  2
WPR Investment Proposition
 Secure rental income with embedded growth, underpinned by long-term leases to top-tier tenants

                      ESSENTIAL ECONOMIC INFRASTRUCTURE                                                                                                                        WORLD-CLASS OPERATORS
                      • F&C operators focused on everyday needs                                                                                                                • Viva Energy supplies 24% of Australia’s
                      • F&C tenants continued to operate throughout                                                                                                              downstream petroleum market
                        COVID-19 lockdowns (99.9% of rent collected)                                                                                                           • Sites operated by one of Australia’s leading
                                                                                                                                                                                 retailers, Coles (Coles Express)

IRREPLICABLE NETWORK
                                                                                                                                                                                       PREDICTABLE INCOME + GROWTH
• 470 F&C sites acquired/built over 100+ years
                                                                                                                                                                                       • 99.9% occupancy, 10.8-year WALE, predominantly
• Aligned with population density and concentrated in                                                                                                                                    Triple Net leases (91% by income)
  metro locations along Australia’s eastern seaboard
                                                                                                                                                                                       • Strong organic rental growth underpinned by 2.9%1
• 2.2 million sqm of land; underlying land value                                                                                                                                         WARR (3% for fuel tenants)
  estimated at ~50% of overall carrying value
                                                                                                                                                                                       • Further growth potential via acquisitions and
                                                                                                                                                                                         development fund-throughs

                    LOW-COST OPERATING STRUCTURE                                                                                                                               CONSERVATIVE CAPITAL STRUCTURE
                   • $2.9 billion portfolio managed by 8 FTEs                                                                                                                  • Target gearing range of 30-40%
                   • One of the lowest MERs in the ASX REIT 200                                                                                                                • Investment grade credit rating (Moody’s Baa1)2
                                                                                                                                                                               • Diversified debt sources and tenor

1 CPI   assumed at 1.0%.
2 Credit  rating must not be used, and WPR does not intend to authorise its use, in the support of, or in relation to, the marketing of its securities to retail investors in Australia or internationally.
                                                                                                                                                                                                                                             3
Contents:
1. FY20 Highlights              5
2. Financial Results            8
3. Portfolio Update             13
4. Strategy Update              19
5. Key Priorities and Outlook   25
6. Appendices                   27
7. Glossary                     52

                                     4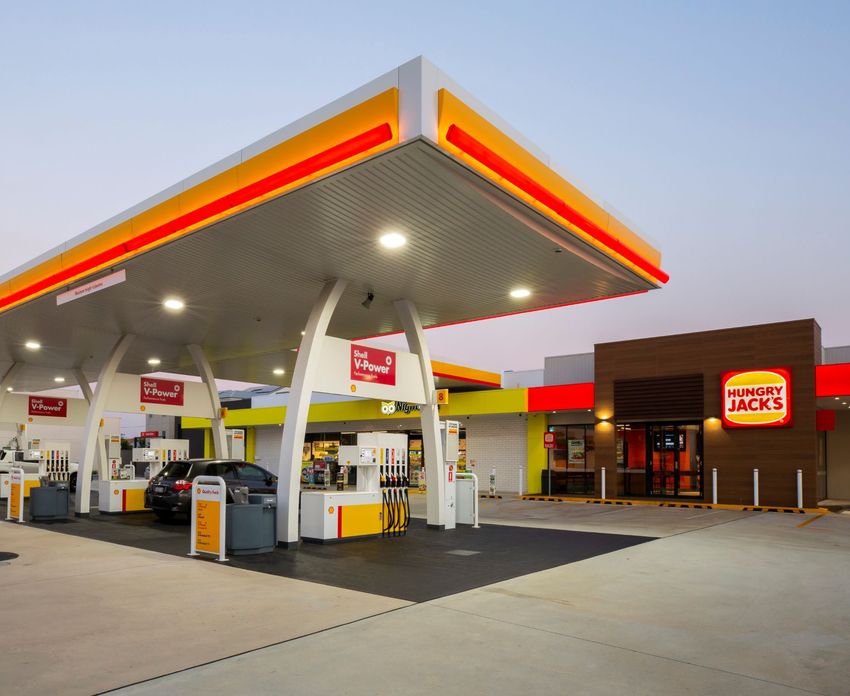
FY20 Highlights

                  5
FY20 Highlights
Strong growth in Distributable EPS and NTA per security, gearing below revised target range

        Financial Performance                                                Property Portfolio                              Capital Management                                    Business Update

           Distributable EPS: 15.15cps1                                $51.3m invested, $5.5m disposals               c.A$250m USPP issuance + $325m bank                       Strong FY20 for F&C operators
                                                                                                                                debt refinanced
                 4.25% growth on FY192                                    5 acquisitions ($32.5m @ 6.25%)                                                                  +18.9% FY20 EBITDA for VEA’s Retail business
         Top end of 4.00-4.25% guidance range                           12 developments ($18.8m @ 6.70%)              Weighted average debt maturity extended by 1.4            +10.5% 1H21 sales for Coles Express
       Minimal impact from COVID-19 (99.9% rent                        2 non-core disposals ($5.5m @ 5.41%)          years to 4.3 years with no expiries until June 2022
                        collected)

              NTA: $2.49 per security                                    $176.7m gross valuation uplift                      $196.5m interest rate swaps                                 Internalisation
                                                                                                                               extended to 5-year term
             +8.7% since December 2019                              $86.6m in 1H20 (2bp cap rate compression)                                                                 Formally completed 30 September 2020
               +4.6% since June 2020                                $89.6m in 2H20 (17bp cap rate compression)                                                                  All permanent employees retained
                                                                                                                                    89% hedged with
                                                                            WACR of 5.62% at Dec-20
                                                                                                                       weighted average hedge maturity of 2.4 years

                      MER: 30bp                                                   $2.90bn portfolio                                  29.4% gearing                                          Guidance
                  2bp increase on FY19                                             470 properties                         100bp decrease since December 2019                    FY21 Distributable EPS of 15.72cps3
    One of the lowest in the S&P/ASX 200 REIT Index                            72% metro / 28% regional               Target gearing revised from 30-45% to 30-40%              Represents 3.75% growth on FY202
                                                                                  10.8-year WALE

1 Based  on weighted average number of securities on issue during the year.
2 Distributable EPS shown to 2 decimal places. Growth calculated on exact figures.
3 Assumes no material changes in market conditions and no other factors adversely affecting financial performance.
                                                                                                                                                                                                                          6
Distributable EPS Growth
FY20 continues WPR’s strong track record of growth in Distributable EPS1,2

                                                                                                                                    +3.75%

                                                                                                                        +4.25%       15.72

                                                                                                                        15.15
                                                                                                               +3.69%

                                                                                      +4.54%                   14.54
                                                                                                                                                 Assumes:
                                                          +5.75%                       14.02                                                     1. No acquisitions
                                                                                                                                                 2. Non-core asset
                                                           13.41                                                                                    disposals of $20-30m
                                                                                                                                                 3. No material changes
                               12.68                                                                                                                in market conditions
                                                                                                                                                 4. No other factors
                                                                                                                                                    adversely affecting
                                                                                                                                                    WPR

                               FY16                        FY17                         FY18                   FY19     FY20     FY21 Guidance

1 Based    on weighted average number of securities on issue during the reported period. FY16 is annualised.
2   Distributable EPS shown to 2 decimal places. Growth calculated on exact figures.
                                                                                                                                                                           7
Financial Results

                    8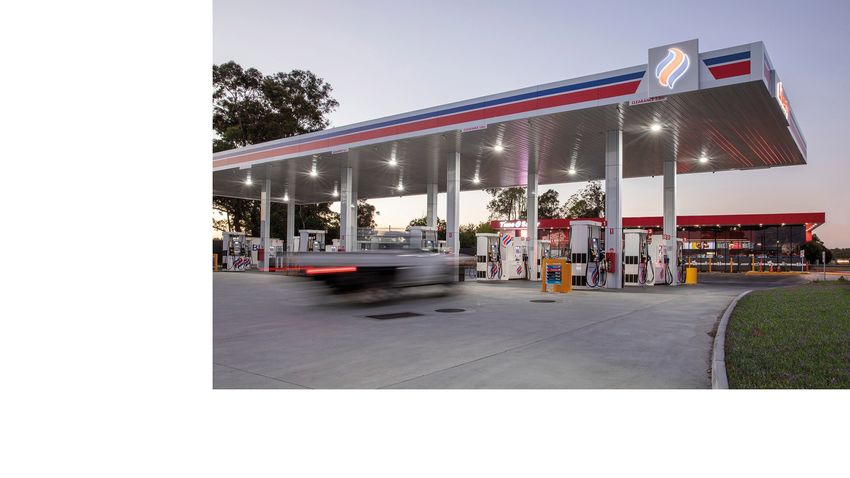
Financial Performance
Distributable Earnings of $118.5m represents 6.1% growth on FY19

                                                                       FY20           FY19         Change           Change
                                                                        $m             $m              $m                %                       $4.2m of like-for-like rental growth at 2.9%, $5.6m of income from acquisitions
                                                                                                                                                   and completed developments, and $1.9m of development coupon income
    Rental income                                                     160.2           148.5             11.7               7.9

    Interest income                                                       0.2            1.4            (1.2)          (85.7)
                                                                                                                                                                   Lower cash rate and development coupon income
                                                                                                                                                                     now included in rental income (FY19: $0.6m)
    Total income                                                      160.4           149.9             10.5               7.0

    M&A expenses                                                          9.3            8.3              1.0            12.0
                                                                                                                                                           Largely driven by higher insurance and statutory costs ($0.8m).
    Interest expense                                                    32.6            29.9              2.7              9.0

    Total expenses                                                      41.9            38.2              3.7              9.7                   Incremental cost of debt-funded acquisitions and developments and the USPP
                                                                                                                                                             issuance partially offset by base interest rate savings
    Distributable Earnings                                            118.5           111.7               6.8              6.1

    Distributable EPS (cents)1                                        15.15           14.54             0.61             4.25

    Statutory net profit                                              279.9           197.6             82.3             41.6                      Difference between Distributable Earnings and statutory net profit largely
                                                                                                                                                represents fair value gains on investment property net of derivative movements,
                                                                                                                                                              borrowing cost amortisation and internalisation costs
    MER2                                                               30bp            28bp            +2bp                7.1

1 Based   on weighted average number of securities on issue during the reported period. Distributable EPS shown to 2 decimal places. Growth calculated on exact figures.
2   Excludes net property expenses of $0.8m (FY19: $0.9m).
                                                                                                                                                                                                                                   9
Components of Distributable EPS Growth
FY20 growth driven by contracted rental growth and debt-funded acquisitions/developments

                                                                                                             Securities issued in
                                                                     Primarily due to                          FY19 (Feb-19
                          2.9% like-for-like
                                                                     higher insurance                        placement + DRP)
                            rental growth
                                                                    and statutory costs                       and FY20 (DRP)

                                                                                            Debt-funded
                                                                                          acquisitions and
                                                 Acquisitions -                            developments
                                               $32.5m @ WACR
                                                   of 6.25%
                                                       +
                                                 Developments -
                                               $18.8m @ WACR
                                                   of 6.70%
                                                       +
                                               Ful year impact of
                                               FY19 transactions

                                                                                                                                    10
Balance Sheet
Strong NTA growth driven by 19 bps of cap rate compression across the portfolio
Dec-20 Dec-19 Change Change
$m $m $m %
Cash and cash equivalents 15.5 27.5 (12.0) (43.6)
Includes $14.3m carrying value of four properties held for sale
Other assets 17.8 6.4 11.4 178.1
Increase due to acquisitions ($32.5m), development spend ($18.8m) and gross
Investment properties 2,897.3 2,684.2 213.1 7.9
valuation gains ($176.7m), less resumption proceeds ($0.8m) and assets
transferred to held for sale ($14.3m)
Total assets 2,930.6 2,718.1 212.5 7.8
Distribution payable 60.7 56.0 4.7 8.4 Gross borrowings increased $25.6m following debt-funded acquisitions and
developments offset by unrealised FX and fair value hedge gains on USPP
Borrowings 845.8 843.1 2.7 0.3 ($20.8m) and higher unamortised borrowing costs ($2.1m)
Derivatives 54.6 25.9 28.7 110.8
Represents fair value derivative movements
(majority of the increase offsets against the $20.8m above)
Other liabilities 16.3 10.2 6.1 59.8
Total liabilities 977.4 935.2 42.2 4.5
Net assets 1,953.2 1,782.9 170.3 9.6
$0.20 increase in NTA due to gross valuation gains ($0.23) offset by
unfavourable derivative movements ($0.02) and internalisation costs ($0.01)
NTA per security $2.49 $2.29 $0.20 8.7
Gearing1 29.4% 30.4% (1.0%)
1 Net debt (excluding foreign exchange and fair value hedge adjustments) / total assets less cash. Net debt is $856.8m, being gross borrowings of $872.3m (see page 12) less $15.5m of cash.
11Debt / Liquidity
Further debt diversification and 1.4 year tenor extension achieved through inaugural USPP and bank re-financing
Dec-20 Dec-19 Change
Facility limit ($m) 1,050.3 1,096.7 (46.4)
Drawn debt ($m)1 872.3 846.7 25.6 Facility limit adjusted to reflect WPR’s current financing needs with $127.3m of
available liquidity to fund opportunities as and when identified
Undrawn debt ($m) 178.0 250.0 (72.0)
Available liquidity ($m)2 127.3 216.0 (88.7) Gearing at 29.4%, just below the
bottom of our revised target gearing range of 30-40%
Gearing (%) 29.4 30.4 (1.0)
Weighted average cost of debt (%)3 3.6 3.5 0.1 WACD relatively unimpacted by inaugural c.$250m USPP issuance
Interest cover ratio (times)4 5.3 5.8 (0.5)
Weighted average debt maturity (years) 4.3 2.9 1.4 WADM extended through refinancing $325m of bank debt
and USPP issuance (at 9.2 years)
Hedge cover (%) 89 94 (5)
Weighted average hedge maturity (years) 2.4 2.8 (0.4) Extended $196.5m of swaps for 5-year term,
reducing the average hedge rate from 2.10% to 1.88%
1 Reflects AUD equivalent of USPP proceeds on date of funding as cross currency swaps in place.
2 Unrestricted cash and undrawn debt net of distribution provision.
3 Interest expense (excluding borrowing cost amortisation) divided by average drawn debt balance.
4 Covenant calculation: Distributable Earnings before interest expense plus straight-line rental income divided by Net Interest Expense (excluding borrowing cost amortisation).
12Portfolio Update
13Portfolio Overview1
Geographically diversified portfolio with a strong weighting to metro locations along the eastern seaboard
Avg. Site Avg.
No. of Value Value Area Value WACR WALE
Properties ($m) (%) (m2) ($m) (%) (years)
Metro 315 2,081.8 72 3,712 6.6 5.26 11.0
7.1% NT
Regional 155 815.2 28 6,736 5.3 6.54 10.3
Total 470 2,897.9 100 4,710 6.2 5.62 10.8 M - $15.7m (3)
R - $18.9m (5)
M - $417.4m (61) QLD
R - $202.9m (38) 6.0%
Geographic split by value 2 Tenant contribution by income M - $176.3m (30)
Other, R - $84.5m (21)
TAS, 1.7% ACT, 2.2%
NT, 1.2% 0.8%
Ampol, 1.7%
SA, 5.2%
WA 6.6% M - $627.6m (87)
WA, 9.0% NSW,
31.1% R - $274.2m (49)
7-Eleven, M - $99.0m (26) NSW
0.7% 5.2%
R - $52.7m (13)
Viva Energy ACT
QLD, Australia, 6.6% 6.1% M - $64.0m (11)
21.4% 96.8% SA
VIC,
28.1%
VIC
5.2% M - $633.3m (87)
Annual rent review type by income Lease structure type by income R - $181.8m (28)
WACR by State.
CPI - 3.5%
Other - 1.3% Double Net Geographic diversification by value (number). M - $47.5m (10)
8.6% 6.1% TAS
R - $2.0m (1)
Fixed 3% or Triple Net
greater - 95.2% 91.4%
1 All figures as at 31 December 2020.
2 Totals may not add due to rounding
14Valuations
Cap rate compression of 17bp across the portfolio in 2H20
• Independent valuations carried out on a further 106 properties as at 31 December 2020 (157 as at 30 June 2020)
• Gross valuation uplift of $89.6 million recorded in 2H20, with the portfolio WACR compressing 17bp to 5.62%
Jun-20 Dec-20 Gross
Dec-20 Gross Gross Valuation Jun-20 Dec-20
Properties Value1 Value1 Uplift2 WACR WACR
# $m $m $m % % Change
Metro 78 495.6 519.2 23.5 5.35 5.11 (24bp)
Regional 28 118.3 124.7 6.4 6.80 6.47 (32bp)
Independent valuations 106 613.9 643.9 30.0 5.63 5.37 (26bp)
Metro 237 1,527.9 1,562.9 35.1 5.43 5.32 (11bp)
Regional 127 665.4 691.1 24.5 6.78 6.56 (22bp)
Directors’ valuations 364 2,193.3 2,254.0 59.6 5.84 5.70 (14bp)
Total portfolio 470 2,807.23 2,897.9 89.6 5.794 5.62 (17bp)
Metro 315 2,023.5 2,081.7 58.7 5.41 5.26 (15bp)
Regional 155 783.7 815.2 30.9 6.78 6.55 (23bp)
1 Gross Value includes committed development expenditure of $0.6m (30 June 2020: $10.9m).
2 Excludes $0.6m development expenditure transferred in from Other Assets and $1.3m capital expenditure spent and/or committed (30 June 2020: $36.3m) less: $0.8m resumptions proceeds received. Also excludes $0.5m uplift on Assets Held for Sale.
3 Excludes $13.9m in relation to 4 assets transferred to assets held for sale in FY20. 4 Inclusive of 4 assets transferred to assets held for sale during FY20.
15Acquisitions and Developments
$51.3m spent in FY20 on 5 acquisitions and 12 developments (6 complete, 6 in progress)
Acquisition State Location Value ($m) WACR WALE1
Greenvale Vic Metro 5.2 5.5% 15.0
Meadow Springs WA Metro 7.3 6.0% 12.2
Colac West Vic Regional 6.8 6.8% 14.4
Redcliffe WA Metro 10.4 6.1% 12.7
Emerald Qld Regional 2.8 7.5% 10.3
TOTAL 32.5 6.25% 13.1
Total 2020 Target Acquisition
Total 2020
Shell & Hungry Jacks Redcliffe, WA
Completed spend spend Developments spend spend PC
developments ($m) ($m) WACR WALE1 in progress ($m) ($m)2 Date WACR WALE1
Albany, WA 4.5 0.2 7.0% 13.4 Griffith, NSW 4.9 1.9 Mar’21 7.0% 13.2
Richmond, QLD 6.3 0.5 7.0% 14.0 Biloela, QLD 5.4 3.3 Apr’21 7.0% 15.0
Moruya, NSW 5.1 0.4 7.0% 13.9 Sarina, QLD 3.3 2.3 Mar’21 7.0% 13.3
Townsville, QLD 3.5 0.4 7.0% 15.0 Dalby West, QLD 5.0 5.0 Apr’21 7.0% 15.0
Traralgon, QLD 5.4 0.2 7.0% 15.0 Greenvale, VIC 3.8 3.8 Apr’21 5.5% 15.0
Warragul, VIC 3.0 0.1 7.0% 13.4 Cataby, WA 1.3 0.7 Jul’21 7.0% 17.7
TOTAL 27.8 1.8 7.0% TOTAL 23.7 17.0 6.64%
Development Site
Liberty Townsville, QLD
1 WALE at time of acquisition or Practical Completion.
2 Excludes remaining contracted/committed expenditure of $0.6m to be spent in 2021.
16Non-Core Disposals
Two assets sold in FY20 at a premium to book value, $20-30m of potential sales identified for FY21
• WPR has commenced the process of identifying and selling non-core Lease Sale Price
assets within its portfolio State Location Expiry ($m) Yield
• Three assets were taken to public auction in December 2020: Sold:
Minto NSW Metro Aug-26 2.96 4.52%
– Two assets were sold for a combined price of $5.5 million and 14.3%
premium to June 2020 carrying value Maitland NSW Metro Aug-26 2.55 6.44%
Compulsorily acquired:
– WPR is currently working with a third party for the potential sale of the
third asset in 1Q21 Macleod VIC Metro Aug-32 TBC TBC
• A further $20-30m of potential non-core asset sales have been identified
for the remainder of FY21, and these disposals have been reflected in
WPR’s FY21 guidance
• Coles Express Macleod (VIC) was compulsorily acquired by the Victorian
Department of Transport in January 2021 as part of the North East Link
project
– Initial compensation offer of $5.95m reflects a 13.1% discount to WPR’s
December 2020 carrying value of $6.8m (supported by independent
valuation) Sold – Minto, NSW Sold – Maitland, NSW
– WPR is currently negotiating the final compensation with the
Department of Transport in line with the statutory processes and
timetable
17FY21 F&C Lease Expiries1
Three VEA leases expiring in FY21 (0.7% of income)
Passing
Property State Location Expiry Rent Status
Blaxland NSW Metro May-21 $331,028 • Acquired in March 2017
• VEA has a 5-year option from expiry, subject to market rent determination
(0.20% of • Independent expert appointed by WPR and VEA in December 2020; determination imminent
total rent)2 • VEA has one month from the date of the market rent determination decide whether or not to exercise
its option at the determined rent
Caboolture QLD Regional Jul-21 $242,240 • Acquired in July 2018
• Letter of Intent was entered into with VEA at the time of acquisition for a new 15-year ‘IPO lease’ from
(0.15% of expiry in July 2021, with commencing rent to be prior year’s rent + CPI
total rent)2 • Under the current lease, the Landlord is generally responsible for structural repairs and maintenance;
the parties are currently undertaking an assessment of the property’s improvements prior to entering
into the new lease
Halfway Creek NSW Regional Sep-21 $521,320 • Acquired in March 2017
• Highway Service Centre in a strategically important location, directly accessible from the Pacific
(0.32% of Highway
total rent)2 • VEA has a 5-year option from expiry, subject to market rent determination
• The market rent clause in the lease has a ratchet, i.e. it cannot be less than passing rent
• The option/rent review process commences in March 2021
1 In addition to the three VEA lease expiries, there are currently two vacant non-fuel tenancies and a further two non-fuel tenancies expiring in FY21. These four leases combined have an estimated annual market rent of $372k (0.23% of total
income). WPR is at various stages of negotiation with existing/new tenants in relation to these tenancies.
2 Total rent roll as at 31 December 2020.
18Strategy Update
19F&C Sector Trends
There are a number of ‘mega trends’ that will impact the F&C sector over the long-term
• Transition to EVs is inevitable; however, • Customer visitation remains focused on fuel
timing remains highly uncertain offering (80% buy fuel only4); however market
• Australia continues to lag other global offers and consumer behaviours are rapidly
markets, with EVs accounting for only evolving
0.6% of new sales in 20191 • Price and location (proximity to work/home) are
• Key impediments include price the key determinants in deciding where to fill up,
differential, lack of charging infrastructure, and ~90% of consumers are loyal to one or a
range anxiety, limited model availability handful of sites4
and limited direct government support • The convenience offer is a much more important
• The CSIRO currently forecasts EVs to Key consideration for those living in inner city areas
and those aged under 304
reach cost parity with ICEs between 2025 Mega-Trends
and 2035 and account for ~25-40% of the • Significant potential for further growth, with ~70%
total fleet by 2040 (~35-45% by 2050)2 of consumers rarely/never citing the convenience
Convenience Next-Gen Mobility offering as a driver of where to stop4
• Liquid fuels are projected to remain the
most commonly used fuels by the heavy • Behaviour/experience in more advanced markets
freight industry given their high energy- is very different, e.g.
density and convenience to store and
Next-Gen – In the US, 70% of gross profit is generated
handle3
Mobility from store sales, and 70% of store sales are
generated by customers not buying fuel5
– in the UK only 19% cite fuel as their main
reason for stopping6
• Electrified AVs and MaaS potentially represent threats to traditional
service stations (less vehicles on the road, less fuel consumed)
• AV technology improving at a rapid rate; however, safety/regulatory
issues likely mean this remains a long-term threat
1 Electric Vehicle Council, State of Electric Vehicles – August 2020. 5 Source: Realty Income, January 2021 Institutional Investor Presentation.
2 CSIRO, Projections for small-scale embedded technologies – June 2020 (Slow/Central/Fast Scenarios). 6 KPMG, Fuel Forecourt Retail Market – August 2020.
3 Federal Government Future Fuels Strategy Discussion Paper, February 2021.
4 ACAPMA, 2019 Monitor of Fuel Consumer Attitudes. 20Implications for the F&C Sector
Long-term trends will impact landlords; however, direct ability to adapt is limited to portfolio management
• Primary responsibility for dealing with the trends impacting the F&C sector over the long-term rests with the operator:
– F&C properties are typically subject to long-term leases arrangements with both tenants (e.g. Viva Energy Australia) and sub-tenants (e.g. Coles Express)
– The leases/sub-leases typically cover the entire site and grant quiet enjoyment rights to the operator
Fuel Offer Convenience Offer F&C Networks
• Demand for traditional fuels • The convenience offer will become • Less fuel required overall
expected to remain resilient in the an increasingly important driver of (alternative fuels and Next-Gen
near-to-medium term, particularly for site traffic, and will ultimately Mobility)
freight transport (~43% of Australian overtake fuel as the key driver of
fuel consumption) profit and sales • Uncertainty created by long-term
trends means that, over time,
• Key factors underpinning demand • Lines between C-stores, QSR and operators will de-risk networks by
include population growth, supermarkets will blur, and adjacent exiting weaker sites
population dispersion, reliance on services will become more prevalent
road transport (passenger and (e.g. home delivery goods & • Consolidation will continue in the
freight), low EV adoption rates services, Amazon lockers) medium-to-long-term as fuel
volumes decline and convenience
• However, increasingly diversified • International trends are instructive, becomes the primary driver (not all
fuel offerings will be required over and international players will have a fuel sites will survive the transition to
time (traditional fuels alongside major influence on the Australian alternative fuels and/or a
alternative fuels) market convenience-centric model)
Strategic focus for operators and
Strategic focus for operators landlords
21Implications for WPR’s Strategy
Three-pronged strategy to address long-term trends in the F&C sector
Strategy Aim Description/Comments
Support our Assist long-term Optimise current offering (e.g. site
operators viability/success of redevelopments) Capitaloffering
Adapt partner
our operators, Adapt offering over time (e.g. over time
primarily as a capital reconfiguration for addition of Optimise current Facilitate
Enhanced focus
partner alternative fuels to site mix) F&C offering innovation and
on sustainability
Facilitate innovation and sustainability
sustainability (e.g. electricity
easements for EV charging stations)
Actively manage Improve portfolio Selective acquisitions
our portfolio quality and increase Non-core disposals Sustainable Selective
likelihood of lease Focus on long-term risks/returns
Sustainable
gearing Maximise Selective
acquisitions
gearing acquisitions
renewals at expiry (incl. underlying land value) long-term income
Acquisition/disposal criteria to be
refined over time as the sector and capital returns
evolves
Disciplined
Disciplined Sellnon-
Sell non-
Prudently manage Capital management Sustainable gearing levels and allocation
allocation coreassets
core assets
capital strategy consistent diversified sources and tenor of debt of
of capital
capital
with portfolio Disciplined allocation of capital
strategy Evaluate capital management
initiatives in context of investment Diversified Focus on
Diversified
sources of Explore long-
terminal
opportunities sources of termvalue/risks
alternate
debt
debt uses
22Summary – Portfolio Strategy
Maximising long-term portfolio returns through supporting our operators and active portfolio management
1 WPR owns a high quality portfolio of 470 sites occupied on long-term leases by world-class operators focused on everyday needs.
2 WPR’s portfolio diversification provides a natural hedge, as the timing/magnitude of long-term changes will differ from site to site.
3 Energy transition timeline is uncertain; likely to be a case of ‘evolution rather than revolution’, particularly for freight transport.
4 The convenience offer is rapidly evolving and is expected to become an increasingly important driver of site visitation over time.
5 WPR has limited ability to directly influence F&C offerings; this responsibility/opportunity sits primarily with the relevant operator(s).
6 WPR’s focus is on (A) supporting our operators as they evolve/adapt and (B) active portfolio management (owning the right sites).
7 WPR remains a buyer of high-quality F&C properties and expects to reinvest in its core portfolio in partnership with our operators.
8 However, we will also seek to recycle capital by selling non-core assets when market conditions are favourable.
23ESG Strategy
In 2020, WPR aligned our key focus areas with the UN Sustainable Development Goals (UNSDGs)
Focus Area Key Matters Impact Stakeholders UNSDGs Actions to date
Ethical conduct Governance, Direct Employees/ - Strong corporate governance and risk management models.
and Transparency Compliance, Communities/ - No significant governance incidents.
Risk Management Business - Adopted new Corporate values which underpin our approach and
partners/ response to sustainability focus areas.
Securityholders - Established ESG Working Group which reports to the Board.
- Adopted Supplier Code of Conduct and Human Rights policy, including
focus on modern slavery provisions.
Our people Diversity and Direct Employees/ - 33% of Board and 67% of Executive KMP are female.
inclusion, Securityholders - 44% of staff on flexible work arrangements (pre COVID-19).
Flexible working, - Successful working from home protocols during pandemic.
Health and - Implemented Charitable Giving & Employee Assistance programs.
wellness, - New LTI scheme encouraging performance, alignment of interests and
Remuneration staff retention.
Climate change Climate risks and Direct Tenants/ - Climate impact assessment performed across property portfolio.
and opportunities Employees/ - Updated Investment Policy and acquisition checklist to specifically
Energy Energy efficiency Direct/Indirect Securityholders consider climate change impacts.
- Sustainable design elements adopted across 15 developments.
- 5+ NABERS office leases entered in Sydney and Melbourne.
Safety Personal and Direct/Indirect Tenants/ - Zero work related injuries in 2020.
and process safety Contractors/ - Under majority of lease terms, maintenance of fuel tanks and associated
Environment Spill prevention Indirect Communities/ environmental responsibility resides with tenants.
Government - 96.8% of portfolio leased to Viva Energy with strong corporate
governance model around safety and the environment.
- Reporting and appropriate oversight arrangements regarding Health,
Safety and Environment in place with key tenants and contractors.
24FY21 Priorities
and Outlook
25FY21 Priorities and Outlook
Focus on improving portfolio quality via selective acquisitions, non-core disposals and reinvesting in core
Focused on 2 non-fuel tenant vacancies and FY21 lease expiries (represent 0.9% of income)
Core Portfolio
Pursuing strategic capital reinvestment opportunities with operators across the portfolio
Selective approach to further acquisitions and development fund-throughs
Acquisitions
Direct market expected to remain highly competitive in FY21, particularly for high quality assets
$20-30m of non-core disposals identified for FY21 (predominantly FY26 expiries)
Non-Core Disposals
Non-core disposals fundamental to ongoing portfolio management strategy
Continue to investigate initiatives to diversify funding sources and extend tenor of debt and swap books
Capital Management Explore potential capital management initiatives in context of acquisition and portfolio reinvestment opportunities,
non-core asset disposals and target gearing levels
Target FY21 Distributable EPS of 15.72cps
FY21 Guidance1
Implies 3.75% growth on FY20
1 Based on weighted average number of stapled securities on issue during the reporting period and provided there are no material changes in market conditions and no other factors adversely affecting
financial performance.
26Appendices
27Appendices:
Financial
28Reconciliation to Statutory Profit
Statutory profit increased 41.6% largely due to valuation gains recorded during the year
$m FY20 FY19 Change Change
$m $m $m %
Distributable earnings 118.5 111.7 6.8 6.1 19 bps of cap rate compression across the portfolio in FY20 vs flat in FY19 and
lower acquisition cost write off as a result of lower transaction volume
Gain on valuation of investment properties 152.3 72.8 79.5 109.2
Straight-line rental income 21.4 23.4 (2.0) (8.5) FY20 includes $1.4m write off of borrowing costs in connection with re-financing
Amortisation of borrowing costs (2.7) (1.1) (1.6) 145.5
FY20 represents cost to terminate $20m swap (as associated $20m loan was
Interest rate swap termination / restructure (3.5) (9.2) 5.7 (62.0) required to be repaid as a result of the Review Event triggered by VEA sell
expense down)
Loss on derivatives (0.3) - (0.3) 100 Mark-to-market movement on derivates not hedge accounted ($1.4m loss) offset
by hedge ineffectiveness on cross currency swaps ($1.1m gain)
Internalisation costs (5.8) - (5.8) 100
Non-recurring costs incurred in connection with internalisation, including $2.5m
Statutory profit 279.9 197.6 82.3 41.6
facilitation payment to VEA, $1.4m expense in relation to run-off insurance
policy, system implementation costs and associated legal and consultant fees.
29Composition of M&A Expenses
M&A expenses increased 12% largely to due to higher insurance and statutory costs
Higher volume of
Net change, Largely driven by Higher IT and independent
inclusive of costs higher insurance accommodation valuations due to
associated with premiums post charges post COVID-19 &
executive changes. renewal in August internalisation strategic portfolio
review undertaken
Write off of costs
Reduced offshore incurred in connection Largely due to
and domestic travel with deals that did not timing of tenant
due to COVID-19 progress in recoveries
FY19/FY20
30Debt/Liquidity
Weighted average debt maturity of 4.3 years and weighted average hedge maturity of 2.4 years
Debt maturity profile as at 31 December 2020 Swap maturity profile as at 31 December 2020
400 100% 3.00%
2.72%
90%
350 368
89% 2.50%
80%
300 50
70% 1.88%
1.78% 2.00%
250 128 1.74%
60%
1.50% 1.50%
57%
$m
200 50% 1.50%
48%
40%
150
147 1.00%
140 30%
100
109 27% 27%
20%
0.50%
50 68 10%
40
5%
0 0% 0.00%
FY21 FY22 FY23 FY24 FY25 FY26 FY27 FY30+ Dec-20 Dec-21 Dec-22 Dec-23 Dec-24 Dec-25
Syndicate RCF RCF (undrawn) Bilateral (undrawn) ITL USPP % hedged (LHS) Average hedge rate (RHS)
31Appendices:
Property Portfolio
32Investment Strategy / Criteria
A range of quantitative and qualitative factors underpin WPR’s value assessment of a site
Lease Permitted Use
Covenant, term + options, passing rent, Current zoning, possible future rezoning
rental growth, Triple Net / Double Net
onerous / atypical clauses
Location Adaptability
Lorem Ipsum
Passing traffic count, draw rate,
WPR VALUE Complementary
Lorem ipsum uses (e.g. QSR),
dolor sit amet, nibh future
competition, demographics, population ASSESSMENT est. A magna maecenas, quam
fuels, convenience-centric
magna nec quis, lorem nunc. offer
density, proximity to focal / convergence Suspendisse viverra.
points
Site Factors External Inputs
Visibility from road, size of land and Comparable rental data, comparable sales
improvements, typography, accessibility, data, underlying land value
refuelling capabilities, sustainability/climate
impact, additional infrastructure
Subjective Inputs
Current use (service station) Retention/re-letting probability,
acquisition cap rate, terminal cap rate /
Future / alternate use value
33Lease Expiry Profile
Portfolio WALE of 10.8 years with a staggered expiry profile
• Only five fuel leases expiring in the next five years (1.2% of income)
• Two non-fuel tenancies are currently vacant, with a further 12 non-fuel leases expiring in the next five years (0.7% of income)
• Staggered lease renewal profile mitigates against renewal concentration risk and the impact of potential sector structural changes
Portfolio lease expiry profile (as at 31 December 2020)
Leases expiring1 2 5 0 4 2 6 39 44 44 37 35 55 67 70 70 2 3 0 0 1
WALE
10.8
years
22.8%
17.0%
14.2%
10.3%
7.4% 7.4% 6.7%
6.4% 0.6% 0.9% 0.2%
0.8% 0.4% 0.6% 4.1%
0.1% 0.1%
Vacant FY21 FY22 FY23 FY24 FY25 FY26 FY27 FY28 FY29 FY30 FY31 FY32 FY33 FY34 FY35 FY36 FY37 FY38 FY39
Year of lease expiry
1 Four lease expiries shown in FY36-39 represent committed new leases or extensions at development sites, with lease terms contracted to commence upon Practical Completion of the respective development.
34FY20 Acquisitions (Detailed)
5 assets acquired for $32.5m @ WACR of 6.25%
439 Great Eastern Highway, 416 Princes Highway, 25 Wills Road, 825 Mickleham Road, Lot 50 Mandurah Road,
Site Address
Redcliffe, WA Colac West, VIC Emerald, QLD Greenvale, VIC Meadow Springs, WA
Region Metro Regional Regional Metro Metro
Acquisition / Acquisition Acquisition Acquisition Fund-through Acquisition
Fund-through
Purchase price / Land purchase: $5.2m
Development $10.41m $6.80m $2.83m Funding: $3.8m $7.28m
funding Total investment: $9.0m
Month settled Jan-20 Jan-20 Feb-20 Apr-20 May-20
Cap Rate 6.1% 6.8% 7.5% 5.5% 6.0%
Site area 3,727m2 6,430m2 4,425m2 5,036m2 4,015m2
Branding Shell Liberty Shell Liberty Caltex
Tenant(s) Viva Energy Australia (72% of rent) Liberty Oil Property Liberty Oil Property LOC Concepts (Developer) Caltex Australia
Hungry Jacks (28% of rent) (Viva Energy Australia owned from Dec’19) (Viva Energy Australia owned from Dec’19) (Viva Energy Australia nominated as tenant
for completed development)
Lease Double Net (Both) Triple Net Double Net Triple Net Double Net
WARR Fixed 3.0% Fixed 3.0% CPI Fixed 3.0% CPI or minimum of 3.0%
Lease term / Viva commenced Jul-19 – 15years Commenced Dec-19 – 15 years Commenced Nov-15 – 15 years Commenced Apr-20 (development lease) Commenced Sep-17 – 15 years
options Hungry Jacks commenced Jul-19 – 10 Options – Yes Options – Yes 15 year lease will commence at completion Options – Yes
years Remaining term – 13.9 years Remaining term – 9.8 years of development Remaining term – 11.7 years
Options – Yes Options – Yes
WALE – 13.7 years Remaining term - 15 years (from PC)
Strategic • Strategically located on the Great • The site enjoys good visibility from both • Commercial fuelling facility located to • Located in a growing area of metropolitan • Strategically located with prominent
rationale Eastern Highway capturing inbound directions of traffic on the Princes Highway; capture commercial road transport from Melbourne on Mickleham Rd, which is a exposure to 15,000+ vehicles per day
traffic travelling to the Perth CBD from and has left-in, left out accessibility. the surrounding Central Highlands Region. divided arterial road carrying more than travelling southbound using
the eastern suburbs of Perth. • Improvements were constructed in 2017, and • The site comprises a standalone high 20,000 vehicles per day. Mandurah Road.
• The site comprises a standalone comprise a two lanes/12 filling positions car clearance truck canopy providing 4 filling • The site has an approved DA and is • The site comprises a standalone
convenience store building, a Hungry canopy; three island dedicated truck canopy, positions. proposed to include a large format convenience store building, with a
Jacks fast food restaurant with drive- and large convenience store including convenience store building, with a separate Tollgate 3 pump commuter
thru and has a Tollgate 4 pump customer seating area Tandem/Tollgate canopy offering canopy providing 6 filling positions,
canopy providing 8 filling positions. integrated Commuter and Commercial and a further separated diesel
vehicle fuelling. fuelling canopy.
35FY23-26 Market Rents
Rents on leases expiring in FY23-26 are (on average) ~17% below market
• In September 2020, WPR commissioned independent desktop market rental advice
on 43 sites leased to VEA with leases expiring between FY23 and FY261
% of
combined 17%
• Three of the 43 sites have now been sold / held for sale (refer page 17) 33% 36%
rent 14%
• Based on the midpoint of the assessed range, 31 of 40 properties were assessed as 67% (FY23-26
being under-rented and the 40 properties were, on average, 17.1% under-rented lease 33%
expiries)
• Please note:
NSW (16) WA (11)
– Although the analysis carried out by the valuer was consistent with the market Regional (27) Metro (13)
QLD (8) Other (5)
rent provisions of the relevant leases, it is indicative only and does not constitute
a formal market rent determination
Breakdown (based on midpoint of range):
– Upon expiry of an IPO Lease:
Under-rented 31
> VEA may exercise the 10-year option, either at a rent negotiated between the
parties or as determined by an independent expert
At-market -
> WPR and VEA may agree to a new lease outside of the option mechanism on
mutually acceptable terms Over-rented 9
> If WPR and VEA cannot agree terms for a new lease or exercise of the option, Total 40
VEA may choose to vacate the site and WPR is free to deal with other potential
tenants (or investigate other uses) 2
Median (passing vs. market) (6.0%)
– Accordingly, the ability to achieve the ‘market rent’ depends upon (a) VEA’s
willingness/ability to pay the market rent and (b) alternative options that WPR may Average (passing vs. market) (17.1%)
have for the site (alternative operator or use) 3
1. Rents assessed as at 30 September 2020. Market rental assessment carried out on 42 IPO Properties, plus Fawkner Victoria FY23 expiry.
2. On the expiry of options to renew, VEA have a first right of refusal in respect of the leasehold for a period of 12 months after the expiry. VEA also have a right to take a lease of the property for up to 3 years after the expiry of
the lease to remediate any contamination (if required). 36
3. VEA are obliged to exercise an option where there is site licence or lease with Coles Express in place that continues passed the lease expiry.Underlying Land Value / Alternate Use
Underlying land value comprises ~50% of current portfolio book value
• WPR has completed a high-level and indicative assessment of alternative
use potential and residual land value (RLV) analysis for its ~300
metropolitan assets
Zoning by Book Value (Metro Sites)
• Current usage (service station) remains the highest and best use for ~90%
of the metro portfolio Mixed Use
Industrial 5%
• The near-term development potential of any asset in the portfolio is 11%
Apartments /
constrained by the long-term leases in place (commercial agreement Townhouses
required between tenant and landlord) 38%
• However, future alternate use potential is reflected in underlying zoning,
with 38% of the metro portfolio zoned medium or high density residential Commercial
19%
• WPR estimates that the underlying land value of its portfolio equates to Residential
43%
48% of the carrying value as at December 20201
Est. Land Value as % of Book Value
70%
60%
60% Detached Housing
48% 5%
50% Retail
22%
40%
30%
18%
20%
10%
0%
Metro Regional Portfolio
1 Assuming the higher of (a) indicative RLV and (b) land value estimate provided in the latest independent valuation for each property. Regional land values are based on latest independent valuation for each property.
37Sustainable elements in development design
Sustainable design elements adopted across WPR’s 15 development sites in 2020
• Established inaugural set of site sustainability criteria, re-affirming
elements already assessed in our investment evaluation criteria
• Key criteria include:
– Environmental Protection
– Energy and Water Efficiency
– Waste Management
– Alternative Fuels/Energy
• Key highlights across 15 development fund-through projects:
– All sites with non-corrodible underground fuel systems,
automated tank gauging and spill containment systems
– All sites with energy efficient LED Lighting and
monitorable power metering
– All sites have separated recycling refuse arrangements
– Six sites incorporate Solar Panels
– 10 sites incorporate drought tolerant landscaping
– 87% sites include bio-fuels within product range
38Appendices:
Tenants and
Operators
39Viva Energy Australia – Overview1
Strategic national retail network and infrastructure
Darwin
Cocos Islands
24% of the Australian downstream petroleum market2
1,330+ service station sites nationwide in Viva Energy’s network
46 fuel import terminals and depots3 nationally to support operations
19
55 airports and airfields across Australia supplied by Viva Energy
120 223
capacity of oil refinery in Geelong, Australia
kbbls/d
Brisbane
110+ years proudly operating in Australia 184
105
sole right to use the Shell brand in Australia for sale of retail fuels
until 20294.
410
Perth
Retail Alliance with Coles Adelaide
Sydney
strategic relationship with Vitol Geelong refinery
375
Capacity – 120,000 barrels per day
Aviation fuel infrastructure supplying
55 airports and airfields Melbourne
# Retail network with 1,330+ sites Geelong Refinery
16 Viva Energy operated terminals and inland depots
30
3 joint non-operated terminals
3 industry main fuel terminals (not operated by Viva Energy)
7 customer terminals and inland depots operated by Viva Energy Hobart
5 bitumen facilities
17 Liberty inland depots
1 Source:VEA’s FY20 results presentation, as lodged with the ASX on 24 February 2021.
2 Market share data is based on total Australian market fuel volumes of 52.2 billion litres for period 1 January 2020 to 31 December 2020, as per Australia Petroleum Statistics, and in respect of Viva Energy, is based on total fuel volumes of 12.3 billion litres.
3 Includes 24 fuel import terminals and 22 active depots (including 17 Liberty Oil depots), Viva Energy owns the Liberty Wholesale business and holds a 50% interest in the Liberty Retail business and supplies it with fuel.
4 Viva Energy has been granted that right by an affiliate of Royal Dutch Shell and Viva Energy has in turn granted a sub-licence to Coles Express and to certain other operators of Retail Sites.
40Viva Energy Australia – FY20 Results1
Significant impact from COVID-19, but Retail EBITDA increased 18.9%
• 16.0% decline in fuel volumes due to COVID-19 $m FY20 FY19 Change
• 16.5% improvement in Non-Refining EBITDA driven by strong diesel sales Sales volumes (ML) 12,339 14,695 (16.0%)
through both retail and commercial channels, improved retail fuel margins, and
a robust commercial specialty business performance Underlying EBITDA:
• Maintained transport fuel market share (24%) and improved premium petrol
penetration (30% vs. 28% in FY19) Retail 670.8 564.3 18.9%
• Total Retail volumes down 12% on FY19, but improved to 59ML/week in the Commercial 238.3 296.5 (19.6%)
Q4 (+13% on Q3) and 62ML/week in November (vs. VEA’s 70-75ML target)
Supply, Corporate and Overheads (294.6) (333.3) 11.6%
• EBITDA impact of reduced volumes (-$42m) more than offset by higher retail
margins (+$124m) = +$82m
Non-Refining EBITDA 614.5 527.5 16.5%
• Finished FY20 with an improved net debt position of $104m and robust debt
capacity (current facility limits of US$700m) Refining (95.1) 117.0 n/a
• Key Retail priorities:
Group EBITDA 519.4 644.5 (19.4%)
– Stronger Alliance network performance
Group NPAT (35.9) 135.8 n/a
– Development of Liberty Convenience retail channel
– Improving brand perception, loyalty and customer engagement
– Optimise sales and margin mix Net Cash / (Debt) (104) (137) 24.1%
– Optimise network size/locations to improve core network efficiencies
– Leverage opportunities resulting from competitor brand changes
– Maintain improvement in premium fuel penetration
1 Source:VEA’s FY20 results presentation, as lodged with the ASX on 24 February 2021.
41Coles Express – HY21 Results1
Strong c-store sales and favourable mix supported an increase in CEXP EBIT
• CEXP delivered 10.5% sales growth in HY21 $m 1H21 1H20 Change
Key P&L items:
– Driven by drinks category, supported by recent investments in fridges
and targeted range reviews in healthier drink alternatives
C-store sales revenue ($m) 632 572 10.5%
– Improved momentum in Victoria following the easement of travel
restrictions also supported sales growth EBITDA ($m) 103 95 8.4%
• Average weekly fuel volumes were 14% lower than 1H20, with volumes EBIT ($m) 32 28 14.3%
improving in the second quarter
Key metrics:
• CODB2 improved by 541bp as a result of strong focus on cost control
• Gross margin decreased by 532bp, largely due to declining fuel volumes No. of stores 723 713 +10
and lower fuel margin income
Comp c-store sales growth 9.9% 2.9% 695bp
• CEXP completed the roll-out of new self-serve coffee machines to 99% of
the network Weekly fuel volumes 55.5ML 64.4ML (13.8%)
Fuel volume growth (13.8%) 3.3% N/M
Comp fuel volume growth (14.9%) 4.2% N/M
Gross margin 50.9% 56.2% (532bp)
CODB2 (45.8%) (51.2%) 541bp
EBIT margin 5.0% 4.9% 9bp
1 Source: Coles Group HY21 Results Presentation.
2 Cost of Doing Business.
42Appendices:
Industry
Information
43Australian F&C Network Update
Site closures by the three domestic Majors being offset by continued expansion of smaller operators
• 197 new sites opened in 2020, with 193 closures for a net increase of 4 sites or 0.1% of total sites as at the start of the year
• The three majors (BP, Viva Energy and Ampol) recorded net closures of 67 sites combined, or 1.1% of total sites at the start of the year
• Net increase of 4 sites in 2020 compares with a net increase of 110 sites in 2019
Dec-19 Openings Closures Net Dec-20 % of Total Sites
BP 1,453 40 59 (19) 1,434 23.5%
Viva Energy / Coles Express / Shell 1,067 29 37 (8) 1,059 17.3%
Ampol / Caltex 1,070 9 49 (40) 1,030 16.8%
7-Eleven 571 0 9 (9) 562 9.2%
Euro Garages 541 4 6 (2) 539 8.8%
United Petroleum 410 12 2 10 420 6.9%
Puma Energy / Chevron 285 5 - 5 290 4.7%
Liberty Oil 199 48 12 36 235 3.8%
Metro Petroleum 231 3 - 3 234 3.8%
On The Run 147 15 - 15 162 2.6%
Mobil 136 32 19 13 149 2.4%
Total 6,110 197 193 4 6114 100.0%
1 Source: GapMaps Retail Network Report December 2020. Report covers only the major fuel brands across Australia.
44Australian Motor Vehicle Statistics - 20201
Freight vehicles account for 43% of fuel consumed in Australia and 77% of diesel consumption
• There are ~19.8 million vehicles on Australian roads, travelling ~238 million kilometres per annum Proportion of total vehicles
and consuming ~33 billion litres of fuel
• Passenger vehicles account for ~74% of vehicles on Australian roads, and ~68% of total kilometres 6%
travelled, but only 55% of fuel consumed
20%
• Freight vehicles account for ~43% of total fuel consumption, despite comprising only ~20% of total
vehicle numbers and ~30% of kilometres travelled Passenger vehicles
Freight vehicles
– Fuel efficiency for freight vehicles is almost half that of passenger vehicles (19.8 litres per 100km Other
vs. 11.1 litres for passenger vehicles)
74%
Fuel consumption by vehicle and fuel type
35,000 Proportion of fuel consumed
30,000
2%
25,000 16,211
20,000
ML
15,000 3,128
Passenger vehicles
43%
10,000 Freight vehicles
12,479 16,171 55%
14,455 Other
5,000
0 1,592
Passenger vehicles Freight vehicles Total
Petrol Diesel
1 Source: ABS, Survey of Motor Vehicle Use, Australia, 12 months ended 30 June 2020. Freight vehicles include light commercial vehicles, rigid trucks and articulated trucks. Other includes motorcycles, buses and non-freight carrying trucks.
45Australian EV Forecasts – CSIRO (June 2020)
Central Scenario forecasts from CSIRO suggest ~25% market share by 2040
• The CSIRO published a report in June 2020 providing projections of the future capacity Cost
of small-scale embedded technologies (rooftop solar, batteries and EVs) as EV Share of Sales: Parity 2035 2040 2045 2050
commissioned by the Australian Energy Market Operator for input into their forecasting
and planning processes Slow 2035 25% 30% 30% 30%
• EVs are defined as including battery electric vehicles, plug-in hybrid electric vehicles and Central 2030 40% 45% 45% 45%
hydrogen fuel cell vehicles
• In relation to EVs, four key scenarios were outlined, with specific assumptions made in Fast 2025 60% 60% 55% 55%
relation to a range of factors across including: timing of cost parity with ICEs; cost of fuel
cell vehicles; extent of access to variety of charging options; feasibility of ride sharing Step Change 2025 80% 100% 100% 100%
services; and availability of affordable public charging
• The report makes the important point that Australians tend to keep vehicles on the road
for 20-30 years, and this slow turnover of vehicle stock means it can take more than 20
Cost
years for sales to translate to fleet share
EV Share of Fleet: Parity 2035 2040 2045 2050
• Reflecting their higher cost, lack of vehicle models and infant fuel supply chain, fuel cell
Slow 2035 5% 15% 20% 25%
vehicles are projected to capture less than 10% of sales across all scenarios (fleet share
of 1-6% across the scenarios), but make up 50% of articulated trucks (long-haul freight)
in the Step Change scenario Central 2030 10% 25% 30% 35%
Fast 2025 25% 37% 45% 45%
Step Change 2025 45% 70% 85% 100%
1 Sources: CSIRO, Projections for small-scale embedded technologies – June 2020. Figures are approximate as derived from charts within the report.
46Future Fuels Strategy
Focus on charging infrastructure and commercial fleets
• The Federal Government released its Future Fuels Strategy discussion paper in February 2021
• Key points of interest:
– In the short to medium term, conventional vehicles that use petrol and diesel will continue to
be the most popular and widely available vehicles in Australia
– Liquid fuels projected to remain the most commonly used fuels in the heavy freight industry
due to their high energy-density and convenience to store/handle
– Currently, closing the total cost of ownership gap between EVs and conventional vehicles
through subsidies would not represent value-for-money (cost to taxpayer of $195-747 per
tonne of CO2 equivalent vs. $16 per tonne for the Emissions Reduction Fund)
– Five priority initiatives, including:
> Co-investment (via the $71.9m Future Fuels Fund) in the deployment of public battery EV
charging and hydrogen fuel cell EV refuelling infrastructure (lack of access being a barrier
to consumer/business confidence)
> Addressing barriers to commercial fleet uptake of future fuels, noting that 40% of light
vehicles sales in Australia in 2020 were to businesses
> Understanding the opportunities and risks of large scale uptake of battery EVs to Australia’s
electricity demand/supply and grid security
1 Source: Department of Industry, Science, Energy and Resources – Future Fuels Strategy: Discussion Paper, February 2021.
47Domestic Petrol and Diesel Consumption
Strong growth in diesel and premium fuels, declining regular and ethanol-based fuels
2011-19 CAGR:
4,500.0
+1.6%
4,000.0
3,500.0
3,000.0
+3.4%
2,500.0
ML
2,000.0
1,500.0
1,000.0
(1.7%)
500.0 +2.2%
(3.1%)
0.0
Apr-11
Oct-11
Apr-12
Oct-12
Apr-13
Oct-13
Apr-14
Oct-14
Apr-15
Oct-15
Apr-16
Oct-16
Apr-17
Oct-17
Apr-18
Oct-18
Apr-19
Oct-19
Apr-20
Oct-20
Jan-11
Jul-11
Jan-12
Jul-12
Jan-13
Jul-13
Jan-14
Jul-14
Jan-15
Jul-15
Jan-16
Jul-16
Jan-17
Jul-17
Jan-18
Jul-18
Jan-19
Jul-19
Jan-20
Jul-20
Regular Petrol Premium Petrol Ethanol-based Diesel Combined
1 Source: Department of Industry, Science, Energy and Resources, Australian Petroleum Statistics Issue 292, November 2020. Diesel volumes include automotive diesel oil, biodiesel blends, and industrial & marine diesel fuels.
48You can also read