FY2020 Trends in Fisheries

 FY2021 Fisheries Policy

        Summary
←
→
Page content transcription
If your browser does not render page correctly, please read the page content below
FY2020 Trends in Fisheries
FY2021 Fisheries Policy
Summary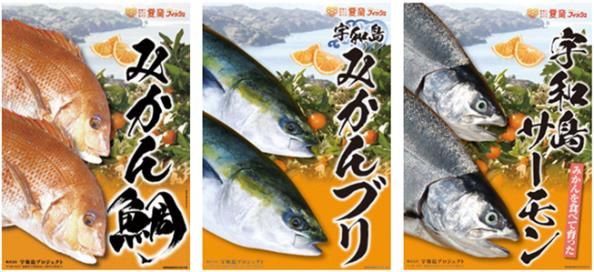
This document is a report on fisheries trends and the policy implemented during FY2020 in
 accordance with the provisions of Article 10, paragraph (1) of the Fisheries Basic Act (Act
 No. 89 of 2001) as well as the fisheries policy to be implemented in FY2021 in accordance
 with the provisions of paragraph (2) of said Article.

In order to indicate the relationship between fisheries and SDGs, the icon of the goal that has
an especially deep connection with fisheries is attached. (Not all related goals.)
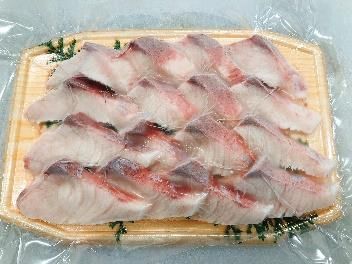
Table of Contents

FY2020 Trends in Fisheries
Special Issue: Transform Fisheries into a Growth Industry with the Market-in Approach

 Section 1 Situation of Fishery Markets in Japan and Abroad ・・・・・・・・・・・・・・・・・・・・・・・・・・・・ 1
  (1) Situation of Demand for Fish and Fishery Products in the World ・・・・・・・・・・・・・・・・・・・・ 1
  (2) Conditions of Supply and Demand of Fishery Products in Japan ・・・・・・・・・・・・・・・・・・・・ 2
  (3) Rise in the Awareness of Food Safety and Sustainable Fisheries and Aquaculture
      in Japan and Abroad                                                            ・・・・・ 3
  (4) Problems Involved in Making Market-In Efforts ・・・・・・・・・・・・・・・・・・・・・・・・・・・・・・・・・・・ 4
 Section 2 Market-in Efforts in Fisheries ・・・・・・・・・・・・・・・・・・・・・・・・・・・・・・・・・・・・・・・・・・・・・・ 4
  (1) Efforts to Grasp Needs ・・・・・・・・・・・・・・・・・・・・・・・・・・・・・・・・・・・・・・・・・・・・・・・・・・・・・・・ 4
  (2) Providing Fishery Products According to Needs ・・・・・・・・・・・・・・・・・・・・・・・・・・・・・・・・・・ 5
  (3) Efforts to Identify Latent Needs   ・・・・・・・・・・・・・・・・・・・・・・・・・・・・・・・・・・・・・・・・・・・・・・ 6
  (4) Efforts for Food Safety and Sustainable Fisheries and Aquaculture      ・・・・・・・・・・・・・・・ 7
 Section 3 Promotion of Market-in Efforts to Transform Fisheries into a Growth Industry ・・・・ 8
  (1) Need for Further Promotion of Market-in Efforts ・・・・・・・・・・・・・・・・・・・・・・・・・・・・・・・・・ 8
  (2) Direction of Market-in Efforts ・・・・・・・・・・・・・・・・・・・・・・・・・・・・・・・・・・・・・・・・・・・・・・・・・・ 8
  (3) Efforts of Government to Promote Market-in Efforts ・・・・・・・・・・・・・・・・・・・・・・・・・・・・・・・ 8

Trends in Japan's Fisheries Since FY2019

Chapter 1 Trends in the Supply-Demand and Consumption of Fish and Fishery Products
in Japan

(1) Supply-Demand Situation in Fish and Fishery Products ・・・・・・・・・・・・・・・・・・・・・・・・・・・・・ 9
(2) Status of the Consumption of Fish and Fishery Products ・・・・・・・・・・・・・・・・・・・・・・・・・・・・・ 9
(3) Approaches to Ensuring Information Provision to Consumers and to Protecting
   Intellectual Property                                                        ・・・・・・・・・ 10
(4) Trends in the Trade of Fish and Fishery Products ・・・・・・・・・・・・・・・・・・・・・・・・・・・・・・・・・・ 11

Chapter 2 Trends in Japan's Fisheries
 (1) Trends in Fisheries and Aquaculture ・・・・・・・・・・・・・・・・・・・・・・・・・・・・・・・・・・・・・・・・・・・・・12
 (2) Trends in Fishery Management ・・・・・・・・・・・・・・・・・・・・・・・・・・・・・・・・・・・・・・・・・・・・・・・・・12
 (3) Trends in Fishers             ・・・・・・・・・・・・・・・・・・・・・・・・・・・・・・・・・・・・・・・・・・・・・・・・・・ 14
 (4) Trends in Fisheries Working Environment ・・・・・・・・・・・・・・・・・・・・・・・・・・・・・・・・・・・・・・・・ 14
 (5) Development and Utilization of Technologies for Promoting Smart Fisheries ・・・・・・・・・・ 15
 (6) Trends in Fisheries Cooperatives ・・・・・・・・・・・・・・・・・・・・・・・・・・・・・・・・・・・・・・・・・・・・・・・ 15
 (7) Trends in the Distribution and Processing of Fish and Fishery Products ・・・・・・・・・・・・・・ 16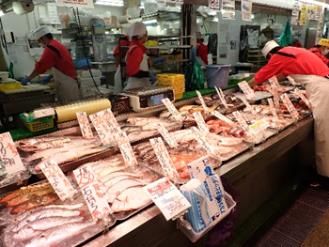
Chapter 3 Trends in Fisheries Resources and the Fishing Ground Environment
 (1) Fisheries Resources in the Waters around Japan ・・・・・・・・・・・・・・・・・・・・・・・・・・・・・・・・ 17
 (2) Japan's Fisheries Resource Management ・・・・・・・・・・・・・・・・・・・・・・・・・・・・・・・・・・・・・・・ 17
 (3) Approaches to Practical, Effective Resource Management ・・・・・・・・・・・・・・・・・・・・・・・・ 20
 (4) Measures to Actively Enhance Fisheries Resources ・・・・・・・・・・・・・・・・・・・・・・・・・・・・・・ 21
 (5) Trends in Fishing Ground Environment ・・・・・・・・・・・・・・・・・・・・・・・・・・・・・・・・・・・・・・・・・ 22
 (6) Damage to Fisheries Caused by Wildlife and Mitigation Measures ・・・・・・・・・・・・・・・・・・ 23

Chapter 4 International Situation Surrounding the Fisheries Industry
(1) Production of World Fisheries and Aquaculture ・・・・・・・・・・・・・・・・・・・・・・・・・・・・・・・・・・・・ 24
(2) International Situation Surrounding the Trade of Fish and Fishery Products             ・・・・・・・・・・・ 25
(3) International Resource Management ・・・・・・・・・・・・・・・・・・・・・・・・・・・・・・・・・・・・・・・・・・・・・ 25
(4) Developments Concerning Whaling ・・・・・・・・・・・・・・・・・・・・・・・・・・・・・・・・・・・・・・・・・・・・・・ 27
(5) Overseas Fishery Cooperation ・・・・・・・・・・・・・・・・・・・・・・・・・・・・・・・・・・・・・・・・・・・・・・・・・・ 27

Chapter 5 Development of Safe and Dynamic Fishing Communities

(1) Current Status and Role of Fishing Communities ・・・・・・・・・・・・・・・・・・・・・・・・・・・・・・・・・・ 28
(2) Development of Safe Fishing Communities Where People Can Live in Peace ・・・・・・・・・ 28
(3) Activation of Fishing Communities ・・・・・・・・・・・・・・・・・・・・・・・・・・・・・・・・・・・・・・・・・・・・・・・ 29

Chapter 6 Current State of Reconstruction That Have Passed 10 Years After the Great
East Japan Earthquake
(1) Conditions of the Restoration/Reconstruction from the Earthquake Damage in the
   Fisheries Industry                                                              ・・・・・・ 30
(2) Response to the Impact of the Accident at TEPCO’s Fukushima Daiichi Nuclear
   Power Plant                                                                    ・・・・・・・ 32

Structure of "FY2021 Fisheries Policy"

  Note: The maps in this document do not necessarily inclusively show Japan's territory.          4
Special Issue: Transform Fisheries into a Growth
Industry with the Market-in
Approach
 ○For Japanese fisheries to develop in the future while coping with depopulation and lifestyle
  changes, it is necessary to promote appropriate resource management toward recovery of
  living aquatic resources, while at the same time working to improve value and expand the
  market of fish and fishery products also under the impact of the spread of COVID-19. A
  factor of special importance for promotion of this movement is the approach called “market-
  in.”
                                                  Market-in and Product-out
                         Market-in                                                              Product-out
 ・Approach to identify demands and                                      ・Approach to produce and provide
 problems of consumers/customers and                                    better products/services from the
 provide products and services that meet                                viewpoint of the provider
 the needs
 Example:                                                               Example:
 Fishermen improve the quality of fisheries                             Fishermen and fishery processors provide
 products based on the demands of consumers                             products with a focus on quality based on their
 and customers.                                                         idea of quality fish for consumers.

Section 1 Situation of Fishery Markets in Japan and Abroad
(1) Situation of Demand for Fish and Fishery Products in the World
 〇The world’s per capita seafood consumption doubled in five decades, whereas Japan’s per
  capita seafood consumption fell to the level of about 50 years ago.
 ○Global aquaculture production and fishery product trade have expanded with the increase
  in demand for fishery products.
 ○Mobility limitation, etc. to address the spread of the COVID-19 is harsh conditions for
  Japan’s export of fishery products, which had been supported by eating out demand
  abroad.

        Trends in the World’s Annual Per Capita Seafood Consumption (gross food based)

                 Oceania                       Europe                                 South Korea                  Norway
                 North America                 Asia                                   Japan                        China
                 World                         Africa                                 Indonesia                    EU (28 countries)
                 South America                                                        United States                Brazil
     kg per capita per year                                                           India
30                                                                            kg per capita per year
                                                                         80
25

20                                                                       60
15
                                                                         40
10

5
                                                                         20
0
 1961       1971      1981       1991   2001    2011 2018                       0
                                                                                 1961   1971 1981     1991       2001      2011 2018
        Sources: “FAOSTAT (Food Balance Sheets)” (FAO) and “Food Balance Sheet” (The Ministry of Agriculture, Forestry and Fisheries)
        Note: “Gross food” refers to the quantity of seafood including disposal volume.
                                                                                                                                        1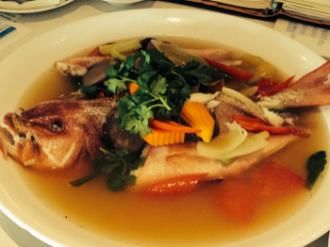
Special Issue: Transform Fisheries into a Growth Industry with Market-in
Trends in the Production of World Fisheries and Aquaculture
(10,000 tons)
24,000
21,000
18,000
Inland Water Source: Prepared by the Fisheries
15,000
Aquaculture Agency, based on the Fishstat
12,000 (Capture Production, Aquaculture
Marine Aquaculture
Production) (FAO) (without Japan),
9,000 Inland Capture Fisheries Fisheries and Aquaculture Production
6,000 Statistics (the Ministry of Agriculture,
Marine Capture Forestry and Fisheries) (Japan)
3,000 Fisheries
0
1960 1970 1980 1990 2000 2010 2019
Trends in the Trade Volumes of Fish and Fishery Products
(10,000 tons) (10,000 tons)
5,000 EU (28 countries) China EU (28 countries) China
Norway Russia 4,500
United States Japan
Vietnam Peru Thailand South Korea
4,000
United States India Norway Russia
4,000 Source: Fishstat
Thailand Japan 3,500 Cote d'Ivoire Others
Others (Commodities Production
3,000 and Trade) (FAO)
3,000
Note: The volume of EU
2,500
imports and exports
2,000 2,000 includes the volume of
1,500
trade within the EU.
1,000 1,000
500
0 0
1976 1980 1985 1990 1995 2000 2005 2010 2018 1976 1980 1985 1990 1995 2000 2005 2010 2018
(2) Conditions of Supply and Demand of Fishery Products in Japan
○Per capita seafood consumption in Japan has been on the decrease from the peak of
40.2kg in FY2001 to 23.8kg (estimate) in FY2019.
○Causes of continued decrease of fishery product consumption include high prices and
cooking difficulty, etc. With increasing health consciousness, about 60% of consumers say
they want to eat more fish more frequently in the future, but there are also changes in diet
orientation, including a simplified diet due to the increase of dual-career families.
Change of Supply for Domestic Human Trends of Consumers’ Current Food
Consumption of Fish and Fishery Products Preferences (Top)
and Annual Consumption per Capita
%
50
Supply for human consumption of fish, fishery products, and meat
(10,000 tons) FY2001 FY2011 kg
Human consumption of fish, fishery products and meat (Net food)
Annual per-capita 45
Meat consumption
1,600 FY1989 Peak: 40.2kg human consumption 60
exceeds.
37.4kg of fish and fishery 40
(Consumption (net
products (Net foods,
1,400 foods)) 35
right scale) 40
30
1,200
20 25
Annual per-capita human
1,000 consumption of meat (Net FY2019
Annual per-capita
20
foods, right scale) (Estimate) 0
23.8kg 15
800 Fish and fishery products Health oriented
Total supply for domestic (20) 10 Simplicity oriented
600 consumption (left scale) Economy oriented
5 Safety oriented
(40) Hand-made oriented
400 Total supply for FY2016 0
Meat consumption
May
Dec.
Jan.
Jun.
Dec.
Jan.
Jan.
Jan.
Jan.
Jan.
Jan.
Jan.
Jan.
Jan.
Jan.
Jul.
Jul.
Jul.
Jul.
Jul.
Jul.
Jul.
Jul.
Jul.
Jul.
Jul.
domestic consumption
of meat (left scale) exceeds.
200 (Total supply for (60)
2008 2009 2010 2011 2012 2013 2014 2015 2016 2017 2018 2019 2020 2021
domestic consumption)
0 (80)
1989 1993 1998 2003 2008 2013 2019 FY
(Estimate) Source: Prepared by the Fisheries Agency, based on the Food
Orientation Survey (Japan Finance Corporation)
Source: Food Balance Sheet (the Ministry of Agriculture,
Forestry and Fisheries)
Note: The dashed line is an approximate curve or line.
2
Special Issue: Transform Fisheries into a Growth Industry with Market-in

                                       Intention regarding quantity and frequency of eating seafood
                              Do you want to eat fish more in the future?                              Do you want to eat fish more often in the future?
                                                       Don’t want to eat it                              Want to                       Don’t want to eat it
                           Want to eat                                                                  eat it less
                                                       (including stopping                                                             (including stopping
                             it less                                                                      often
                                                             eating)                                                                         eating)
                              0.0%                                                                        0.2%
                                                              0.1%                                                                            0.1%

                            Want to keep                                                                 Want to keep
                              eating the         Want to                                                   eating the         Want to eat
                            same amount         eat it more                                              same amount           it more
                               41.0%              58.9%                                                     35.5%                often
                                                                                                                               64.1%

                           Source: Survey on attitudes/intentions toward food, agriculture and fisheries (the Ministry of Agriculture,
                                Forestry and Fisheries) (conducted on 987 consumer monitors from December 2019 to January
                                2020 with a response rate of 90.7%)

               ○Eating out greatly decreased since March 2020 owing to the expansion of the
                COVID-19.
               ○Increase of eating at home (eating in) on the other hand, led to an increase in
                purchases at supermarkets and other retail stores and through websites as well
                as use of delivery services and takeout from restaurants.

                  Year-on-year Comparison of Total Sales                                              Year-on-year Comparison of Total Sales
                 and Number of Users of the Food Service                                                      of Supermarkets (2020)
                               Market (2020)
                     %                                                                                       %
               110                                                                                   120.0
                                                                                                                               Food total
               100
                                                                                                     115.0
Year-on-year

                90                             Sales
                                                                                      Year-on-year

                                                                                                     110.0
                80

                70                                                                                   105.0
                                                       Number of users                                                  Fishery products (seafood,
                                                                                                                        salted and dried products)
                60                                                                                   100.0

                50
                         Jan. Feb. Mar. Apr. May Jun. Jul. Aug. Sep. Oct. Nov. Dec.                   95.0
                                                                                                             Jan. Feb. Mar. Apr. May Jun. Jul. Aug. Sep. Oct. Nov. Dec.

                 Source: Survey of Market Trends in Eating and Drinking                              Source: Current Survey of Supermarket Sales (National
                    Services (Japan Foodservice Association)                                            Supermarket Association of Japan, the Japan Supermarket
                                                                                                        Association and the All Japan Supermarket association)

  (3) Rise in the Awareness of Food Safety and Sustainable Fisheries
  and Aquaculture in Japan and Abroad
               ○The United Nations adopted Sustainable Development Goals (SDGs) in 2015
                and companies introducing SDGs in their goals and strategies are increasing in
                number in Japan and abroad.
               ○In this context, the use of the Marine Eco-Label is globally spreading to inform
                consumers and customers that the labeled products are produced with
                consideration to sustainable use of resources and to the environment.
                                                                                                                                                                          3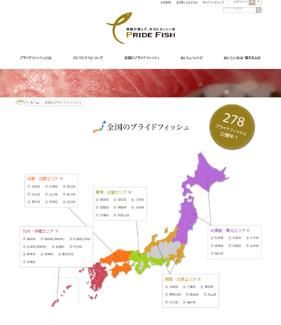
Special Issue: Transform Fisheries into a Growth Industry with Market-in

                                       Marine Eco-Label Certificates mostly used in Japan

                      MSC
                                                                                                                                         MEL
                                  [Number of certificates in Japan]
                    Certificate   10 fisher organizations                                 [Number of certificates in Japan]            Certificate

                                                                            Fisheries
                                  -Scallop (Hokkaido Pref.)                               7 fisher organizations
                                  -Skipjacks (Miyagi and Shizuoka                         -Salmon (Hokkaido Pref.)
                                  Prefs.)                                                 -Chub mackerel, spotted mackerel

                                                                                                                                                           Certificate from
                                  -Albacore (Miyagi and Shizuoka                          (Fukushima Pref.)
foreign countries
Certificates from

                                  Prefs.)                                                 -Shijimi freshwater cram (Aomori Pref.)
                                  -Oyster (Okayama Pref.), etc.                           -Red queen crab (Tottori Pref.), etc.

                                                                                                                                                                Japan
                                  300 enterprises (distributors and
                                  processors)                                             41 aquaculture organizations
                                                                                          -Greater amberjack (Ehime and
                                                                             Kagoshima Prefs., etc.)
                      ASC                                                                 -Japanese yellowtail (Kumamoto,
                                  [Number of certificates in Japan]

                                                                            Aquaculture
                    Certificate   13 aquaculture organizations (68 fish                   Kochi and Kagoshima Prefs., etc.)
                                  farms)                                                  -Red sea bream (Mie, Ehime and
                                  -Oyster (Miyagi Pref.)                                  Kagoshima Prefs., etc.)
                                  -Japanese yellowtail (Miyazaki, Oita,                   -Silver salmon (Miyagi and Tottori Prefs.)
                                  Kagoshima and other Prefs.)                             -Yellowtail amberjack (Ehime and
                                  -Purplish amberjack (Kagoshima                          Kagoshima Prefs.), etc.
                                  Pref.), etc.
                                  151 enterprises (distributors and                       58 enterprises (distributors and processors)
                                  processors)
       *The number of certificates is that as of March 31, 2021 (according to Fisheries Agency).

         (4) Problems Involved in Making Market-In Efforts
      ○Circumstances around the market of fishery products in Japan and the world continue to
       change. Recently, consumers’ lifestyles are changing due to the impact of the spread of the
       COVID-19. In order to improve the value of fishery products and expand their sales under
       the circumstances, it is important to take the market-in approach, which takes advantage of
       regional strengths based on the regional conditions.
      ○Market-in activities face the following problems: 1) insufficient grasping of needs; 2)
       insufficient efforts to provide fishery products according to needs, and; 3) work for
       initiatives to identify latent needs of consumers.
      ○Considering the expected rise in the awareness of food safety and sustainable fisheries
       and aquaculture in Japan and abroad, efforts for food safety, including the implementation
       of HACCP and acquisition of Marine Eco-Label certification, are also required.

   Section 2 Market-in Efforts in Fisheries
   (1) Efforts to Grasp Needs
      ○For market-in activities, it is most important to grasp market needs. In addition to
       information gathering through information media including newspapers, television and the
       Internet, it is also necessary to obtain information through communication with related
       parties through sales promotion to consumers, business activities to customers, and
       business meetings, for example.
              Case
             Example     An example in offshore trawl net fishery (Karo, Tottori Prefecture)
      Tottori Fishery Cooperative in collaboration with Karo Fresh Fish Brokerage Association and Karo Central
      Seafood Market worked for high-freshness distribution of offshore trawl net catch (from FY2008 to FY2013).
      Specifically, responding to the needs of brokers who valued freshness and color, catch was cooled with
      crushed ice, and tags of ships with high-freshness treatment were attached to the fish boxes.
      As a result, the price of fresh queen crab increased from 2,907 yen/kg to 4,256 yen/kg, and the price of
      Japanese sand fish increased from 269 yen/kg to 290 yen/kg. Furthermore, the initiative generated demand
      for higher-priced sashimi-quality Japanese sand fish, fathead flounder and other fish that used to be
      purchased only for boiling/processing.                                                                                              Name tag of ships with
                                                                                                                                         high-freshness treatment

                                                                                                                                                                    4
Special Issue: Transform Fisheries into a Growth Industry with Market-in
Case
Example Changing business model to grasp needs (De Mer Corporation)
Before the Great East Japan Earthquake, a fishery processing company named De Mer
of Hachinohe (Aomori Prefecture) used to leave the marketing of its products to
wholesalers. After the disaster, however, the company radically changed its business
model in order to regain the lost market. It grasped retailers’ needs by building good
relationships through visits to their shops, etc., and used the obtained information for
product development.
Products that won the MAFF Minister
In spring 2016 the company developed a pickled mackerel product based on a proposal Award at the 27th national examination
by a mass retailer and sold the product in a package incorporating appeal points based meeting of comprehensive quality of
on hints from consumer response. The product won the MAFF Minister Award at the 27th processed fishery products
national examination meeting of comprehensive quality of processed fishery products.
Case
Example Change in The Way of Thinking to Find Needs for Okinawa Fish in Overseas Markets
(Kizasu Corporation)
The main business of Kizasu is direct selling of fresh fish from Okinawa to restaurants in
Singapore, Taiwan, Thailand, Hong Kong, etc. In Japan, most people think fatty fish
from the northern sea is tastier. Moreover, fish species around Okinawa are little known
in Japan northward from Kyushu and, therefore, difficult to sell outside Okinawa.
For this reason, the company paid attention to overseas markets southward from
Okinawa. People in Southeast Asia are familiar with fish species from Okinawa and
appreciate the tastiness of fatty fish near their northern limit. Thanks to rising needs for
Cooking miibai (Malabar Grouper)
tasty foods in Asian countries, export sales of the company have rapidly increased. Picture provided by Kizasu Corporation
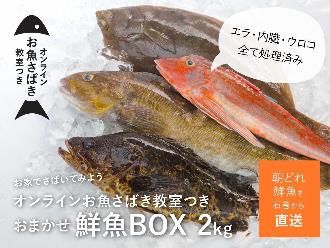
(2) Providing Fishery Products According to Needs
○One of the important factors that consumers and customers demand from fishery products is
tastiness. To respond to the needs, various efforts to maintain freshness, which include icing, blood
draining, spinal cord removal and quick freezing are widely made in fisheries and aquaculture
industries.
Case
Example Aquaculture Production According to Demand (Uwajima Project Corporation)
Uwajima Project of Uwajima city (Aichi Prefecture), jointly with local fish farmers and Ehime Research Institute of Agriculture,
Forestry and Fisheries, developed and branded Mikan Buri, which combines citrus and cultured fish that are both local
resources, pursuing attractiveness for food service industries and consumers, including a reduction of the fishy smell and
addition of citrus flavor in addition to prevention of browning of dark red meat. Because surveys found favorable response,
especially from women, the company further developed Mikan Bream and Uwajima Salmon (mikan silver salmon) targeting
women.
These products are directly sold to domestic food-service chains and
other customers. The products are also exhibited at overseas food
exhibitions with high evaluation from visitors.
In 2016 the project obtained the first halal certification in Japan for
cultured tuna and black skipjack with the aim of developing a market in
the Middle East. The project invited buyers of local restaurants
interested in Uwajima Salmon and other products to visit Japan for
better understanding of the products through observation of aquaculture
production and processing, and it established a system to ship the
products in the quantity according to needs. Producers also visited the Cultured fish favorably received for its citrus flavor in Japan and abroad
customers to understand market needs. Photo provided by Uwajima Project Corporation
Case
Example
Sell Biwako’s treasure “Biwa Trout” with Cooperation of Friends Across the Country!
(The new active group improving the fishery industry of Lake Biwa “BIWAKO STYLE”)
Biwa Trout is an endemic species of Lake Biwa. It is said to be very tasty with high-quality
fat in summer, which is its best season. Because most producers used to sell the fish only
to specific customers in a limited area, it was little known in other parts of Japan. In this
context, its prices fell due to the spread of the COVID-19.
To address this situation, interested people across Japan launched the new active group
improving the fishery industry of Lake Biwa “BIWAKO STYLE” and reinforced retail sales
on its website and E-commerce websites. The group developed high-quality frozen filet
products through blood draining, spinal cord removal and liquid freezer freezing. The
products are highly regarded by customers and the group rapidly attracted attention.
As a result of the activities, the group increased the sales by 300 to 400% compared to the Biwa Trout – endemic species of Lake
Biwa – most delicious in summer
fishing season of the previous year and is improving fishery processing facilities toward
business expansion next year. 5Special Issue: Transform Fisheries into a Growth Industry with Market-in
Case
Example Selling Local Fish Abroad through Processing According to Needs (SOL JAPAN Corporation)
SOL JAPAN of Shimane Prefecture is a fish processing company that processes fish and fishery
products of the prefecture and sells them in Japan and abroad. Responding to requests from its
exporting customers, the company provides products of seasonal fish purchased in the local
market, cut for sashimi, vacuum sealed in individual trays and quickly frozen.
This way SOL JAPAN can provide very fresh sashimi in the needed amount when needed in
overseas markets.
Toward revitalization of the local fisheries and further taking-in of market needs, the company is
trying to develop frozen sashimi of deep-sea porgy in its original shape because prices of the fish Vacuum-sealed and frozen sashimi
tend to be low due to unstable catch. slices of yellowtail amberjack
(Photo provided by SOL JAPAN)
Case Efforts in set net fishery to make catch according to demand (Manazuru Town Fishery
Example
Cooperative)
In set-net fishery of Manazuru Town Fishery Cooperative in Kanagawa Prefecture, daily catch fluctuated due to the characteristics of the
fishing method and fish prices fell at big catches. Japanese jack mackerel, Japanese common squid and other fish species are highly
demanded in direct sales stores in the prefecture and direct sales to restaurants outside of the prefecture, but the cooperative sometimes
could not fill orders due to unstable catch. It was a challenge to balance demand and supply.
To address the challenge, the cooperative undertook a reform including review of places to set nets. As a result, the ratio of much demanded
fish species increased from 14% to 33% and frequency of direct sales also increased. In addition, by installing fish preservation nets in set
nets to preserve live fish for shipping adjustment at the time of big catch, the cooperative maintained stable supply and increased the average
price of catch from 98 yen/kg to 233 yen/kg.
(3) Efforts to Identify Latent Needs
○In recent years, supermarkets and other players aiming to create distinctive sales corners
are making efforts to expand sales of domestic seafood.
○Concrete examples are: people familiar with seafood cooking providing an opportunity to eat
tasty fish according to needs through face-to-face selling; providing local fresh seafood under
the slogan of local production and local consumption; and online sales through e-commerce
and other websites in response to the spread of the COVID-19.
Case
Example Communicate Real Tastiness of Fish to Consumers by Strengthening Procurement and
Face-to-face Sales (Kakujoe Gyorui Holdings Co., Ltd.)
Kakujoe Gyorui Holdings has gained popularity also in inland areas where people eat less
fish and is increasing sales by selling a variety of highly fresh fish at affordable prices.
Fresh fish procured by experienced buyers at markets in the morning are delivered to stores
around the noon of the day. Store personnel explain how to eat the fish and provide
pretreatment service through face-to-face selling. In this way, the company provides
opportunities to eat tasty fish according to consumer needs.
Corner for face-to-face selling of fresh fish
Case
Example Expanding EC Service for Business to EC Service for Consumers in Response to the
Spread of the COVID-19 (Haneda Market Corporation)
Haneda Market provided fish and fishery products with ultimate freshness through air transportation to retailers and
restaurants. However, when the food-service industry was affected by the spread of the COVID-19, the company
lost almost all sales around April 2020.
To break through the situation, the company launched an e-commerce website to sell products for business to
consumers, in May of the same year. The site became widely known through the Internet and SNS. The project fit in
with eating-in demand and greatly recovered its sales.
Case
Example ”Pride Fish” – an Efforts Initiative to Identify Latent Needs (JF Group)
Since FY2014 the JF Group has been selecting “Pride Fish”—fishery products that
fishermen recommend with confidence—for each region and season and
disseminating the information. The Group holds fairs in supermarkets, department
stores and restaurants across the country, Fish-1 Grand Prix and other PR events. A
variety of information for expansion of consumption of domestic fishery products,
which include local restaurants providing Pride Fish and a variety of contents, is
disseminated through the Internet. Pride Fish is also sold at “JF Osakana Marche
Gyogyo Ichi”, a site that opened in February 2020 for direct selling.
Website of Pride Fish
6Special Issue: Transform Fisheries into a Growth Industry with Market-in
Case
Example Producers Trying Mail Order Business of Fresh Fish in Response to the Spread of
COVID19 (Fisherman Japan)
Fisherman Japan is a group of young fishermen and distributors active in Miyagi Prefecture. They
experienced a great decrease in sales for food services due to the spread of COVID19 .
Recognizing that the increase in demand for eating in is an opportunity to communicate the taste
as well as how to cut and enjoy high-quality fish, they started consumer mail-order business in
April 2020 to sell assortments including high-quality and high-price fresh fish that had been sold to
restaurants, etc.
Orderers receive instruction on how to cut fish through online meeting application. The Mail order of fresh fish accompanied
group also distributes internet videos for popularization of fish dishes. The efforts proved by an online video on fish preparation
effectual to maintain good sales. (Photo provided by Fisherman Japan)
(4) Efforts for Food Safety and Sustainable Fisheries and Aquaculture
○In recent years many seafood businesses are implementing initiatives to respond to HACCP in
order to extend their market. In fishing ports that serve as a logistic base of fishery products,
cargo handling and other places for high-level hygiene management have been developed.
○Increasing number of production sites are obtaining the Marine Eco-Label. In recent years
fisheries and aquaculture businesses not necessarily aimed at export, retailers and restaurants
are also obtaining the certificate.
Case
Example Constructing a Supply System Toward Export of High-quality
Fishery Products (Yaizu fishing port)
At Yaizu fishing port, where catches are landed by overseas purse seine fishing vessels,
there has been development of deep piers to accommodate large fishing vessels, high Ultra-low refrigeration plant
超低温冷蔵施設 PS products in the ultra-low
超低温冷蔵施設内部のPS製品
level sanitary control facilities to handle fishery products, and freezing/refrigerating (令和元年12月24日完成)
(completed on December 24, 2019) refrigeration plant
【超低温冷蔵施設情報】
[Information of the Ultra-low
facilities to store PS products* with the aim of expanding export. refrigeration plant]
As a result, the landing quantity of PS products has increased and products for export 冷蔵庫収容能力:公称3,000t
Refrigerator capacity (nominal):
温度帯:-40℃~-50℃
3,000t
are secured. In addition, EU・HACCP certified facilities have also increased in the Yaizu Temperature
整備費:1,587百万円 zone: -40 °C to -
50°C
工事完成年度:令和元年度
area, which is expected to contribute to export expansion. Takeout area and screening area are
Development cost: 1,587 million
腰壁・防鳥ネットにより、搬出エリア yen
separated with a retaining wall and bird-
と選別エリアを仕切り
proofing nets Completion: FY2019
*PS products: Products for eating raw that are produced through quick freezing of very fresh bonito, etc. Zoning
ゾーニング等の実施
by immersing in thick salt water of minus 20 degree Celsius and storing at an ultra-low temperature Examples of measures implemented at Yaizu fishing port
Case
Example Efforts Toward Sustainable Edomae Fishery (Kaiko Bussan Corporation)
Kaikobussan at Funabashi city (Chiba Prefecture) sells and distributes fresh fish caught in
Tokyo Bay.
The company, in collaboration with Daidenmaru and Nakasenmaru, which are companies
engaged in fishing boat fishery, is working on resource management including the collection of
catch information of purse sein fishery targeting sea bass. In April 2018 the company obtained
MEL certification for both production and distribution processing.
The company is communicating fishing activities in schools with the aim of transmitting the
traditions and culture of Edomae fisheries to the next generation, while at the same time
working to introduce catch traceability using ICT toward the balancing of resource Round haul netters collaborating
management and value creation. with Kaikobussan
Case
Example Retailers, etc. obtaining Marine Eco-Label
(1) AEON Co., Ltd.
AEON obtained CoC certification of MSC in 2007 and CoC certification of ASC in
2014. The 2020 Goals formulated by the company in April 2017 include a goal for all
general merchandise store and supermarket companies of the group to obtain CoC
certification of MSC/ASC. In FY2019 over 80% of the stores of the group obtained
Sushi role of MSC-certified scallops from
CoC certification. MSC/ASC certified fish species and items (including domestic fish Hokkaido
(Photo provided by AEON RETAIL Co., Ltd.)
and fishery products) sold by the group are expanding.
(2) Ito-Yokado Co., Ltd.
Ito-Yokado Co., Ltd., together with producers of original brand products of domestic
cultured fish, is working to obtain CoC certification of MEL. In March 2020 the
company became the first major retailer obtaining CoC certification of MEL in Japan.
Its stores nationwide started sales of Japanese yellowtail (from Kumamoto), Greater
Original brand products with the MEL logo
amberjack (from Kagoshima), red sea bream (from Mie) and flounder (from Mie) (Photo provided by Ito-Yokado Co., Ltd.)
with the MEL logo.
7Special Issue: Transform Fisheries into a Growth Industry with Market-in
Section 3 Promotion of Market-in Efforts to Transform Fisheries into a Growth
Industry
(1) Need for Further Promotion of Market-in Efforts
○It is expected that the world’s fish and fishery product consumption will increase and their prices
will remain high, but in Japan, fishery product consumption has been decreasing due to
orientation to a simplified diet and other factors. Recently, however, lifestyles are changing
under the impact of the spread of the COVID-19.
○Under such circumstances, fishery businesses, including fishermen and fishery processors, are
working to grasp and respond to consumer and customer needs in Japan and abroad.
○In order to transform Japan’s fisheries into a growth industry, it is necessary to ensure a
balance of price and quality as demanded by consumers and customers in Japan and abroad
by market-in activity, while at the same time giving extra consideration to food safety and
sustainability of products for export.
(2) Direction of Market-in Efforts
[Fisheries]
Compared with aquaculture, production planning is relatively difficult for fisheries, on the other
hand, fisheries produce natural fish and shellfish including mass-catchable pelagic fish.
However, by keeping live mass-catchable pelagic fish caught in large quantities in fish
reservation nets, it is possible to provide such fish in the needed quantity when needed, for
example. Fishermen need to make efforts with awareness that they are part of the value chain.
[Aquaculture]
Maximizing the advantages of aquaculture, which can provide products of steady quality in a
steady quantity, regularly and at steady prices, it is necessary to realize market-in aquaculture
by ensuring scheduled production based on the demand and production cycle by proactively
obtaining information of aquaculture items, utility form, quality and quantity according to
demand.
[Processing and distribution]
In order to respond to changes in lifestyle due to the spread of the COVID-19 and other factors,
it is important to utilize the Internet and SNS to directly sell processed or prepared products that
save time of preparation.
[Fish and fishery product export]
It is necessary to shift the entire value chain from production to sales to market-in form,
professionally and sustainably produce and export fish and fishery products of the
specifications demanded in overseas markets and develop a system to pioneer sales channels
in all possible ways.
[Obtain certification]
For market expansion in Japan and abroad, it is necessary to actively obtain HACCP
certification in response to the rise in food safety awareness, and Marine Eco-Label certification
in response to the movement to expand sustainable fisheries and aquaculture.
(3) Efforts of Governments to Promote Market-in Efforts
○It is important that businesses proactively carry out market-in activities, but governments
provide the following support for necessary activities:
① “Seashore Revitalization Plan” to support unified efforts of fishing communities
② Promotion of shift to “Market-in Aquaculture” by aquaculture ③ Acceleration of efforts for
fishery product distribution that fits in with needs
④ Promotion of activities to execute “The Strategy to Realize Export Expansion of Agricultural,
Forestry, Fishery and Food Products”
⑤ Measures in response to the changes in lifestyle, etc. caused by the expansion of the
COVID-19
8You can also read


