FY2021 Q2 Investment Reports
←
→
Page content transcription
If your browser does not render page correctly, please read the page content below
FAC Agenda Item 3b

                          FY2021 Q2 Investment Reports
BACKGROUND

The Oregon State University (university) investment reports for the second quarter (Q2, October
1 – December 31, 2020) of fiscal year (FY) 2021 are presented in the following four sections:
    • FY2021 Q2 Public University Fund Investment Report – This section includes a
       report on the investments of the Public University Fund (PUF) for the second quarter of
       FY2021. The PUF is an investment pool that is administered by the university on behalf
       of all Oregon public university participants, pursuant to legislation adopted by the 2014
       Legislature. The PUF holds assets of the following participating Oregon public
       universities: Eastern Oregon University, Oregon Institute of Technology, Oregon State
       University, Portland State University, Southern Oregon University, and Western Oregon
       University.
    • FY2021 Q2 Oregon State University Investment Report – This section includes a
       report on the investments of the operating and endowment assets of the university. This
       report reflects the university’s operating assets that are invested in the PUF, the
       university’s endowment and quasi-endowment investments managed by the Oregon
       State University Foundation, the land held as separately invested endowments, and the
       land grant endowment that is invested in the PUF.
    • FY2021 Q2 Oregon State University Report on Unspent General Revenue Bond
       Proceeds – This section provides a summary of unspent revenue bond proceeds as of
       December 31, 2020.
   •   FY2021 Q2 Market Background – This section provides a general discussion of the
       investment markets and related performance information during the second quarter of
       FY2021.

FY2021 Q2 PUBLIC UNIVERSITY FUND INVESTMENT REPORT
(Prepared by the Public University Fund Administrator)

Performance
The PUF gained 0.5% for the quarter ended December 31, 2020. The PUF’s three-year and
five-year average returns were 3.5% and 2.8%, respectively.

The Oregon Short-Term Fund (OSTF) returned 0.2% for the quarter and 0.5% fiscal year-to-
date, outperforming its benchmark by 20 and 40 basis points, respectively. The Core Bond Fund
returned 1.2% for the quarter and 2.2% fiscal year-to-date, outperforming its benchmark by 80
and 130 basis points, respectively.

In January, Oregon State Treasury fixed income investment officers, Will Hampson and John
Lutkehaus, conducted a quarterly performance review with university staff. Corporate Bonds
were strong performers during the quarter, supporting the Core Bond Fund’s 80 basis point
relative outperformance. The investment officers continued to reduce the Core Bond Fund’s
duration risk during the period on forecasts for rising interest rates triggered by improving
economic growth during the second half of calendar 2021.

                          April 1-2, 2021 Board of Trustees Meetings

Finance & Administration Committee                                                       Page 1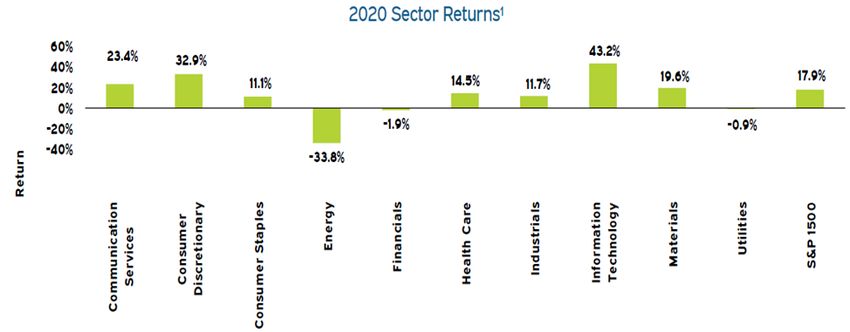
FAC Agenda Item 3b

Public University Fund Performance

                             Quarter    Current   Prior
                                                             3-Year     5-Year                     Asset
                              Ended      Fiscal   Fiscal                          Market Value                  Policy
                                                              Avg.       Avg.                    Allocation
                             12-31-20     YTD      YTD
                                                                                                                 $100
 Oregon Short–Term
                              0.2%       0.5%     1.3%        2.1%      1.7%      $406,081,734     67.6%        million
 Fund
                                                                                                               minimum¹
 Benchmark - 91-day           0.0%       0.1%     1.0%        1.6%      1.2%
 T-Bill
 PUF Core Bond
                              1.2%       2.2%     1.6%        4.8%       N/A      $194,688,306     32.4%
 Fund

 Blended Benchmark ²          0.4%       0.9%     1.9%        4.5%      3.5%

 PUF Total Return             0.5%       1.0%     1.5%        3.5%      2.8%      $600,770,040    100.0%

 PUF Investment Yield         0.3%       1.2%     1.5%        2.7%      2.3%

¹ The PUF policy guidelines define investment allocation targets based upon total participant dollars committed. Core
balances in excess of liquidity requirements for the participants are available for investment in the Core Bond Fund.
Maximum core investment allocations are determined based upon anticipated average cash balances for all
participants during the fiscal year.

² The Blended Benchmark comprises the Bloomberg Barclay’s Aggregate 3-5 Years Index (75%) and the Bloomberg
Barclay’s Aggregate 5-7 Years Index (25%).

A description of each investment pool’s portfolio characteristics and market exposures is
included in Appendix A of this report.

Investment Income and Participant Ownership

During the quarter, investment earnings distributed to the participants totaled $1,798,252

                                                        Earnings            Market Value as           %
                                                      Distribution ¹          of 12/31/20          Ownership
 Portland State University                                  $ 704,863          $ 246,631,688         41.0%
 Oregon State University ²                                   726,155             242,032,678         40.3%
 Western Oregon University                                   110,257              37,353,584          6.2%
 Oregon Institute of Technology                              103,042              30,068,930          5.0%
 Eastern Oregon University                                    88,873              25,718,592          4.3%
 Southern Oregon University                                   65,062              18,964,568          3.2%
 Grand Total                                               $1,798,252          $ 600,770,040        100.0%

¹The earnings available for distribution to participants were earned during the months of September 2020 through
November 2020 and distributed to participants in December 2020. Earnings are distributed to participants based
upon average cash and investment balances on deposit during the same period, which differs from the total market
value at the end of the quarter.

²As of December 31, 2020, Oregon State University’s total PUF market value consisted of operating assets, valued at
$241,700,213, and the land grant endowment, valued at $332,465.

                                  April 1-2, 2021 Board of Trustees Meetings

Finance & Administration Committee                                                                            Page 2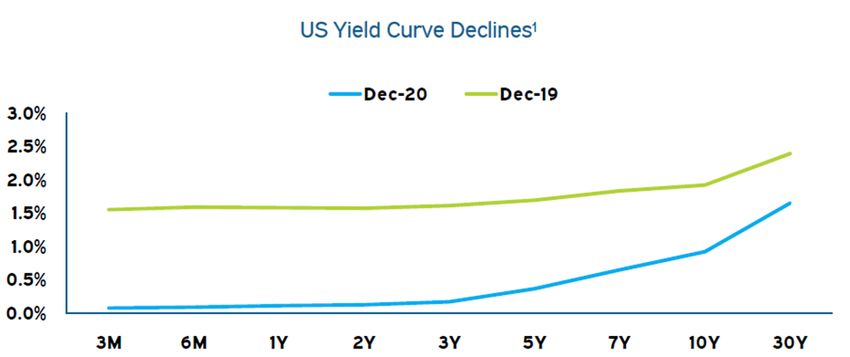
FAC Agenda Item 3b

FY2021 Q2 OREGON STATE UNIVERSITY INVESTMENT REPORT

The schedule of Oregon State University’s investments is shown in the following investment
summary.

Public University Fund Performance

Oregon State University’s operating assets and the land grant endowment are invested in the
Public University Fund (PUF). The report on the investment performance of the PUF, provided
in the separate section above, shows the PUF gained 0.5% for the second fiscal quarter ended
December 31, 2020.

OSU Unspent Bond Proceeds Performance

The report on the investment performance of the unspent bond proceeds, provided in the table
below, shows the funds invested in the Oregon Short-Term Fund gained 0.2% and the
separately managed short-duration fixed income fund gained 0.2% for the quarter. The total
market value of the unspent bond proceeds as of December 31, 2020 was $426,538,662.

OSU Endowment Asset Performance

The OSU Endowment Assets, including those managed by the OSU Foundation, increased
10.9% for the quarter and 17.2% fiscal year-to-date. The three-year average return was 9.6%.
The total market value of the OSU endowment assets as of December 31, 2020, was
$61,507,090.

The OSU Foundation, pursuant to an investment management contract, is managing the
majority of the university’s endowment assets. The OSU Foundation’s Endowment Pool
increased 12.5% for the quarter and 19.9% fiscal year-to-date. The investment pool
outperformed its benchmark by 10 basis points for the quarter while underperforming by 40
basis points fiscal year-to-date. The three-year average return was 9.4%.

                          April 1-2, 2021 Board of Trustees Meetings

Finance & Administration Committee                                                     Page 3
FAC Agenda Item 3b
April 1-2, 2021 Board of Trustees Meetings
Finance & Administration Committee Page 4FAC Agenda Item 3b
FY2021 Q2 OREGON STATE UNIVERSITY REPORT ON UNSPENT GENERAL REVENUE
BOND PROCEEDS
The schedule of Oregon State University’s unspent revenue bond proceeds as of December 31,
2020, is shown in the summary below.
Unspent Revenue Bond Proceeds1
Issuance Year 2015 2 2016 3 2017 4,5 2019 5 2020 Total
Unspent
Revenue
$ 279,830 $ 1,815,637 $ 54,383,360 $ 79,086,584 $ 299,933.171 $ 435,498,582
Bond
Proceeds
Allocated 6 $ 279,830 $ 1,815,637 $ 54,383,360 $ 50,803,412 $ 86,633,171 $ 193,915,410
Unallocated 7 $ - $ - $ - $ 28,283,172 $ 213,300,000 $ 241,583,172
1 Reported based on book value and does not include $199,995 unrealized gains (losses) or $3,712,905 investment
earnings not yet distributed.
2 Space Improvement Projects are forecasted to be fully expended in FY2021.
3 Primarilytaxable funds allocated to IT Systems Infrastructure project (Link Oregon).
4 Proceeds use approved June 2017.
5 Balance represents unspent 2017 and 2019 revenue bond proceeds as of December 31, 2020, including
$12,872,820 of proceeds invested in the PUF.
6 Allocated proceeds are proceeds committed to specific projects that have Stage Gate 2 approval by the Board.
7 Unallocated proceeds have not yet been committed to specific capital projects approved by the Board.
FY2021 Q2 MARKET BACKGROUND
(Prepared by Meketa Investment Group, consultants to the Oregon Investment Council. Meketa
Investment Group was recently engaged as the new investment consultant to the State
Treasury, previously Callan Associates.)
Report on Investments – as of December 31, 2020
Economic and Market Update
The global economy faced major recessionary pressures this calendar year, but optimism
remains for improvements in calendar year 2021, as economies are expected to gradually
reopen despite the recent spike in COVID-19 virus cases. Historic declines in growth in the U.S.
and Europe during the second calendar quarter were followed by record increases in the third
calendar quarter, due to pent up demand from the lockdown measures earlier in the year.
Recently, GDPNow from the Atlanta Fed estimated that fourth calendar quarter U.S. gross
domestic product (GDP) growth could be 7.4% (Quarter on Quarter annualized), down from
original estimates. Full calendar year U.S. GDP growth is forecasted to decline by 4.3% by the
International Monetary Fund.
Purchasing Managers Indices (PMI), based on surveys of private sector companies, initially
collapsed across the world to record lows, as closed economies depressed output, new orders,
April 1-2, 2021 Board of Trustees Meetings
Finance & Administration Committee Page 5FAC Agenda Item 3b
production, and employment. Readings below 50 represent contractions across underlying
components and are a leading indicator of economic activity, including the future paths of GDP,
employment, and industrial production. The services sector was particularly hard hit by stay-at-
home restrictions in many places. As the Chinese economy reopened, their PMIs, particularly in
the service sector, recovered materially. In the U.S., the indices have also improved from their
lows to above contraction levels. In Europe, manufacturing has largely recovered, but services
continue to show weakness due to increased lockdowns.
As the crisis grew into a pandemic, investors’ preferences shifted to holding U.S. dollars and
highly liquid, short-term securities like U.S. Treasury bills. Recently we have seen some
weakness in the dollar as the U.S. struggles with containing the virus and investors seek higher
growth non-U.S. assets, particularly in emerging markets. This has created pressures on
already stressed export-focused countries. Going forward, the dollar’s safe haven quality and
the relatively higher rates in the U.S. could provide support.
The U.S. Treasury yield curve declined materially during calendar year 2020, driven by safe-
haven demand, Federal Reserve (Fed) polices (policy rate cuts and the quantitative easing
program), and weak U.S. economic fundamentals. Over the last few months, the curve
steepened on gradual signs of economic improvement, vaccine developments, and
expectations for longer-dated Treasury issuance to support additional fiscal stimulus in the
coming months. Higher yields relative to other countries and the Fed potentially extending the
duration of their purchases could counterbalance steepening trends.
1 Source: Bloomberg. Data is as of December 31, 2020.
Credit spreads (the spread above a comparable Treasury) for investment grade and high yield
corporate debt widened sharply at the start of the pandemic as investors sought safety.
Investment grade bonds held up better than high yield bonds. The Federal Reserve’s corporate
debt purchase program for investment grade and certain high yield securities recently
downgraded from investment grade, was well received by investors. The policy support and the
search for yield in the low-rate environment led to a decline in spreads to below long-term
averages. Overall, corporate debt issuance has more than doubled since 2008, which magnifies
the impact of deterioration in the corporate debt market. This is particularly true in the energy
sector, which represents over 10% of the high yield bond market.
April 1-2, 2021 Board of Trustees Meetings
Finance & Administration Committee Page 6FAC Agenda Item 3b
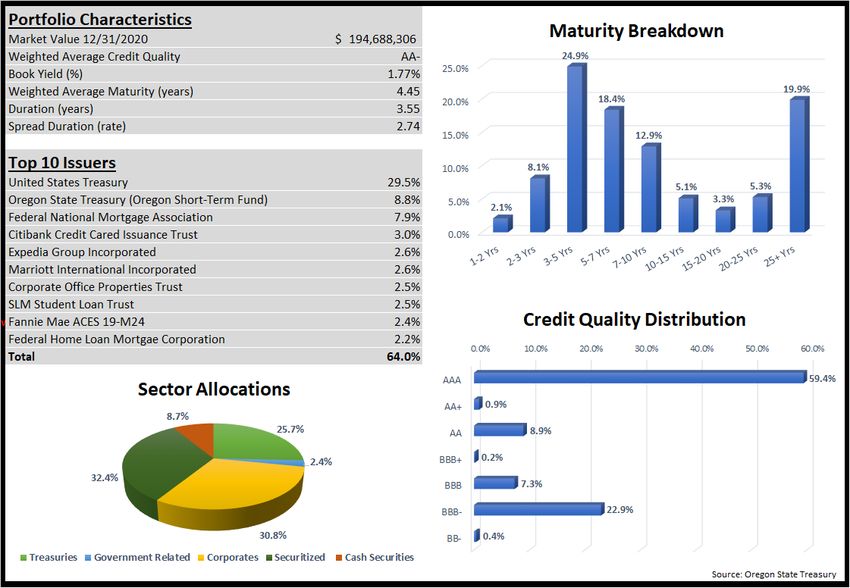
For the quarter, equities, particularly emerging markets (+19.7%), continued to do well given
progress on a U.S. fiscal package, the passing of the U.S. presidential election, and positive
developments regarding a COVID-19 vaccine. The yield curve steepened, weighing on Treasury
prices. For the calendar year, global risk assets recovered meaningfully from their declines to
finish in strong positive territory, largely driven by record fiscal and monetary policy stimulus and
much more certainty related to the containment of the virus.
Market Returns1
Source: Oregon State Treasury
1
U.S. equities and longer-dated Treasuries performed particularly well in calendar year 2020
given policy support. Chinese equities also performed well as China contained the virus and
consequently started the reopening of their economy earlier than others. European and
Japanese equity markets lagged behind the U.S. and emerging markets.
With the recent development of multiple vaccines, there have been signs of a rotation into more
cyclical stocks, but stay-at-home focused companies performed best in calendar year 2020.
Information technology was the best performing sector, with a narrow group of companies
including Amazon and Netflix driving market gains. The outperformance was due to consumers
moving to online purchases and streaming services. The consumer discretionary sector also
experienced gains as the economy reopened, people returned to work, and stimulus checks
were spent. Energy was the sector with the greatest calendar year 2020 decline, triggered by
the plunge in oil prices. Financials also struggled in this slow growth environment with demand
for loans down and low interest rates weighing on loan revenue.
April 1-2, 2021 Board of Trustees Meetings
Finance & Administration Committee Page 7FAC Agenda Item 3b
1 Source: Bloomberg. Data is as of December 31, 2020.
The market recovery has largely been driven by a few technology companies that benefited
from the stay-at-home environment related to the virus. In calendar year 2020, the S&P 500
technology sector returned +42.2%, compared to +8.4% for the S&P 500 ex- technology index,
with Amazon (+76%), Netflix (+67%), and Apple (+81%) posting especially strong results. The
outsized relative returns of these companies caused them to comprise an increasingly large
portion (23%) of the S&P 500, though this trend reversed in the final months of calendar year
2020.outperformed nominal U.S. Treasuries for the quarter as 10-year breakeven spreads With
positive developments regarding COVID-19 vaccines, equity valuations based on both forward-
and backward- looking earnings rose to levels not seen since 2001. Many are looking to
expected improvements in earnings growth, as the U.S. economy continues to reopen, to justify
market levels, with historically low interest rates also providing support.
1 Source: Bloomberg. Data is as of December 31, 2020
April 1-2, 2021 Board of Trustees Meetings
Finance & Administration Committee Page 8FAC Agenda Item 3b
RECOMMENDATION
Staff recommend the Finance & Administration Committee accept the FY2021 Q2 Public
University Fund Investment Report and the FY2021 Q2 Oregon State University Investment
Report
April 1-2, 2021 Board of Trustees Meetings
Finance & Administration Committee Page 9FAC Agenda Item 3b - Appendix A
Oregon Short Term Fund December 31, 2020
April 1-2, 2021 Board of Trustees Meetings
Finance & Administration Committee Page 10FAC Agenda Item 3b - Appendix A
Core Bond Fund December 31, 2020
April 1-2, 2021 Board of Trustees Meetings
Finance & Administration Committee Page 11You can also read