Gaining insight into the assimilated diet of small bear populations by stable isotope analysis - Nature
←
→
Page content transcription
If your browser does not render page correctly, please read the page content below
www.nature.com/scientificreports
OPEN Gaining insight into the assimilated
diet of small bear populations
by stable isotope analysis
Giulio Careddu1, Paolo Ciucci2*, Stella Mondovì1,2, Edoardo Calizza1, Loreto Rossi1 &
Maria Letizia Costantini1
Apennine brown bears (Ursus arctos marsicanus) survive in an isolated and critically endangered
population, and their food habits have been studied using traditional scat analysis. To complement
current dietary knowledge, we applied Stable Isotope Analysis (SIA) to non-invasively collected bear
hairs that had been individually recognized through multilocus genotyping. We analysed carbon
(δ13C) and nitrogen (δ15N) stable isotopes of hair sections and bear key foods in a Bayesian mixing
models framework to reconstruct the assimilated diet on a seasonal basis and to assess gender and
management status effects. In total, we analysed 34 different seasonal bear key foods and 35 hair
samples belonging to 27 different bears (16 females and 11 males) collected during a population
survey in 2014. Most bears showed wide δ15N and δ13C ranges and individual differences in seasonal
isotopic patterns. Vegetable matter (herbs, fleshy fruits and hard mast) represented the major
component of the assimilated diet across the dietary seasons, whereas vegetable crops were rarely
and C4 plants (i.e., corn) never consumed. We confirmed an overall low consumption of large mammals
by Apennine bears consistently between sexes, with highest values in spring followed by early
summer but null in the other seasons. We also confirmed that consumption of fleshy fruits peaked in
late summer, when wild predominated over cultivated fleshy fruits, even though the latter tended
to be consumed in higher proportion in autumn. Male bears had higher δ 15N values than females in
spring and autumn. Our findings also hint at additional differences in the assimilated diet between
sexes, with females likely consuming more herbs during spring, ants during early summer, and hard
mast during fall compared to males. In addition, although effect sizes were small and credibility
intervals overlapped considerably, management bears on average were 0.9‰ lower in δ 13C and 2.9‰
higher in δ 15N compared to non-management bears, with differences in isotopic values between the
two bear categories peaking in autumn. While non-management bears consumed more herbs, wild
fleshy fruits, and hard mast, management bears tended to consume higher proportions of cultivated
fruits, ants, and large mammals, possibly including livestock. Although multi-year sampling and larger
sample sizes are needed to support our findings, our application confirms that SIA can effectively
integrate previous knowledge and be efficiently conducted using samples non-invasively collected
during population surveys.
Knowledge of dietary requirements of wildlife species is fundamental to understand their physiology and ecol-
ogy, to assess the adequacy of food resources and their availability, and to accordingly inform management and
conservation planning1,2. Availability, accessibility, and nutritional quality of food resources can markedly affect
population dynamics3 and determine the extent to which wildlife species resort to anthropogenic foods, thereby
generating conflicts with h umans4–6. Bears are large-bodied and highly opportunistic omnivores whose diet
comprises a great diversity of vegetable matter and a variable amount of meat and invertebrates, with marked
variation according to latitude, season, and habitat p roductivity7. Depending on local conditions, brown bears
may cause conflicts with humans due to their ability to exploit anthropogenic food s ubsidies8–10. Especially in
human-modified landscapes, detailed knowledge of the feeding ecology of bears can efficiently guide conserva-
tion planning11–13, and this is important to inform both long-term habitat management14,15 and management
of food-conditioned b ears16. Accordingly, a consistent number of dietary studies have been carried out on sev-
eral bear populations7,8,17–21. These revealed that dietary differences reflect different nutritional and energetic
1
Department of Environmental Biology, Sapienza University of Rome, Rome, Italy. 2Department of Biology and
Biotechnologies “Charles Darwin”, Sapienza University of Rome, Rome, Italy. *email: paolo.ciucci@uniroma1.it
Scientific Reports | (2021) 11:14118 | https://doi.org/10.1038/s41598-021-93507-y 1
Vol.:(0123456789)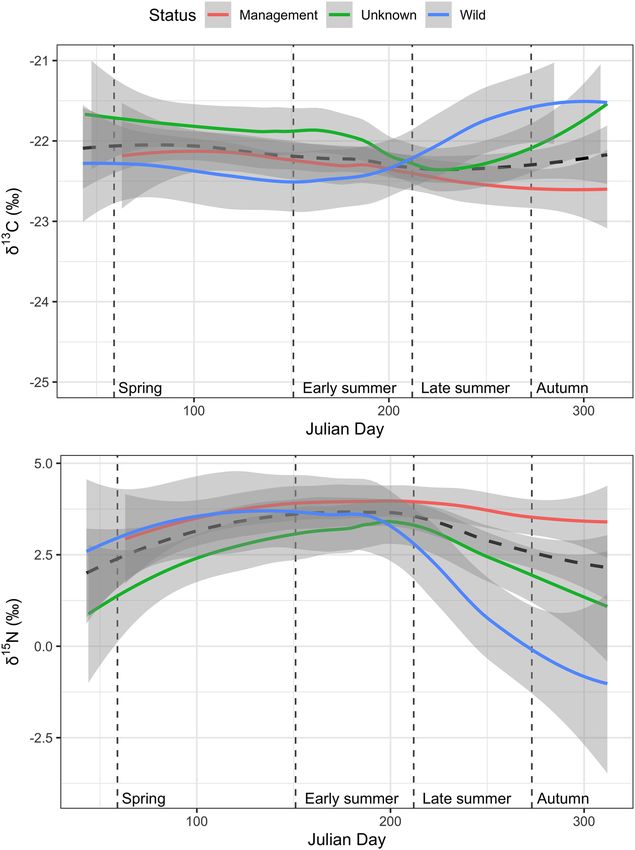
www.nature.com/scientificreports/
requirements of male and female b ears22,23, differences in their life cycle, as well as spatial and habitat segregation
between sexes due to behavioural mechanisms19.
Traditionally, food-habit studies on bears have been conducted by means of scat analysis, a rather conveni-
ent and practical technique that nevertheless does not necessarily allow an adequate interpretation in terms
of assimilated d iet15,24,25. In addition, quantification of undigested remains in the scats may largely underes-
timate occurrence of soft and highly digestible food items, therefore undervaluing their relative nutritional
contribution15,24,25. Alternatively, stable isotope analysis (SIA) of carbon (C) and nitrogen (N) has been increas-
ingly applied to b ears17,20,24,26–28. Based on whole organisms or samples of their t issues29–32, SIA is based on the
evidence that isotopic values are directly related to the assimilated diet, since tissues are synthetized from the
nutrients formerly assimilated, reflecting their isotopic composition in a predictable manner33,34. More recently,
Bayesian mixing models have been used to discriminate the proportional contributions of different assimilated
food items to the consumer diet28,35–37. Concerning Ursids, SIA has clarified some important issues regarding
their feeding ecology that could otherwise not be resolved with traditional scat analysis, from the paleoecology
of ancient or of extinct bears p opulations24,38, to the contribution of salmon in the assimilated diet of North
39
American brown b ears , or the relevance of white-bark pine nuts for grizzly bears in the Y ellowstone40,41. SIA
has been also successfully applied to detect crop foraging bears21,42 and bears conditioned to anthropogenic
foods20,43–45. SIA has also been applied to small and endangered bear populations (e.g., Asiatic black bears Ursus
thibetanus26,27 and Hokkaido brown b ear46,47) but, with the sole exception of the bear population in S lovenia48,
we are not aware of any published works that use this technique to investigate the nutritional ecology of other
brown bear populations in Europe.
In order to apply SIA, invasively collected tissue samples are costly, provide limited sample sizes, and are
impractical when dealing with endangered populations49. Alternatively, non-invasive sampling is ideal for SIA
applications26,27,42,50, especially for species whose hairs, vibrissae or feathers are relatively easy to c ollect26,27,51,52,
and bears are no e xception53–55. In particular, hairs act as an archive of past assimilated foods and can be harvested
by non-invasive sampling or conveniently obtained through DNA-based population surveys55,56, where isotopic
profiles can be reconstructed for individual bears18,20. Hairs are metabolically inert and the neosynthesized hair
portion reflects the more recently assimilated d iet57,58, not being affected by successive variation that may occur
in the diet26,59,60. Therefore, a temporal sequence in diet composition can be retrospectively read across hair sec-
tions, progressing from the tip to the root of the hair57. Bears have a single annual moult, occurring in a lapse of
time that spans from spring to summer40,60–62, and hair growth, at an approximate rate of 15 mm/month, lasts
for the entire period of activity each year, from the moult until d ormancy40,60–62. Therefore, comparing isotopic
values of sequential sections of the hair provide a means to investigate variation in the diet that may take place
during the hair growth p eriod26,57,59,60,63. Accordingly, stable isotope analysis of hair sections has been successfully
used to reconstruct bear d iets40,64,65, detect temporal shifts in the d iet21,25,44,66,67, and identify individual bears
20,21,26,27,42
habituated to anthropogenic f oods .
Apennine brown bears (Ursus arctos marsicanus) survive as a relict and isolated autochthonous population
of central Italy (Fig. 1), and are considered critically endangered at the E uropean68 and the national69 scales.
Despite long-time protection and conservation efforts, Apennine brown bears have not showed clear signs of
recovery and range expansion in the past decades70,71, despite the availability of suitable habitat at its connectiv-
ity at the landscape scale72. In addition to elevated risks of human-caused mortality, accumulated deleterious
mutations73 and a persistently small population size contribute to a substantial risk of extinction in the medium
term, especially if environmental stochasticity is taken into account74. Similarly to other small and isolated bear
populations75,76, a fundamental conservation strategy rests on habitat management to support range expansion
and to ensure long term productivity of the habitat.
Apennine bears feed on a large variety of herbaceous plants, wild fleshy fruits and hard mast, and show an
important dependency on beechnuts13. Ants also represent a high-energy rich key-food especially during the
summer77, while wild mammals (mainly ungulates) are consumed in the spring, though in lower proportions
compared to other European brown bear populations. Thus, habitat productivity, heterogeneity of food sources,
the close coexistence with humans and a variable interindividual diet can be critical for the survival of the
Apennine brown bear population. In particular, previous investigations of the food habits of Apennine bears
left unanswered relevant questions, n amely13: (i) the extent of gender and individual variation in the d iet23; (ii)
the potential underestimation of meat consumption15,17,78; and (iii) the relative contribution of wild vs cultivated
fleshy fruits in the diet, especially during fall. In addition, as depredation on livestock, crops and beehives occa-
sionally occur in this bear population, where food-conditioned bears are being increasingly reported (P. Ciucci,
pers. comm.), we were also interested in assessing the practical adoption of SIA to determine the dependency
by individual bears on anthropogenic s ources20,21,45.
We applied SIA to the Apennine bear population by taking advantage of individually DNA-identified hair
samples collected in a 2014 non-invasive survey54. This provided the opportunity to extend and complement our
current knowledge on the nutritional ecology of Apennine bears by testing the following research predictions:
(i) the assimilated diet of adult Apennine female bears, according to their smaller size, differs from that of adult
male bears23,39; (ii) the contribution of large mammals (i.e., wild and domestic ungulates) to the assimilated diet
is higher, especially during spring, with respect to what previously determined from scat a nalysis13,39; (iii) due to
the richness and diversity of fruit-bearing plants in the study area, the relative contribution of cultivated vs wild
fleshy fruits to the assimilated diet is negligible; (iv) similar to SIA investigations in other bear populations with
food-conditioned bears20,21,45, stable isotope profiles of Apennine bears allow identification of individuals with a
higher degree of dependency on anthropogenic food sources. By applying SIA through hair section analysis, and
accounting for both individual variation and natural vs anthropogenic foods, we exemplify how this technique
con improve inference about diets of mammal species in a wide variety of systems.
Scientific Reports | (2021) 11:14118 | https://doi.org/10.1038/s41598-021-93507-y 2
Vol:.(1234567890)www.nature.com/scientificreports/
Figure 1. Distribution of 35 bear hair samples used to apply Stable Isotope Analysis to assess the assimilated
diet of Apennine brown bears. Hair samples were collected through four sampling strategies (Acc: accidental
sampling, HS: hair-snagging; RAM: hair snagging at Rhamnus patches; RT: hair snagging at rub trees.) during
a survey of the bear population in the Abruzzo Lazio and Molise National Park (Central Italy, June–September
2014).
Results
Isotopic signatures of bear key‑foods and hair samples. We observed differences in the isotopic
composition of bear key foods for both δ13C (ANOVA, Factor = “Food Category”, F7,189 = 76.51, p < 0.001,
explained deviance ≈ 73%) and δ15N (ANOVA, Factor = “Food Category”, F 7,189 = 64.56, p < 0.001, explained
deviance ≈ 69%). In particular, herbs had the lowest δ13C and δ15N values, whereas cultivated vegetables had the
highest δ15N values (Table 1; Fig. 2). Values of δ13C wild fleshy fruits, cultivated fleshy fruits, and hard masts were
not different from each other (Tukey’s pairwise comparisons, p-value > 0.05 for both post-hoc comparisons).
However, δ15N values of cultivated fleshy fruits were higher than both wild fleshy fruits (p-value < 0.05) and hard
mast (p-value < 0.05). Ungulates had higher δ13C and δ15N values than wild fleshy fruits, cultivated fleshy fruit,
and hard masts (p-values always < 0.01, except δ13C of hard masts p-value < 0.05). Furthermore, they had similar
δ13C (p-value > 0.05) but higher δ15N compared to ants (p-value < 0.05).
Isotopic signatures of bear hair sections and seasonal diet. Overall mean stable isotopic values of
hair sections per individual bear were δ13C = − 22.1 ± 0.7‰ and δ15N = 3.1 ± 1.7‰, and we found no differences
in the mean δ13C and δ15N values between hair sections sampled pre- and post-moult (ANOVA, Factors = “Sam-
pling period”, F1,193 = 0.03, p > 0.5). We detected no differences in δ 13C values across seasons and sexes, although
we revealed differences among individual bears (ANOVA, Factors = “BearID”, F26,174 = 7.9, p < 0.001, explained
deviance ≈ 54%). However, we revealed differences in δ 15N values across seasons, sexes and individual bears
(ANOVA, Factors = “Season + Sex + BearID”, F29,165 = 10.72, p < 0.001, explained deviance ≈ 60%). In spring and
autumn, δ 15N values were lower compared with other seasons, and δ 15N values of male bears in these two
seasons were higher compared with female bears (p < 0.005) (Table 2). Due to the particularly high δ13C values
of C4 plants (Table 1), we failed to reveal corn consumption by the bears we sampled (Fig. 2). All the isotopic
signature of the hair sections, except 2 (successively removed from the models), fell within the 95% mixing
region (Supplementary Figure 1). In all seasons, the models that included the covariate “BearID” were the most
supported (Table 3). At the population level, the estimated mean probability of consumption of herbs was 34.1%
(CI 25.7–43.3%) in spring and 24.6% (CI 16.2–34.2%) in early summer, but was null in late summer and autumn
(Table 4). According to the model “Sex + BearID” (Table 3), in spring, herbs appeared to be consumed more
abundantly by female bears (33.6%; CI 24.7–43.1%) than males (25.9%; CI 3.8–65.3%) (Fig. 3). The probability
of bears consuming cultivated vegetables was null in all seasons (Table 4).
The mean probability of bears consuming ungulates was overall relatively low, with highest values observed in
spring (7.4%; CI 3.8–12.9%) followed by early summer (4.6%; CI 2.0–9.5%), but null in late summer and autumn
(Table 4), consistently between sexes, and individual bears.
Scientific Reports | (2021) 11:14118 | https://doi.org/10.1038/s41598-021-93507-y 3
Vol.:(0123456789)www.nature.com/scientificreports/
δ13C (‰) δ15N (‰) [C] [N] Sample
Mean SD Mean SD Mean SD Mean SD size
Herbs − 30.1 1.6 − 2.2 1.8 45.9 1.7 2.7 1.1 63
Chenopodium bonus-henricus − 28.8 0.8 − 2.3 1.4 46.2 1.0 5.1 1.4 3
Compositae − 31.0 1.9 − 2.2 1.8 45.2 1.8 2.4 0.6 13
Graminacea − 29.7 1.4 − 2.7 1.8 46.2 1.9 2.4 1.3 28
Trifolium thalii − 30.3 1.1 − 1.0 0.6 45.7 1.4 3.4 0.6 9
Umbrelliferae − 30.2 1.9 − 1.9 2.4 45.5 1.3 2.3 0.3 10
Hard masts − 27.6 1.5 − 0.7 2.1 50.4 7.7 2.1 1.4 18
Fagus sylvatica − 28.1 1.9 − 0.8 2.0 54.6 4.0 3.7 0.8 6
Quercus cerris − 27.2 2.0 − 3.2 0.9 45.6 0.6 0.7 0.1 6
Quercus pubescens − 27.6 0.8 0.4 1.7 44.9 1.0 1.4 1.2 6
Wild fleshy fruits − 27.8 1.5 − 2.6 2.1 46.8 2.9 0.8 0.4 46
Cornus mas − 28.2 2.1 − 5.6 0.6 42.8 0.3 0.4 0.1 3
Crataegus monogyna − 26.7 0.8 − 3.0 1.0 44.4 0.9 0.6 0.1 4
Fragaria vesca − 29.1 2.4 − 3.0 2.7 48.8 1.5 1.4 0.3 5
Malus sylvestris − 26.9 0.9 − 3.2 1.3 44.9 0.6 0.4 0.2 5
Prunus spinosa − 28.2 1.0 − 1.9 2.5 48.9 1.8 0.7 0.4 4
Pyrus pyraster − 27.3 0.1 − 1.9 1.3 46.7 3.0 0.6 0.0 3
Rhamnus alpina − 27.4 1.0 − 2.4 2.0 45.2 0.7 0.7 0.1 7
Rosa canina − 26.2 0.8 − 2.3 3.5 45.0 1.2 0.9 0.3 5
Rubus idaeus − 29.9 1.2 − 3.6 1.6 51.0 1.3 1.3 0.2 4
Rubus ulmifolius − 28.6 0.9 − 0.9 1.7 49.4 2.8 1.2 0.3 6
Cultivated fleshy fruits − 27.2 1.4 0.6 2.4 43.5 1.2 0.6 0.4 16
Ficus carica − 28.5 0.3 − 1.5 0.2 45.4 1.3 1.0 0.2 3
Malus domestica − 25.8 1.5 0.5 2.3 43.5 0.3 0.4 0.2 4
Prunus domestica − 28.3 1.5 3.7 1.3 43.0 0.5 0.9 0.4 3
Pyrus communis − 26.9 0.6 0.1 2.3 42.7 0.7 0.3 0.1 6
Cultivated vegetables − 28.5 1.5 9.0 3.3 38.0 3.7 294 1.3 12
Cichorium intybus − 28.5 0.3 10.6 3.2 37.2 2.3 2.5 0.4 3
Daucus carota − 26.4 1.0 4.4 0.5 40.7 1.5 1.4 0.2 3
Eruca vesicaria − 29.0 0.3 10.5 0.7 34.7 4.0 4.2 0.7 3
Lactuga sativa − 30.0 0.1 10.5 2.7 39.3 4.4 3.5 1.6 3
Ungulates − 25.1 1.3 4.3 2.0 49.9 4.5 4.0 2.1 7
Bos taurus − 25.5 0.2 2.2 0.6 49.3 1.1 3.6 0.2 1
Capra hircus − 24.1 0.0 3.7 0.2 48.1 0.7 3.5 0.0 1
Cervus elaphus − 26.3 1.0 3.9 1.4 53.2 6.6 5.2 3.5 3
Ovis aries − 23.1 0.0 7.8 0.9 46.2 0.9 3.4 0.1 1
Sus scrofa − 25.3 0.0 4.5 0.3 49.1 1.5 3.5 0.1 1
Formicidae − 26.6 1.2 1.7 1.1 52.0 5.5 9.4 1.7 26
C4—Zea mays − 11.9 0.4 4.3 1.5 45.6 0.5 17.4 2.3 3
Table 1. Mean isotopic ratios and elemental concentrations for sampled Apennine bear key foods in the
National Park of Abruzzo Lazio and Molise, central Italy.
Estimated ant consumption was marked in early summer (36.6%; 25.8–43.9%) but negligible in the other
seasons. According to the models “Sex + BearID” (Table 3), during summer consumption of ants tended to be
higher for female (34.5%; CI 25.9–43.5%) than male (19.1%; 4.2–39.9%) bears (Fig. 3).
Wild fleshy fruits were consumed mostly in late summer (59.2%; CI 49.3–68.4%) and in lower amount in early
summer (21.0%; CI 13.2–30.0%) and autumn (10.9%; CI 5.6.1–17.5%) (Table 4), with no differences between
female and males (Fig. 3). Cultivated fleshy fruits were consumed only in late summer (15.2%; CI 9.0–22.8%) and
autumn (15.6%; CI 9.1–23.3%) (Table 4), without differences between sexes (Fig. 3). The estimated consump-
tion of hard mast for the population peaked in autumn (67.4%; CI 57.6–76.1%), followed by spring (39.1%; CI
29.9–48.3%) and late summer (11.7%; CI 6.2–18.7%) (Table 4). During fall, males tended to exploit less hard mast
(57.6%; CI 13.7–92.8%) than females (67.5%; CI 58.1–76.3%), while these differences waned in spring (Fig. 3).
Mean δ13C values of individual bears ranged from − 23.5 ± 0.3‰ to − 21 ± 0.3‰ (Supplementary Table S1),
while mean δ15N values ranged from − 0.5 ± 0.6‰ to 5.4 ± 0.5‰ (Supplementary Table S1). We revealed remark-
able individual variation in the consumption of herbs in spring, that ranged from 15.5% (CI 0.7–51.9%), for
one food-conditioned female (FP01), to 73.3% (CI 5.7–95.1%; Supplementary Table S2). In late summer, the
probability of wild fleshy fruits consumption was lowest for bear FP01 (33.9%, CI 2.1–77.4%) but highest for
Scientific Reports | (2021) 11:14118 | https://doi.org/10.1038/s41598-021-93507-y 4
Vol:.(1234567890)www.nature.com/scientificreports/
Figure 2. Distributions of posterior probabilities of each diet type for Apennine brow bears provided by stable
isotope mixing models with informative priors (Abruzzo Lazio and Molise National Park, central Italy, 2013–
2014).
δ13C (‰) δ15N (‰)
No of hair
Season Sex Mean SD Mean SD No of bears sections
F − 22.0 0.8 2.9 1.2 14 45
Spring
M − 22.0 0.7 3.5 0.8 5 9
F − 22.1 0.7 3.6 1.1 13 40
Early summer
M − 22.4 0.6 3.8 0.9 11 21
F − 22.1 0.8 3.2 1.8 16 33
Late summer
M − 22.6 0.6 3.5 1.9 8 22
F − 22.0 0.6 1.7 2.3 6 14
Autumn
M − 22.4 0.7 2.7 2.4 6 12
Table 2. Mean carbon and nitrogen isotopic values across hair sections of Apennine brown bears according to
gender and dietary season (Abruzzo Lazio and Molise National Park, central Italy, 2013–2014).
Scientific Reports | (2021) 11:14118 | https://doi.org/10.1038/s41598-021-93507-y 5
Vol.:(0123456789)www.nature.com/scientificreports/
Season Model structure LOOic SE LOOic ΔLOOic SE ΔLOOic Weight
Status + BearID 168 23.5 0 – 0.548
Sex + BearID 169.1 22.2 1.1 3.8 0.316
BearID 170.8 23.3 2.8 2.8 0.135
Spring Sex + Status 197.6 29.3 29.6 12.1 0
Status 198.3 28.5 30.3 11.4 0
Null 207.1 25.4 39.1 12.1 0
Sex 210.3 24.9 42.3 11.8 0
Status + BearID 176.8 16.9 0 – 0.698
BearID 179.1 17.4 2.3 3.5 0.221
Sex + BearID 181.1 17.3 4.3 3.7 0.081
Early summer Sex + Status 221.2 19.6 44.4 10.6 0
Status 226.9 21.3 50.1 10.7 0
Sex 238.6 23.8 61.8 13 0
Null 241.9 26.1 65.1 15.2 0
BearID 210.7 16.7 0 – 0.558
Sex + BearID 211.4 16.2 0.7 1 0.393
Status + BearID 215.6 16.1 4.9 5.2 0.048
Late summer Sex + Status 223.3 17.1 12.6 9.7 0.001
Status 237.8 17.7 27.1 10.6 0
Null 255.5 18.2 44.8 6.1 0
Sex 257.8 17.9 47.1 6.3 0
Status + BearID 81.8 9 0 – 0.362
Sex + BearID 82 9 0.2 0.5 0.327
BearID 82.1 9.2 0.3 0.6 0.311
Autumn Sex + Status 120 9.4 38.2 4.7 0
Status 122.7 9.4 40.9 5.1 0
Null 127.2 9.3 45.4 3.7 0
Sex 128.4 9.2 46.6 3.3 0
Table 3. Model selection of seasonal sets of Stable Isotope Mixing Models to assess factors affecting the
assimilated diet of Apennine bears (June–September 2014, Abruzzo Lazio and Molise National Park, central
Italy). LOOic: LOO information criterion; SE LOOic: standard error of LOOic; ΔLOOic: difference between each
model and the model with lowest LOOic; SE ΔLOOic: standard error of the difference between each model and
the model with lowest LOOic; Weight: relative support for each model, calculated as Akaike weights. Akaike
weights > 0.2 were highlighted in bold.
Spring Early summer Late summer Autumn
Key food category Mean % 2.5% 97.5% Mean % 2.5% 97.5% Mean % 2.5% 97.5% Mean % 2.5% 97.5%
Hard mast 39.1 29.9 48.3 7.9 3.3 14.5 11.7 6.2 18.7 67.4 57.6 76.1
Cultivated fleshy fruits 0 0 0 5.1 1.7 10.2 15.2 9 22.8 15.6 9.1 23.3
Wild fleshy fruits 13.7 7.7 21.1 21.0 13.2 30 59.2 49.3 68.4 10.9 5.6 17.5
Ungulates 7.4 3.8 12.9 4.6 2 9.5 3.3 1.3 6.4 2.8 0.7 6.8
Herbs 34.1 25.7 43.3 24.6 16.2 34.2 5.0 1.3 10.1 1.8 0.2 5.4
Formicidae 4.4 1.4 8.8 34.6 25.8 43.9 4.2 1.3 8.5 0.9 0 3.2
Cultivated vegetables 1.3 0.2 3.4 2.1 0.5 4.9 1.4 0.3 3.6 0.6 0 2.5
Table 4. Mixing model estimated dietary proportions of key foods categories for Apennine brown bears
(Abruzzo Lazio and Molise National Park, central Italy, 2013–2014). Values are reported as mean probabilities
and upper and lower 95% credibility intervals. Food categories are ordered in descending order relative to
Autumn.
three non-management bears (F03: 81.9%, CI 16.4–98.7%; HS0853: 86.3%, CI 14.5–99.1%; M12: 87.7%, CI
10.9–99.2%) (Supplementary Table S2). In autumn, the proportion of cultivated fleshy fruits ranged from 2.4%
(CI 0–14.5%) for bear M12 to 54.7% (CI 0–100%) for bear HS465 (Supplementary Table S2). Concerning hard
mast, consumption in autumn ranged from 2.9% (CI 0–20.7%) for bear HS465 to 83.5% (CI 0–100%) for bear
Scientific Reports | (2021) 11:14118 | https://doi.org/10.1038/s41598-021-93507-y 6
Vol:.(1234567890)www.nature.com/scientificreports/
Spring Early summer
Ungulates M. Ungulates M.
Formicidae M. Formicidae M.
Cultivated fleshy fruits M. Cultivated fleshy fruits M.
Cultivated vegetables M. Cultivated Vegetables M.
Hard.mast M. Hard mast M.
Wild fleshy fruits M. Wild fleshy fruits M.
Herbs M. Herbs M.
Ungulates F. Ungulates F.
Formicidae F. Formicidae F.
Cultivated fleshy fruits F. Cultivated fleshy fruits F.
Cultivated Vegetables F. Cultivatd vegetables F.
Hard mast F. Hard mast F.
Wild fleshy fruits F. Wild fleshy fruits F.
Herbs F. Herbs F.
0.00 0.25 0.50 0.75 1.00 0.00 0.25 0.50 0.75 1.00
Late summer Autumn
Ungulates M. Ungulates M.
Formicidae M. Formicidae M.
Cultivated fleshy fruits M. Cultivated fleshy fruits M.
Cultivated Vegetables M. Cultivated vegetables M.
Hard mast M. Hard mast M.
Wild fleshy fruits M. Wild fleshy fruits M.
Herbs M. Herbs M.
Ungulates F. Ungulates F.
Formicidae F. Formicidae F.
Cultivated fleshy fruits F. Cultivated fleshy fruits F.
Cultivated vegetables F. Cultivated vegetables F.
Hard mast F. Hard mast F.
Wild fleshy fruits F. Wild fleshy fruits F.
Herbs F. Herbs F.
0.00 0.25 0.50 0.75 1.00 0.00 0.25 0.50 0.75 1.00
Proportion of consumpion
Figure 3. Mean estimated posterior proportional dietary contribution for male (M) and female (F) Apennine
Brown bears in the four dietary seasons (Abruzzo Lazio and Molise National Park, central Italy, June–September
2014). Circles represent the median contribution, of each key-food category, to bears diet, with 95% (thin lines)
and 50% (thick lines) credibility intervals.
M12 (Supplementary Table S2), and in spring from 12.3% (CI 0.4–77.2%) for bear F09 to 60.3% (CI 8–50.4%)
for bear F01(Supplementary Table S2).
We observed differences in δ 13C and δ 15N isotopic signatures between management and the other bears,
with the former being 0.9‰ lower in δ 13C (ANOVA, Factors = “Season * Status”, F7,187 = 2.67, p < 0.05, explained
deviance ≈ 5%) but 2.9‰ higher in δ 15N compared to non-management bears, in particular during fall (Fig. 4;
ANOVA, Factors = “Season * Status”, F7,187 = 10.01, p < 0.001, explained deviance ≈ 25%). According to the model
“Status”, compared to than management bears non-management bears exploited more herbs in spring (27.6%, CI
0–75.0%), more wild fleshy fruits both in early (33.0%, CI 2.1–74.4%) and late (78.5%, CI 7.7–97.4%) summer,
and more hard mast in autumn (76.2%, 20.5–96.9%) (Fig. 5). On the other hand, management bears tended to
consume greater proportions of meat (3.6%, CI 1.8–6.0%) in early summer, and of cultivated fleshy fruits both
in late summer (15.5%, CI 9.0–22.8%) and autumn (15.4%, CI 9.3–23.1%) (Fig. 5).
Discussion
This is the first application of stable isotopes analysis to the study of the feeding habits of the Apennine brown
bears, and our findings functionally complement previous dietary knowledge based on traditional scat a nalysis13.
Applying SIA to guard hair sections of Apennine bears allowed us to reconstruct their assimilated diet with an
enhanced seasonal and individual resolution. Our findings confirm the importance of key foods, such as hard
mast during autumn, fleshy fruits in late summer, and ants during early summer, for the maintenance and
growth of bear tissues. By using hair sections of previously genotyped individual bears, we have found indica-
tions of dietary differences between female and male bears, confirmed a low contribution of meat (ungulates)
compared to other brown bear populations, and failed to find a strong dependency on anthropogenic foods.
Nevertheless, a single year of sampling and relatively small sample sizes for some season and sex/management
status combinations, coupled with small effect sizes, somehow require cautious interpretation of some of our
findings. By sampling in 2014 only, our diet description reflects conditions specifically met in the year of sampling
and does not capture the expected year-to-year variation in foods available to bears. For example, the relatively
high consumption of hard mast in spring that we reported (Table 4) is unlikely to occur in a typical year, except
Scientific Reports | (2021) 11:14118 | https://doi.org/10.1038/s41598-021-93507-y 7
Vol.:(0123456789)www.nature.com/scientificreports/
Figure 4. Stable isotope values (δ13C, upper panel, and δ15N, lower panel) of Apennine bear hair sections across
the activity period (Abruzzo Lazio and Molise National Park, central Italy, June–September 2014). Dashed line
indicates smoothed mean for the population and the grey shaded area its 95% confidence interval.
following mast years when overwintering hard mast may still be available to bears from the previous fall13.
Likewise, the differences we found in the assimilated diet between male and female bears, or between bears of
different management status, suffer from considerable uncertainty, as exemplified by the large overlap between
the credibility intervals we reported (cf. Fig. 3). While these results hint at likely important differences, stronger
statistical inference would benefit from longer, replicated studies and greater sample sizes.
SIA has been previously applied to several dietary studies on American black bears (Ursus americanus),
Asiatic black bears, and brown b ears20,26–28,35,60. Compared to these studies, and in particular to those compris-
ing isotopically well separated items such as s almon19,65,66,79 or C4 plants21,42, the results of our mixing models
were less obvious, although we sampled all key foods of Apennine brown bears. This is due to the similarity in
the δ13C and δ15N values among the food sources that contribute to the Apennine bear’s diet, as also revealed
in similar ecological conditions for brown bears in Slovenia48. Nevertheless, using adequate priors in mixing
models we alleviated this issue, estimating the proportion of assimilated food sources with a seasonal resolution
by individually-recognized bears. However, when dealing with stable isotope data, some degree of uncertainty
is inherent in SIA, including natural variability in the sources’ isotopic signatures, variable TEF within a given
species, different stable isotope ratios in different tissues, variations in the isotopic source and mixture process
errors80. It has been recently recognized that the use of informative priors may introduce bias in the posterior
Scientific Reports | (2021) 11:14118 | https://doi.org/10.1038/s41598-021-93507-y 8
Vol:.(1234567890)www.nature.com/scientificreports/
Figure 5. Mean estimated posterior proportional dietary contribution for wild (WILD), unknown (UNKN)
and management (MGNT) Apennine Brown bears in four dietary seasons (Abruzzo Lazio and Molise National
Park, central Italy, June–September 2014). Circles represent the median contribution, of each key-food category,
to bears diet, with 95% (thin lines) and 50% (thick lines) credibility intervals.
e stimations81,82, leading to erroneous representations of diet c omposition83–85. Nevertheless, we believe that incor-
porating informative priors based on non-isotopic data, such as prior knowledge on diet composition obtained
with traditional dietary methods, in some cases can improve the precision of dietary reconstruction by SIMMs.
This is especially true when dealing with food sources that overlap largely in the isotopic mixing space, as in
the case we observed with hard mast, wild fleshy fruits, and cultivated fleshy fruits. In addition, when multiple
sources have similar isotopic values, uninformative priors may equate each of these sources, rendering them of
similar importance in the diet and resulting in a large degree of uncertainty86. Accordingly, we observed similar
effects with herbs, hard mast, wild fleshy fruits, and cultivated fleshy fruits in our study area, all resources whose
estimated proportion in the diet would have been the same had we used uninformative priors (Supplementary
Figure S2). In addition, the adoption of uninformative priors can overestimate the consumption of a resource
also in seasons when it is not available, as it might be the case with resources that are available for short bursts
of time (i.e., ants in the bear summer diet13,77,87). We therefore believe that, in our case, models with informative
priors are better suited to provide a more realistic estimation of the bear diet, and this is in line with evidence
from other studies88, including those based on experimental feeding trials89,90. Moreover, in our case the adop-
tion of informative priors allowed us to draw inference about the likely difference between the assimilated diet
of male and female bears, or between that of management and non-management bears (covariates not directly
influenced by priors), which was a relevant research question of our work.
Although we obtained indications of likely dietary differences between sexes and between management and
non-management bears, most bears showed high variance in the δ13C and δ15N values and significant inter-
individual differences in their seasonal isotopic patterns. Vegetable matter (herbs, fleshy fruits and hard mast)
represented the major component of the assimilated diet across the dietary seasons, but neither C4 plants (corn)
nor vegetable crops emerged as staple and recurrent foods for Apennine bears.
Brown bears are opportunistic consumers, and their trophic preferences are strictly related to the seasonal
presence and abundance of food resources across multiple trophic levels7. Apennine bears are no exception and
feed primarily on plant matter and acorns13. We did not observe any important contribution of terrestrial meat
Scientific Reports | (2021) 11:14118 | https://doi.org/10.1038/s41598-021-93507-y 9
Vol.:(0123456789)www.nature.com/scientificreports/
sources, such as wild ungulates or livestock, nor of vegetables derived from crops and gardens. Although we
failed to detect differences in the consumption of ungulates by male and female bears, the high nitrogen isotopic
signatures in male bears during spring and autumn could indeed be related to a major intake of animal protein by
male bears. As expected, the consumption of ungulates by Apennine bears, and in particular by dominant male
bears, can reflect scavenging on winter-killed ungulates or abandoned livestock c arcasses91. Bear predation on
free-ranging sheep and calves do occur in the Abruzzo Lazio and Molise National Park (PNALM) mostly dur-
ing summer13,92, but in our analysis we could not discriminate between wild and domestic ungulates due to the
similarity in their isotopic signatures. Compared to other European bears93,94, the low consumption of ungulates
by Apennine bears can account for their smaller size, possibly enabling them to meet their energy requirements
feeding at lower trophic levels than larger bears95–97. Moreover, we did not report any evidence of consumption
of vegetable from farming. Isotopic signal of cultivated vegetables analyzed in this study were very high in δ15N,
compared both to natural plant resources and to isotopic signal of bear hair sections, possibly accounting for the
use of organic fertilizers98,99. Since none of the bears we sampled reflected such high δ15N values, it is reasonable
to expect that cultivated vegetables are not largely consumed in this bear population. Furthermore, in early sum-
mer, our findings suggest a higher consumption of ants by females compared to males. The use of ants as food
by bears occurs essentially during this season, when the availability of ants and their brood increased77,100–102.
Our observations are congruent with a previous scat-analysis study according to which ants were estimated to
provide an average of 35.7% of digestible energy to Apennine brown b ears77, and with reports for brown and
8,100,103–106
black bears . Ants are rich in protein (up to 50%) and thus are an important source of essential amino
acids100,107,108. They represent a consistent and easy-accessible food source, contributing to meet the additional
energy and protein requirements for lactation and cub growth108. A greater ant consumption by female bears,
as our findings seem to indicate, may also reduce intraspecific competition with males, thus mitigating the risk
of infanticide18,19,22,39. Fleshy fruits were another important key food for Apennine bears, especially in late sum-
mer, when hard mast is not yet completely ripe, or also in autumn in mast-failure years13. Although fleshy fruits
can be an excellent source of energy due to their high carbohydrate content, they can be very low in protein, in
specific amino acids, or in other nutrients109. Fruits usually contain between 3 and 7% of crude protein, which
is below the minimum/optimum dietary protein requirement (≈ 12–17%)109,110. This could explain why bears
are inclined to consume fruits as part of a mixed diet, suggesting an optimization process between the cost of
maintenance and the energy requirement, in accordance with the optimal foraging t heory111.
Using SIA we were also able to discriminate between consumption of wild vs cultivated fleshy fruits, a crucial
point not clarified in previous dietary studies13. Cultivated fleshy fruits had higher δ15N and δ13C values than
wild fruits, likely revealing the use of organic fertilizers similarly to cultivated v egetables98,99. Based on this, we
found that, although with high inter-individual variation, Apennine bears consumed up to 15% of cultivated
fleshy fruits both in late summer and autumn, representing 20.3–66%, respectively, of all fleshy fruits consumed
in these seasons. Despite the PNALM is a productive ecosystem of wild fruits for bears, such as Rhamnus, wild
rose, wild pears and other wild fruit ripening during the hyperphagic p hase13, the consumption of cultivated
fleshy fruits that we revealed could be due to the availability of abandoned or easily accessible c ultivations70.
Another relevant insight offered by our SIA application is the likely difference in δ15N and δ13C values between
management and non-management bears. While the two bear categories shared similar isotopic values in spring,
their difference was increasingly marked for the rest of the active period. During spring, herbaceous vegetation
is an important source of energy and protein, and in particular newly sprouted plants that are rich in nutrients
and protein and lower in fi ber112–115. In this season, both management and non-management bears are offered
a similar diet of newly grown herbaceous vegetation and a few overwintered carcasses of ungulates, with few
anthropogenic foods still available compared to other seasons. In late summer and autumn, however, while non-
management bears preferentially foraged on fleshy fruits and hard mast, management bears appeared to use a
richer array of anthropogenic food sources as they became increasingly available. Despite no direct measures
of habitat productivity are available in the PNALM, no evidence supports the hypothesis that food limits the
bear population in the study a rea70. However, limited bear depredation of crops, livestock, poultry and domestic
rabbits has been an issue since the late 1 960s70,92. As observed in other s tudies20,26,27,42, our findings indicate that
management bears that fed on anthropogenic food sources tended to have higher δ15N than non-management
bears. For example, one management bear (FP01) had the highest δ15N value during the entire year, and this
female is well known to repeatedly visit villages for anthropogenic foods, in particular poultry (P. Ciucci, pers.
comm.), whose isotopic signature is confounded in our analysis with those of ants and fleshy fruits. Similarly,
another management bear (HS456), sampled by park wardens at a depredation event on poultry and beehives,
also showed high δ15N values, and this bear’s genotype is compatible with one of FP01’s cubs. On the contrary,
some non-management bears (e.g., M12 or F03) had the lowest δ15N values, indicating a consumption of natural
resources as confirmed by our mixing models. Nevertheless, being compounded by a large individual variability,
a small effect size, and a relatively large statistical uncertainty, the difference in isotopic signatures does not cur-
rently allow a reliable classification of the management status of individual bears, warranting further research
based on larger and more focused sampling.
Maintaining the long-term diversity and accessibility of foods to bears is a primary management goal for
the conservation of this endangered population. According to our and previous findings, habitat management
should aim to maintain abundance of mature stands of hard mast producing species, while ensuring the sustained
availability of other seasonal key f oods13. We suggest that productivity of ants should be also carefully considered
within forest and land habitat management practices, as they represent a key food especially for female bears,
therefore potentially impacting fertility and population productivity. We also stress the importance of facilitating
accessibility by bears in spring and early summer to lowland drainages that contain abundant grasses and forbs13.
Further studies should be conducted to better understand some unsolved aspects of the feeding ecology of
Apennine bears, and in particular the relative contribution of wild vs domestic ungulates or the contribution
Scientific Reports | (2021) 11:14118 | https://doi.org/10.1038/s41598-021-93507-y 10
Vol:.(1234567890)www.nature.com/scientificreports/
of other anthropogenic foods (i.e., poultry, beehives, crops). In addition, future SIA applications to this bear
population could benefit from enhanced statistical power by adding to mixing models covariates such as age and
body condition, by using additional tracers (e.g., δ34S25,40,50), by including a larger number of management bears
in the sample, and by adopting longer study periods to account for inter-annual variability in the productivity
of bear key foods.
Methods
Ethics statement. Protocols to collect bear samples and handling procedures were agreed with the PNALM
authority in accordance with international guidelines116, following official permits by the Italian Ministry of the
Environment. Similarly, plants and vegetal material were collected in accordance with the PNALM authority.
Study area. Our study area corresponds to the core distribution of the Apennine brown bear population,
including the National Park of Abruzzo Lazio and Molise (PNALM) and adjacent areas, located in the central
Apennines, Italy71 (Fig. 1). Elevation ranges from 400 to 2285 m and the terrain is typically mountainous with
Mediterranean mountain climate117. The area is mostly covered by deciduous forests (about 60%), followed by
subalpine meadows and grasslands, with crops nearby villages and mostly along valley bottom. Large ungulates
in the area comprise roe (Capreolus capreolus) and red deer (Cervus elaphus), wild boar (Sus scrofa), and Apen-
nine chamois (Rupicapra pyrenaica ornata). Livestock is also grazed at relatively high densities especially during
summer months. In addition to bears, wolves (Canis lupus) occur in the area118, and free-ranging dogs are occa-
sionally present. In the years of the study, the brown bear population was estimated at about 50 (95% CI 45–69)
bears, including c ubs54, and seemed to have remained stable during the past d
ecade119. Bears in the study area are
generally active from mid-March to the end of November, with differences in denning chronology depending on
gender and reproductive status of the females (modal dates: adult female bears 27 November; adult male bears
12 December; P. Ciucci, unpublished data).
Hair and key foods sampling. Bear hairs were collected during a non-invasive population survey con-
ducted in 201454. To this aim, a sampling grid (cells of 5 × 5 km) was overlaid to the study area and hair collec-
tion (May–October 2014) occurred through systematic hair-snagging53,55, complemented by additional sam-
pling methods (i.e., rub-tree sampling, opportunistic sampling at buckthorn patches, and incidental s ampling54;
Fig. 1). We defined a hair sample as a tuft of hairs with bulbs entangled in one set of b arbs53, which we assumed
belonged to the same bear, and collected each sample with gloves and sterilized surgical forceps to avoid con-
tamination. Each sample was stored in a paper envelope labelled with a uniquely numbered barcode and then
placed in a box with silica gel to prevent DNA degradation. From each sample, some hairs were then used for
genetics analyses by clipping a few millimetres of the hair root including the bulb54, whereas intact hairs were
used for stable isotope analyses. For the scope of the analysis, individual bears were further discriminated man-
agement bears, including a few bears known to be food conditioned or partly habituated to humans, from all
other bears (i.e., non-management bears). To obtain isotopic values of foods available to bears, we sampled key
foods consumed by Apennine bears at known bear foraging locations13, including (Table 1): (i) herbs, compris-
ing graminoids, forbs and sedges; (ii) wild fleshy fruits; (iii) cultivated fleshy fruit (i.e., peer, apples, prunes); (iv)
beechnuts (Fagus sylvatica) and acorns (Quercus spp.); (v) cultivated vegetables; (vi) ungulates, comprising wild
and domestic ungulates; (vii) ants (various species), and (viii) C4 plants, comprising cultivated corn. All food
samples were placed in plastic bags or tubes and stored at − 20 °C until treatment for SIA.
Laboratory procedures and hair sectioning. A total of 35 bear hairs were processed for SIA, and they
belonged to 27 different bears (16 females and 11 males). These included a few individuals known or suspected
to be food-conditioned on the basis of ancillary information such as telemetry or non-invasive genetic sampling
at damaged sites (Supplementary Table S1). We classified these bears as ’management bears’ (sensu Hopkins120),
as opposed to ‘non-management bears’ or bears of ‘unknown’ status (Supplementary Table S1).
Hairs were washed with a sonic bath in a 2:1 chloroform–methanol solution to remove surface oils and
impurities, and then dried at 60 °C in oven for at least 24 h17,22. Samples of bear key foods were freeze-dried
and ground to a fine homogeneous powder using a ball mill (Fritsch Mini-Mill Pulverisette 23). Hairs were
sectioned (see below), and all hair sections were singly weighed and closed into ultra-pure tin caps. Aliquots
of sampled bear key foods were weighed twice and pressed into ultra-pure tin capsules121,122. All samples were
analysed using a CN analyser (Vario Micro-Cube, Elementar Analysensysteme GmbH, Germany) coupled with
an isotope ratio mass spectrometer (IsoPrime100, Isoprime Ltd., Cheadle Hulme, UK). Stable isotope ratios
(13C:12C and 15N:14N) were expressed in delta notation (‰ deviation from international reference standards) in
accordance with the equation:
δR(‰) = [(RSAMPLE −RSTANDARD )/ RSTANDARD ] × 103 ,
where R is the heavy-to-light isotope ratio of the e lement123. The international standards were Vienna Pee Dee
Belemnite (VPDB) for C and atmospheric N 2 for N. The internal laboratory standard was IAEA-600 Caffeine.
Measurement errors were found to be typically smaller than ± 0.05 for both δ13C and δ15N. Elemental concentra-
tions were reported as % of the element on dry-weight.
To assign hairs (and their sections, see below) to their growth period, we assumed that fully grown hairs
sampled before the moult (i.e., end of June) were grown during the previous activity period (i.e., previous year
until dormancy), whereas hairs collected after the moult (i.e., end of August) were grown during the activity
period of the current sampling year20,21,40,43,60,61,64,65. We included in the analysis only hairs collected in June (pre
Scientific Reports | (2021) 11:14118 | https://doi.org/10.1038/s41598-021-93507-y 11
Vol.:(0123456789)www.nature.com/scientificreports/
moult) and September (post moult), and excluded those sampled in July and August (i.e., during the moult) due
to high uncertainty of their assignment. Starting from the root up to the tip of the hair, we cut guard-hairs with
a surgical scalpel into 15-mm sections, which we assumed to correspond approximately to the hair growth of 1
month40,61,62. Specifically, for fully-grown hairs sampled in June we assigned the basal 15-mm section to the last
month of growth before dormancy (November) in the previous year, the successive 15-mm section the month
before (October), and so on. Instead, the basal 15-mm section of hairs sampled in September was assigned to
the last month of growth before the actual sampling date, the successive 15-mm section to the month before
and so on. However, to account for the inherent uncertainty in the monthly growth rate of hair s ections40,60–62,
we conducted the analysis at a seasonal resolution by pooling 15-mm hair sections across dietary seasons. These
were defined based on the phenology of seasonal key foods for Apennine b ears13: Spring, including sections
whose growth was assigned to the months of March, April and May; Early summer, including sections assigned
to June and July; Late Summer, including section assigned to August and September; Autumn, including hair
sections assigned to October and November.
Data analysis. To compare isotopic values of bear key foods, and to examine relationships between isotopic
values and bear sex, season and year we used Analysis of Variance (ANOVA) followed by a post-hoc Tukey’s
HSD comparison test. All ANOVA models were tested for normality and homoschedasticy of residuals. Dietary
proportions of assimilated key bear foods were estimated using Stable Isotope Mixing Models (SIMMs)80. Bear
key food samples were a priori grouped into seven categories (Table 1) on the basis of their isotopic values and
according to prior dietary knowledge from the same bear population13. We ran four separate seasonal models,
with isotopic signatures of bear hairs as a mixture and isotopic signature of key-bear food categories as sources.
In the above models we excluded C4 plants because this source did not match the mixing space124.
For each seasonal set of models, we contemplated different covariate structure, including the null model: a
“Sex” model, with gender as a fixed effect; a “Status” model, with the management status as fixed effect; a “BearID”
model, with individual bear ID as a random effect, and the combinations “Sex + Status”, “Sex + BearID” and “Sta-
tus + BearID”. Since each set of models fit the same data, we performed model comparison using an information
criterion approach, namely the leave-one-out cross-validation (LOO), which is more robust compared to the
deviance information criterion (DIC), a generalization of the Akaike information criterion for Bayesian model
selection80,125. In addition, we also used Akaike weights, using LOOic scores, which provide an estimate of the
probability that one model will make the best predictions compared to the alternative models in the s et126. We
then selected models with the lowest LOO Information Criterion ( LOOic) and an Akaike weight > 20%80,127. Stable
carbon and nitrogen isotope Trophic Enrichment Factors (TEFs) were obtained from the l iterature24,28. Because
no study has accurately estimated the TEF of bear hairs, we used TEF values, expressed as Δ13C and Δ15N, esti-
mated from a feeding experiment on Norway rats28. Therefore, for vegetable resources we added to δ13C and δ15N
TEF values of Δ13C = 3.4 ± 0.5‰ and Δ15N = 2.4 ± 0.2‰, respectively, and for animal foods Δ13C = 2.1 ± 0.2‰ and
Δ15N = 3.9 ± 0.3‰, respectively. To calculate the mixing space, we considered the digestible elemental concentra-
tion of C and N (Supplementary Table S3) to avoid the bias introduced in dietary estimation by differences in
stoichiometry and digestibility of food sources28,128,129. The efficiency of SIMMs is related to the number of sources
and it decreases when the number of sources is greater than the number of tracers/isotopes plus one130, or when
the isotopic distance of sources in the mixing space is low130. Therefore, to improve the SIMMs accuracy and
precision, we incorporated “a priori” dietary knowledge on this bear population as informative priors. Specifi-
cally, for each season we used as priors the estimated digestible energy content (EDEC%) based on the analysis
of 2359 scats collected from the same bear population from June 2006 to December 2 00913 (Table 2). Before
running the models, the adequacy of the mixing spaces (consumers, resources, and TEF data) was evaluated and
validated using simulated mixing polygons and all values outside the 95% mixing region were excluded from
the models124. For all SIMMs models, we ran three Markov Chain Monte Carlo chains of 300,000 iteration each
with a burn-in of 200,000 and a thinning rate of 100 iteration. Each model was checked for chains convergence
by visual inspection of trace-plot and using the Gelman-Rubin and the Geweke diagnostic test.
Results of mixing models were reported as means of estimated dietary proportion with their associated
standard deviations and 95% credible intervals (CI). All statistical analyses and stable isotope mixing models
were performed using R version 4.0.3131 and the R package MixSIAR80,127. Unless otherwise specified, all values
in the text were reported as mean values ± standard deviation.
Received: 15 March 2021; Accepted: 24 June 2021
References
1. Robbins, C. T. & Cunha, T. J. Wildlife Feeding and Nutrition (Elsevier Science, 2014).
2. Murray, M. H., Becker, D. J., Hall, R. J. & Hernandez, S. M. Wildlife health and supplemental feeding: A review and management
recommendations. Biol. Conserv. 204, 163–174 (2016).
3. Barboza, P. S., Parker, K. L., & Hume, I. D. Integrative Wildlife Nutrition (Springer, 2009).
4. Nyhus, P. J. Human-wildlife conflict and coexistence. Annu. Rev. Environ. Resour. 41, 143–171 (2016).
5. Baynham-Herd, Z., Redpath, S., Bunnefeld, N. & Keane, A. Predicting intervention priorities for wildlife conflicts. Conserv. Biol.
34, 232–243 (2020).
6. Treves, A. & Santiago-Ávila, F. J. Myths and assumptions about human-wildlife conflict and coexistence. Conserv. Biol. 34,
811–818 (2020).
7. Bojarska, K. & Selva, N. Spatial patterns in brown bear Ursus arctos diet: The role of geographical and environmental factors:
Biogeographical variation in brown bear diet. Mammal Rev. 42, 120–143 (2012).
Scientific Reports | (2021) 11:14118 | https://doi.org/10.1038/s41598-021-93507-y 12
Vol:.(1234567890)www.nature.com/scientificreports/
8. Kavčič, I. et al. Fast food bears: Brown bear diet in a human-dominated landscape with intensive supplemental feeding. Wildl.
Biol. 21, 1–8 (2015).
9. Cozzi, G. et al. Anthropogenic food resources foster the coexistence of distinct life history strategies: Year-round sedentary and
migratory brown bears. J. Zool. 300, 142–150 (2016).
10. Lewis, D. L. et al. Foraging ecology of black bears in urban environments: Guidance for human-bear conflict mitigation. Ecosphere
6, art141 (2015).
11. Naves, J., Fernández-Gil, A., Rodríguez, C. & Delibes, M. Brown bear food habits at the border of its range: A long-term study.
J. Mammal. 87, 899–908 (2006).
12. Rodríguez, C., Naves, J., Fernández-Gil, A., Obeso, J. R. & Delibes, M. Long-term trends in food habits of a relict brown bear
population in northern Spain: The influence of climate and local factors. Environ. Conserv. 34, 36–44 (2007).
13. Ciucci, P., Tosoni, E., Di Domenico, G., Quattrociocchi, F. & Boitani, L. Seasonal and annual variation in the food habits of
Apennine brown bears, central Italy. J. Mammal. 95, 572–586 (2014).
14. Reynolds-Hogland, M. J., Pacifici, L. B. & Mitchell, M. S. Linking resources with demography to understand resource limitation
for bears: Linking resources and demography. J. Appl. Ecol. 44, 1166–1175 (2007).
15. Robbins, C. T., Schwartz, C. C. & Felicetti, L. A. Nutritional ecology of ursids: A review of newer methods and management
implications. Ursus 15, 161–171 (2004).
16. Can, Ö. E., D’Cruze, N., Garshelis, D. L., Beecham, J. & Macdonald, D. W. Resolving human-bear conflict: A global survey of
countries, experts, and key factors: Human-bear conflict. Conserv. Lett. 7, 501–513 (2014).
17. Hobson, K. A., McLellan, B. N. & Woods, J. G. Using stable carbon (δ 13C) and nitrogen (δ 15N) isotopes to infer trophic relation-
ships among black and grizzly bears in the upper Columbia River basin, British Columbia. Can. J. Zool. 78, 1332–1339 (2000).
18. Mowat, G. & Heard, D. C. Major components of grizzly bear diet across North America. Can. J. Zool. 84, 473–489 (2006).
19. Ben-David, M., Titus, K. & Beier, L. R. Consumption of salmon by Alaskan brown bears: A trade-off between nutritional require-
ments and the risk of infanticide?. Oecologia 138, 465–474 (2004).
20. Hopkins, J. B. et al. Stable isotopes to detect food-conditioned bears and to evaluate human-bear management. J. Wildl. Manag.
76, 703–713 (2012).
21. Hata, A. et al. Stable isotope and DNA analyses reveal the spatial distribution of crop-foraging brown bears. J. Zool. 303, 207–217
(2017).
22. Hilderbrand, G. V., Jenkins, S. G., Schwartz, C. C., Hanley, T. A. & Robbins, C. T. Effect of seasonal differences in dietary meat
intake on changes in body mass and composition in wild and captive brown bears. Can. J. Zool. 77, 1623–1630 (1999).
23. Rode, K. D., Farley, S. D. & Robbins, C. T. Sexual dimorphism, reproductive strategy, and human activities determine resource
use by brown bears. Ecology 87, 2636–2646 (2006).
24. Hilderbrand, G. V. et al. Use of stable isotopes to determine diets of living and extinct bears. Can. J. Zool. 74, 2080–2088 (1996).
25. Murray, M. H., Fassina, S., Hopkins, J. B., Whittington, J. & St. Clair, C. C. Seasonal and individual variation in the use of rail-
associated food attractants by grizzly bears (Ursus arctos) in a national park. PLoS ONE 12, e0175658 (2017).
26. Mizukami, R. N., Goto, M., Izumiyama, S., Hayashi, H. & Yoh, M. Estimation of feeding history by measuring carbon and
nitrogen stable isotope ratios in hair of Asiatic black bears. Ursus 16, 93–101 (2005).
27. Mizukami, R. N. et al. Temporal diet changes recorded by stable isotopes in Asiatic black bear (Ursus thibetanus) hair. Isotopes
Environ. Health Stud. 41, 87–94 (2005).
28. Hopkins, J. B. & Kurle, C. M. Measuring the realized niches of animals using stable isotopes: From rats to bears. Methods Ecol.
Evol. 7, 210–221 (2016).
29. Layman, C. A. et al. Applying stable isotopes to examine food-web structure: An overview of analytical tools. Biol. Rev. 87,
545–562 (2012).
30. Careddu, G., Calizza, E., Costantini, M. L. & Rossi, L. Isotopic determination of the trophic ecology of a ubiquitous key spe-
cies—The crab Liocarcinus depurator (Brachyura: Portunidae). Estuar. Coast. Shelf Sci. 191, 106–114 (2017).
31. Blasi, M. F. et al. Assessing resource use patterns of Mediterranean loggerhead sea turtles Caretta caretta (Linnaeus, 1758)
through stable isotope analysis. Eur. Zool. J. 85, 71–87 (2018).
32. Cicala, D. et al. Spatial variation in the feeding strategies of Mediterranean fish: Flatfish and mullet in the Gulf of Gaeta (Italy).
Aquat. Ecol. 53, 529–541 (2019).
33. Bearhop, S., Adams, C. E., Waldron, S., Fuller, R. A. & Macleod, H. Determining trophic niche width: A novel approach using
stable isotope analysis: Stable isotopes as measures of niche width. J. Anim. Ecol. 73, 1007–1012 (2004).
34. Newsome, S. D., Martinez del Rio, C., Bearhop, S. & Phillips, D. L. A niche for isotopic ecology. Front. Ecol. Environ. 5, 429–436
(2007).
35. Hopkins, J. B. & Ferguson, J. M. Estimating the diets of animals using stable isotopes and a comprehensive Bayesian mixing
model. PLoS ONE 7, e28478 (2012).
36. Phillips, D. L. Converting isotope values to diet composition: The use of mixing models. J. Mammal. 93, 342–352 (2012).
37. Madeira, F. et al. Stable carbon and nitrogen isotope signatures to determine predator dispersal between alfalfa and maize. Biol.
Control 77, 66–75 (2014).
38. García-Vázquez, A., Pinto-Llona, A. C. & Grandal-d’Anglade, A. Brown bear (Ursus arctos L.) palaeoecology and diet in the Late
Pleistocene and Holocene of the NW of the Iberian Peninsula: A study on stable isotopes. Quat. Int. 481, 42–51 (2018).
39. Hilderbrand, G. V. et al. The importance of meat, particularly salmon, to body size, population productivity, and conservation
of North American brown bears. Can. J. Zool. 77, 132–138 (1999).
40. Felicetti, L. A. et al. Use of sulfur and nitrogen stable isotopes to determine the importance of whitebark pine nuts to Yellowstone
grizzly bears. Can. J. Zool. 81, 763–770 (2003).
41. Schwartz, C. C. et al. Use of isotopic sulfur to determine whitebark pine consumption by Yellowstone bears: A reassessment.
Wildl. Soc. Bull. 38, 664–670 (2014).
42. Hopkins, J. B., Koch, P. L., Ferguson, J. M. & Kalinowski, S. T. The changing anthropogenic diets of American black bears over
the past century in Yosemite National Park. Front. Ecol. Environ. 12, 107–114 (2014).
43. Bentzen, T. W., Shideler, R. T. & O’Hara, T. M. Use of stable isotope analysis to identify food-conditioned grizzly bears on Alaska’s
North Slope. Ursus 25, 14 (2014).
44. Teunissen van Manen, J. L., Muller, L. I., Li, Z., Saxton, A. M. & Pelton, M. R. Using stable isotopes to assess dietary changes of
American black bears from 1980 to 2001. Isotopes Environ. Health Stud. 50, 382–398 (2014).
45. Braunstein, J. L., Clark, J. D., Williamson, R. H. & Stiver, W. H. Black bear movement and food conditioning in an exurban
landscape. J. Wildl. Manag. 84, 1038–1050 (2020).
46. Narita, R., Mano, T., Yokoyama, R. & Takayanagi, A. Variation in maize consumption by brown bears (Ursus arctos ) in two
coastal areas of Hokkaido, Japan. Mammal Study 36, 33–39 (2011).
47. Matsubayashi, J., Morimoto, J., Mano, T., Aryal, A. & Nakamura, F. Using stable isotopes to understand the feeding ecology of
the Hokkaido brown bear (Ursus arctos) in Japan. Ursus 25, 87–97 (2014).
48. Javornik, J. et al. Effects of ethanol storage and lipids on stable isotope values in a large mammalian omnivore. J. Mammal. 100,
150–157 (2019).
49. Pauli, J. N., Whiteman, J. P., Riley, M. D. & Middleton, A. D. Defining noninvasive approaches for sampling of vertebrates.
Conserv. Biol. 24, 349–352 (2010).
Scientific Reports | (2021) 11:14118 | https://doi.org/10.1038/s41598-021-93507-y 13
Vol.:(0123456789)You can also read