GAUTENG PROPERTY TOUR - Investor information 02 August 2018 - Exemplar REIT
←
→
Page content transcription
If your browser does not render page correctly, please read the page content below
GAUTENG
PROPERTY TOUR
Investor information
02 August 2018
INTRODUCTION
Niche market focus
 • Exemplar is focused on dominant retail property in under-serviced, peri-
    urban township and rural areas
 • Established and less cyclical consumer spending patterns in this segment
 • Have accumulated strong, unrivalled knowledge of this retail market and
    opportunity
 • Established partnership model with local communities and BEE investors
    at an asset level
 • In partnerships with established REITs in its large, flagship properties

Investment strategy and growth
  • Sustainable income growth, supported by natural population growth, rural-
    urban migration and consumer spending growth
  • Retail centres underpinned by defensive, non-discretionary consumer
    retail spend

Strong internal management
 • Experienced executive directors and management team
 • Cumulative 238 years of employment with MPD prior to listing
 • High familiarity with property portfolio and market segment

Relationship with MPD
 • Strong pipeline of secured development opportunities through MPD
 • First right of refusal on properties developed by MPD
 • All the properties in the Exemplar portfolio have been developed by MPD
 • Have already undertaken to acquire three properties currently being
    developed by MPD
 • 35 year history within this market segment
 • MPD has successfully completed 62 developments, with 3 more to be
    completed in 2018

   2
EXECUTIVE MANAGEMENT TEAM
       Jason McCormick                                     Duncan Church                          John McCormick

 Chief Executive Officer                             Chief Financial Officer                     Executive Director

                                                                                                 Post an MBA at Stanford University,
Jason joined McCormick Property                      Duncan completed his articles at PKF
                                                                                                 John commenced his career in the
Development in 2002 and was                          (Jhb) Inc before becoming a partner in      USA at real estate company WM Lyon
appointed GM Business Development in                 2004 at which time he was also              Development. In 1973 he returned to
2008, sourcing, securing and                         appointed Head of Corporate Finance.        South Africa and joined Kirsh
                                                     During his time at PKF and later at         Industries. Thereafter, he held various
developing 18 of the 23 properties in
                                                                                                 senior positions at Metro Cash and
the Exemplar property portfolio. He has              Grant Thornton he acted as the
                                                                                                 Carry, Southern Sun Hotels and finally
been Managing Director of MPD since                  reporting accountant in the listing of      World Furnishers as CFO. He saw the
2011 and oversaw the MPD portfolio                   numerous companies, including several       dire need for full-service retail in then
                                                     property funds. He provided advisory        under-serviced rural areas. In 1983 he
grow from 6 shopping centres totalling
                                                                                                 founded McCormick Property
83,000sqm GLA in 2002 to 27 centres                  services to various listed property funds
                                                                                                 Development, a business which he has
totalling 523,977sqm GLA prior to listing in 2018.   as well as many other non-property          been instrumental in to the present day.
                                                     sector listed and private companies.

 3
4
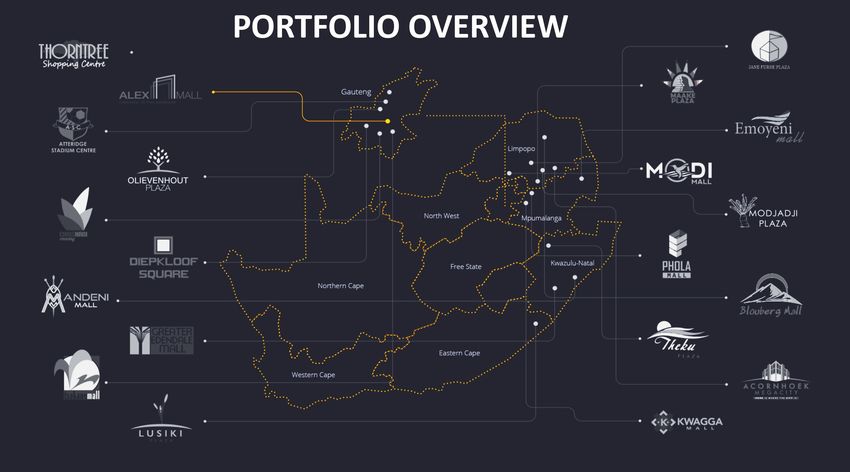
PORTFOLIO OVERVIEW (CONT.)
       Top 10 tenants(ii)                                                                       % of rent   Geographic spread(i)
                                                                                                            % of leased area
                                                                                                    12%                                         Eastern Cape
                                                                                                                                    Limpopo          4%
                                                                                                                                      16%
                                                                                                     5%
                                                                                                                                                                                Gauteng
                                                                                                                                                                                 42%
                                                                                                     4%

                                                                                                     3%                Mpumalanga
                                                                                                                          23%

                                                                                                     3%
                                                                                                                                                                       Kwazulu-Natal
                                                                                                                                                                           15%

                                                                                                     3%     Lease expiry profile(i)
                                                                                                            By revenue
                                                                                                     2%                                                                                   35.0%

                                                                                                     2%
                                                                                                                          20.7%                                20.5%

                                                                                                     2%
                                                                                                                                              12.8%
                                                                                                                                                                               10.7%

                                                                                                     2%
                                                                                                              0.3%

       Total of Top 10                                                                              38%      Monthly       2019               2020             2021             2022      Beyond

(i)      As at 1 June 2018
(ii)     As at August 2018. National tenants comprise c.85% of total tenants by gross rentals

          5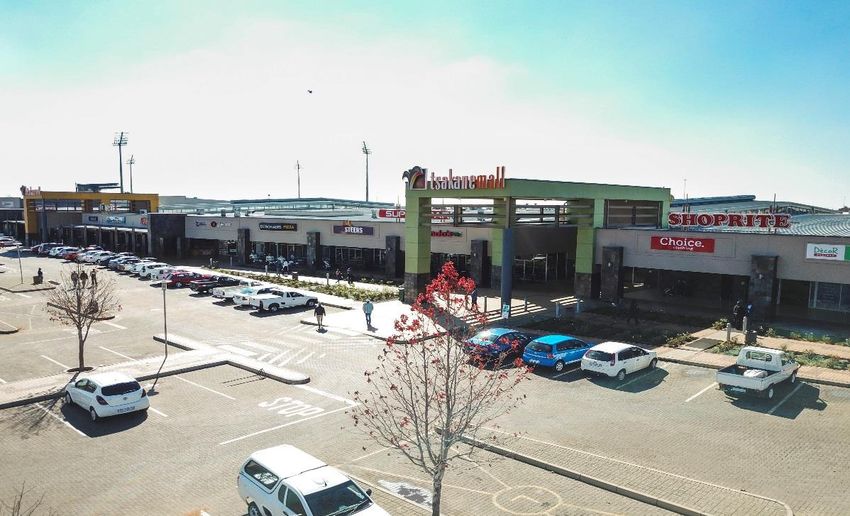
FINANCIAL OVERVIEW
 Summarised consolidated forecast                                Reconciliation to distributable income
                                      9 months                                                                                      9 months
                                        ending    Year ending                                                                         ending                Year ending
R’000                                 Feb 2019      Feb 2020    R’000                                                               Feb 2019                  Feb 2020
Rental income and recoveries           510 088        777 127   Profit for the year attributable to shareholders                      191 585                   296 271

Straight-line adjustments               37 770         30 282   Change in fair values of investment properties                          37 770                   30 282

Rental revenue                         547 858        807 409   Headline earnings                                                     229 355                   326 553

Property operating expenses           (180 669)     (279 329)   Straight-line lease revenue adjustments                               (37 770)                 (30 282)

Administrative expenses                (23 041)      (32 550)   Antecedent adjustment                                                    4 641                    3 564

Other income                             8 309         11 924   Distributable income                                                  196 226                   299 835

Profit from operations                 352 457        507 454   Shares in issue (‘000)                                                319 739                   328 508

Fair value adjustments                 (37 770)      (30 282)   DPS (cents)                                                              61.37                    91.27

Finance costs                         (128 263)     (191 018)   Yield*                                                                    8.2%

Finance income                          11 764         20 290   * Assuming a NAV of R10.00 per share and implied annualised DPS of 61.37c x 12/9 = 81.83c

Profit for the year                    198 188        306 444

Total profit attributable to:

         Equity holders of Exemplar    191 585        296 271

         Non-controlling interests       6 603         10 173

  6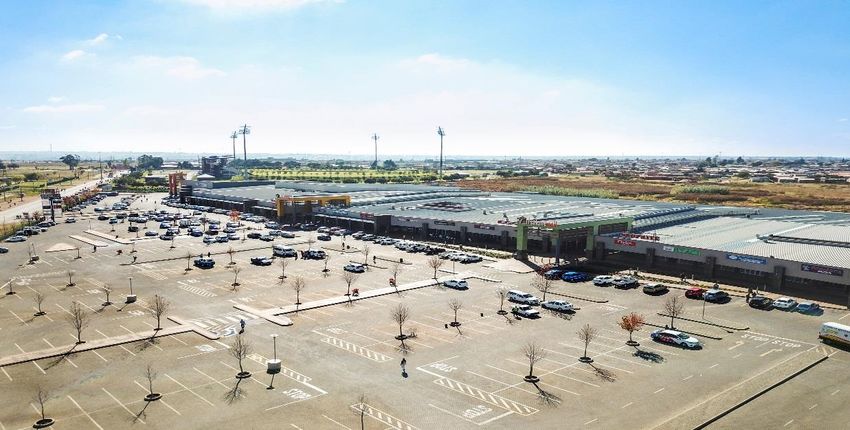
FINANCIAL OVERVIEW (CONT.)
 Summarised consolidated pro-forma balance
 sheet (pre-new developments)
R’000                                               Pro forma
                                              (i)
Investment property and operating lease asset       4 907 843
Other non-current assets                                9 781
Current assets                                        261 376
            Trade and other receivables                40 906
            Cash and cash equivalents                 139 219
            Financial assets                           81 251

Total Assets                                        5 179 000

Stated capital                                      3 007 955
Non-controlling interests                             122 290
Interest-bearing liabilities                        1 851 948
Other non-current liabilities                          82 322
Current liabilities                                   114 485
Equity and liabilities                              5 179 000

Shares in issue (‘000)                                305 872
NAV and TNAV per share (R)                               9.83
LTV                                                    37.7%
      (i)     Valuation date: 1 December 2017
  7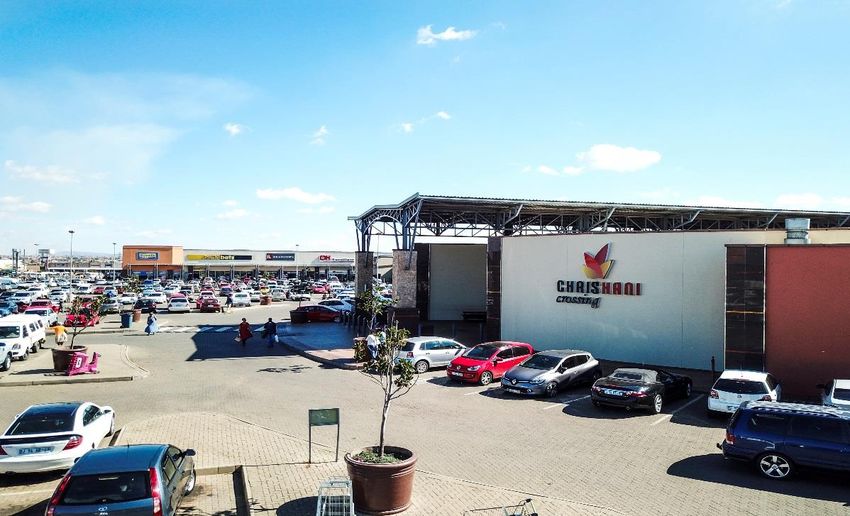
GROWTH AND PROSPECTS
Growth will primarily be achieved organically through escalations embedded in the portfolio, active asset management and the benefits of
gearing
Additional growth to be achieved through acquisition of yield enhancing assets with metrics consistent with those of existing portfolio
The company has a first right of first refusal on a secured development pipeline of over 500 000m 2 GLA through its relationship with MPD
− MPD has a secured pipeline of 26 strategically-located greenfield development properties which are mostly at an advanced stage of
planning/approval. Upon development completion, if bought into Exemplar, such assets will entrench Exemplar as the dominant player
in this market segment.
There are three development properties, currently being developed by MPD, which Exemplar has undertaken to acquire on completion:
− Katale Square near Rust de Winter, Mpumalanga. Expected to be completed in April 2019
− Mabopane Plaza in Mabopane, Gauteng. Expected to be completed in September 2019
− Riba Cross Mall in Mpumalanga. Expected to be completed in October 2019
− Total value on completion of R455 million
Developments will be yield accretive
8
OLIEVENHOUT PLAZA
Valuation (100%) R267 million
GLA (m2)(i) 17 111
Occupancy(ii) 100%
Investment highlights
Weighted ave. rental (R /m2 / month)(ii) 128
WALE (years)(iii) 1.8
Trading density (R/m2)(iv) 39 504 per annum
Rent-to-sales(iv) 2.9%
Catchment area(v) 15 030 households
Footfall N/A – open centre
Number of stores 54
Parking bays 653
Lease expiry profile
Developed in 2013 at the same time as Forest Hill City and as such lacked traction By revenue
with the fashion component which supported the larger national scheme across the
N14 highway, approx. 4KM’s away 53%
As such, the centre was developed as an ‘open boulevard’ which allowed for
conversion into a fully enclosed mall on redevelopment and re-tenanting with national
26%
fashion
13%
7%
0% 1%
(i) Represents total centre GLA. Exemplar owns 100% of the shopping centre.
Monthly 2019 2020 2021 2022 Beyond
(ii) As at 1 July 2018
(iii) Based on revenue. As at 1 June 2018
(iv) Based on top 5 tenants as some tenants do not report turnover consistently
(v) As per Fernridge study, January 2011
9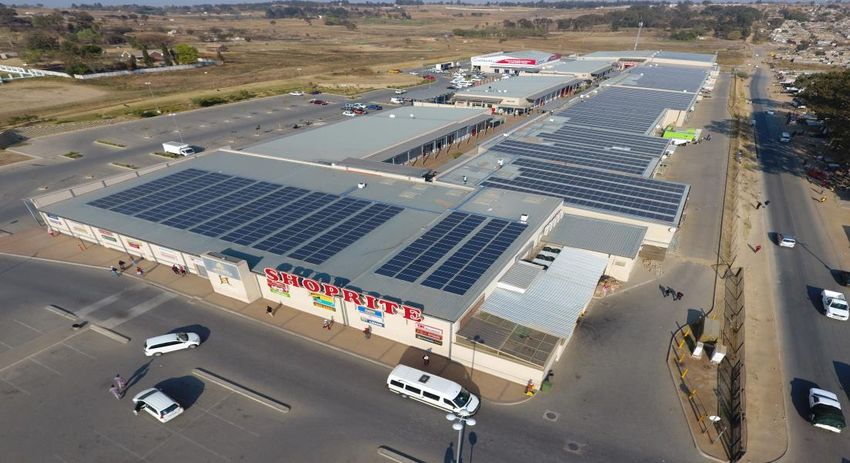
OLIEVENHOUT PLAZA (CONT.)
Rights of 20 000sqm GLA in place; therefore the potential expansion
and redevelopment opportunity provides significant upside to Exemplar
shareholders upon re-tenanting the redevelopment
Pilot PV system installed with over one year of data supporting the
investment case for roll out across the portfolio
Key tenants
Retail mix
% of leased area
Vacant Butchery Cellphones
Services 0% 5% 1%
Supermarket 2%
18%
Fashion &
Shoe retail
26%
Speciality
18%
Fast food &
Restaurant
3%
Liquor
Financial
3%
services
Household Health &
6%
goods beauty
15% 3%
10DIEPKLOOF SQUARE
Valuation (100%) R272 million
GLA (m2)(i) 15 778
Occupancy(ii) 100%
Investment highlights
Weighted ave. rental (R /m2)(ii) 137
WALE (years)(ii) 7.1
Trading density (R/m2)(iv) 40 170 per annum
Rent-to-sales(iv) 3.2%
Catchment area 58 379 households
Footfall N/A
Number of stores 48
Parking bays 600
Lease expiry profile
Situated in one of the highest income suburbs in Gauteng townships and location of
‘Millionaires Mile’ makes this the ‘Beverley Hills’ of Soweto
By revenue
58%
High focus on food and restaurants for higher income segment (10%) and on non-
discretionary grocery spend (37%) with Pick n Pay, Food Lovers Market and Roots catering
across all income levels
18%
12%
8%
4%
0%
Monthly 2019 2020 2021 2022 Beyond
(i) Represents total centre GLA. Exemplar owns 100% of the shopping centre.
(ii) As at 1 June 2018
(iii) Based on revenue. As at 1 June 2018
(iv) Based on top 5 tenants as some tenants do not report turnover consistently
11DIEPKLOOF SQUARE (CONT.)
Key tenants
Retail mix
% of leased area
Vacant Butchery Cellphones
Services
0% 6% 1%
2%
Supermarket Fashion & Shoe
31% retail
12%
Fast food &
Restaurant
10%
Financial
services
Health & beauty 8%
Speciality 6%
17% Household
Liquor goods
2% 5%
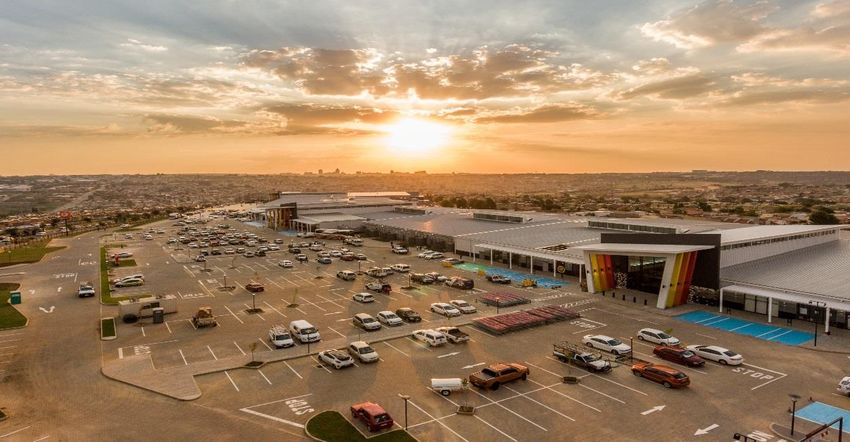
12CHRIS HANI CROSSING
Valuation (100%) R930 million
GLA (m2)(i) 40 546
Occupancy(ii) 100%
Investment highlights
Weighted ave. rental (R /m2)(ii) 159
WALE (years)(iii) 2.4
Trading density (R/m2)(iv) 42 046 per annum
Rent-to-sales(iv) 3.0%
Catchment area(v) 185 190 households
Footfall(vi) 785 007 per month
Number of stores 112
Parking bays 1 866
Flagship shopping centre in the Exemplar portfolio, owned in joint partnership with
Lease expiry profile
Redefine Properties By revenue
57%
Redevelopment / upgrade in the asset management plans for the property
Built on the most prominent site in Kathlehong / Vosloorus area with two offramps
converging at the intersection at the shopping centre to cross the Natalspruit and thus
serving both Vosloorus and Kathlehong 15% 13% 11%
4%
0%
(i) Represents total centre GLA. Exemplar owns a 50% undivided share in the shopping centre.
(ii) As at 1 June 2018 Monthly 2019 2020 2021 2022 Beyond
(iii) Based on revenue. As at 1 June 2018
(iv) Based on top 5 tenants as some tenants do not report turnover consistently
(v) As of date of initial feasibility study, being 31 August 2009
(vi) Avg. for 12 months June 17 – June 18
13CHRIS HANI CROSSING (CONT.)
The shopping centre had the most successful opening day for
McDonald’s at the time of opening in November 2010
Key tenants
Retail mix
% of leased area
Services Vacant Butchery
3% 0% 2% Cellphones
1%
Fashion &
Shoe retail
Supermarket
33%
31%
Speciality Fast food &
6% Restaurant
4%
Liquor Financial
1% Household Health & services
goods beauty 9%
7% 3%
14TSAKANE MALL
Valuation (100%) R770 million
GLA (m2)(i) 39 354
Occupancy(ii) 100%
Investment highlights
Weighted ave. rental (R /m2)(ii) 135
WALE (years)(iii) 1.6
Trading density (R/m2)(iv) 38 281
Rent-to-sales(iv) 2.8%
Catchment area(v) 187 076 households
Footfall N/A
Number of stores 121
Parking bays 1 645
Centrally located for the entire Kwatsaduza region Lease expiry profile
By revenue
Market Research (conducted in 2018) shows area demographics warrant an estimated
60%
total of 45 961 m2 GLA at a capture rate of 12%
Leasing of phase 2 (85% owned by MPD) currently underway
Additional redevelopment and expansion can accommodate a further 24 631m 2 of
GLA without any structured parking 13%
9% 10%
5%
2%
(i) Represents total centre GLA. Exemplar owns a 50% undivided share in the shopping centre.
Monthly 2019 2020 2021 2022 Beyond
(ii) As at 1 June 2018
(iii) Based on revenue. As at 1 June 2018
(iv) Based on top 5 tenants as some tenants do not report turnover consistently
(v) As per Fernridge study, May 2018
15TSAKANE MALL (CONT.)
Key tenants
Retail mix
% of leased area
Vacant Butchery
Services 0% 2% Cellphones
3% 1%
Fashion &
Supermarket Shoe retail
31% 33%
Fast food &
Restaurant
Speciality
4%
6%
Liquor
1% Household Health & Financial
goods beauty services
7% 3% 9%
16ALEX MALL
Valuation (100%) R502 million
GLA (m2)(i) 29 565
Occupancy(ii) 97%
Investment highlights
Weighted ave. rental (R /m2)(ii) 132
WALE (years)(iii) 5.6
Trading density(iv) 27 908
Rent-to-sales(iv) 4.4%
Catchment area(v) 62 693 households
Footfall(vi) 901 690 per month
Number of stores 97
Parking bays 1 348
Gateway to Alex from the N3
Lease expiry profile
Only significant formal retail on the ‘East Bank’ of Alex, whose income levels exceed By revenue
those of the “West Bank” 75%
Expansion of 45 000 sqm GLA planned ITO the design
Additional tenants: Standard Bank and ABSA
20%
(i) Represents total centre GLA. Exemplar owns 100% of the shopping centre
(ii) As at 1 June 2018
(iii) Based on revenue. As at 1 June 2018 1% 3% 1%
0%
(iv) Based on top 5 tenants as some tenants do not report turnover consistently
(v) As per Fernridge study, April 2014 Monthly 2019 2020 2021 2022 Beyond
(vi) Avg. for 12 months June 17 – June 18
17ALEX MALL (CONT.)
Key tenants
Retail mix
% of leased area
Vacant Butchery
Services 5% 3% Cellphones
3% 0%
Supermarket Fashion &
19% Shoe retail
33%
Speciality
11% Fast food &
Restaurant
6%
Liquor
3% Financial
Household
services
goods Health & beauty
5% 4%
8%
18DELIVERING TO OUR CUSTOMERS NEEDS 19
THANK
     YOU

20
You can also read