Shopping by bike: beSt friend of your city centre - Cycling and Local Economies www.ecf.com - European Cyclists' Federation
←
→
Page content transcription
If your browser does not render page correctly, please read the page content below
Shopping by bike: Best
friend of your city centre
Cycling and Local Economies

                                                                  www.ecf.com

              Shopping by bike: Best friend of your city centre
                                                                                1
Shopping by bike: Best friend of your city centre
2
Shopping
                                 by bike:
                                 Best friend
                                 of your
                                 city centre

Shopping by bike: Best friend of your city centre
                                                    3
© Sam Saunders

                      Acknowledgements

                 Responsible editor
                 European Cyclists’ Federation
                 Rue Franklin 28
                 B-1000 Brussels

                 Authors
                 Holger Haubold
                 Fiscal and Economic Policy Officer
                 h.haubold@ecf.com

                 ECF gratefully acknowledges financial support from the European Commission.
                 Reproduction is authorized provided the source is acknowledged.

                 About the European Cyclists’ Federation
                 ECF is the umbrella federation of bicycle users’ organisations in Europe and beyond. Our aim is to have more people
                 cycling more often and we target to double cycling by 2020 in Europe. To reach this goal, we work with our members
                 and partners on putting cycling on the agenda at global, European, national and regional level.

                                                                  Shopping by bike: Best friend of your city centre
                  4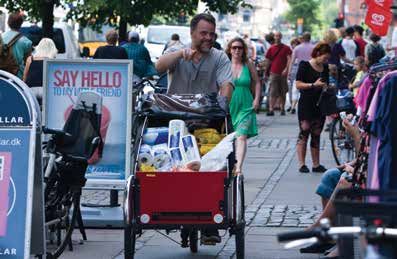
Main findings

Cycling delivers major economic benefits in the EU: For example, the health benefits due to reduced mortality amount to 114-121
billion EUR, or the benefits of congestion easing to ca. 25 billion EUR. Cycling also creates jobs: At current levels of cycling, more
than 650 000 jobs in the EU 1 are linked to the sector. If cycling modal share was doubled, more than 400 000 extra jobs could be
created 2.

Many of the economic benefits of cycling that have been quantified until now are reaped at the national level, and it is important
to underline those benefits as arguments for ambitious European and national cycling policies and investments in cycling.
However, finding the right arguments the local level also remains crucial: This is where the funding is spent and concrete decisions
on cycling-friendly transformations of certain streets are made. At this level, there sometimes still is a lot of uncertainty about the
benefits of cycling, and local retailers often fear that they would lose customers and turnover if more space is given to cyclists and
pedestrians and less space to cars in their streets.

                                          At the
The aim of this report is to show that these  fearsmoment,  customers
                                                    are unfounded.     going
                                                                   We first    shopping
                                                                            show that customers going shopping by bike are an
important source of turnover in retail, and could actually be a source of growth for the local retail sector, especially in city centres,
if we reach our goal of doubling the modal share of cycling. By using an earlier study from Austria, we estimate the following
impact of cycling on retail in the EU:by bike account                  for a consumption volume

                                                                 111
                                                            At the   billion
                                                                   moment,    EUR in
                                                                           customers    theshopping
                                                                                     going   EU-28.

                                                     by bike account                                     for a consumption volume

                                                                    111 billion EUR in the EU-28.

                                                                                                                                               2
                                                  If the modal share of cycling was doubled

                                          in the EU (excluding Croatia), this would generate an increase
                                                      in retail turnover for local retailers of more than                                      2
                                                If the modal share  27of billion   EUR
                                                                         cycling was   doubled
                                               This would give an economic boost to city centres,
                                          in the EU (excluding Croatia), this would generate an increase
                                                              towns and villages all over Europe.
                                                    in retail turnover for local retailers of more than
                                                                               27 billion EUR
                                      This would
                         Local case studies fromgive an economic
                                                  Europe           boost to
                                                         and elsewhere      cityshow
                                                                          also   centres,
                                                                                      that:
                                                 towns and villages all over Europe.

                         • Clients coming by bike spend more than those coming by car, be it during a certain time period or related to the
                         parking space that has to be provided for them. Car drivers might spend more per visit, but they visit shops less
                         often. Cyclists do their shopping locally, and are more loyal customers.

                         • Retailers often under-estimate the share of clients that go shopping by bike, and over-estimate the share of car
                         users among their customers.

                         • If a street is transformed in a way that gives more space to cyclists and pedestrians and less to cars, the
                         absence of clients that came by car before is more than compensated for by the clients that come by foot or
                         by bike afterward.

1. ECF, 2013: Calculating the economic benefits of cycling in EU-27. http://www.ecf.com/wp-content/uploads/ECF_Economic-benefits-of-cycling-in-EU-27.pdf
2. ECF, 2014: Cycling Works – Jobs and Job Creation in the Cycling Economy. http://www.ecf.com/europeancyclingjobs/

                                                                  Shopping by bike: Best friend of your city centre
                                                                                                                                                           5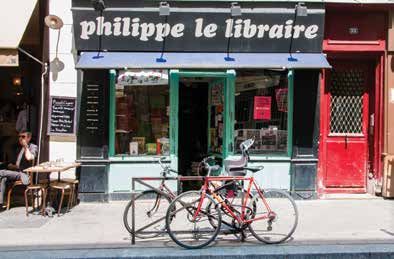
Overview of other studies on cycling and local retail

                                1. Copenhagen

                                                                           • In Copenhagen, cyclists create more revenue in
© CColville-Andersen

                                                                           shops and supermarkets than car drivers (2.05 billion
                                                                           EUR for cyclists, 2.04 billion EUR for car drivers).
                                                                           > Study conducted by the City of Copenhagen on the link between shopping
                                                                           and transport mode (2013).
                                                                           http://www.cycling-embassy.dk/2013/08/26/are-cyclists-good-customers/

                                  2. BRISTOL

                                                                           • In Bristol, retailers overestimated the share of
                                                                           car-drivers among their costumers by almost 100
                                                                           per cent: In a survey, they stated that 41 per cent of
                                                                           costumers would come by car, while the actual value
                                                                           was only at 22 per cent. For cycling, it was the other
                                                                           way round: Shopkeepers estimated the share of
                                                                           cyclists among their customers at 6 per cent, while
                                                                           the actual share was 10 per cent. Shopkeepers also
                                                                           overestimated the distances customers would travel
                                                                           to their shops: They thought that only 12 per cent of
                                                                           clients would live less than half a mile from the shop,
                                                                           while the real value was 42 per cent.
© Sam Saunders

                                                                           > Shoppers and how they travel (2006), Information sheet by Sustrans.
                                                                           http://www.tut.fi/verne/wp-content/uploads/Shoppers-and-how-they-travel.
                                                                           pdf

                                  3. FRANCE

                                                                           • In France, a survey in 6 cities found that cyclists
                                                                           spend more money per week in shops than car
                                                                           drivers (24.35 EUR for cyclists, 21.65 EUR for car
                                                                           drivers). They spend less money per visit, but
                                                                           visited shops more often.
                                                                           > Brichet, Heran: Commerces de centre-ville et de proximité et modes non
© Mitch Altman

                                                                           motorisés . Publication ADEME n°4841 (2003).
                                                                           http://www.weekvandemobiliteit.be/system/files/bijlagen/velocom-
                                                                           merce_2003_rapfin.pdf

                                                Shopping by bike: Best friend of your city centre
6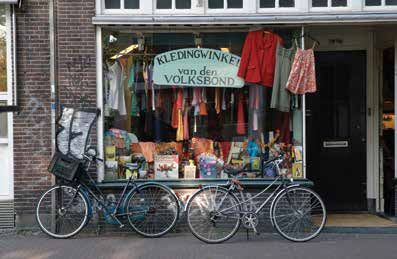
4. Bern

                                                                                  • In Bern, a consumer survey found that clients
                                                                                  coming by bike create 7 500 EUR of revenue per
                                                                                  square metre of dedicated parking space, while
                                                                                  car drivers only brought 6 625 EUR.
                                                                                  > Mit dem Fahrrad zum Einkaufen. Deutsches Institut für Urbanistik (Difu)
                                                                                  gGmbH (2011).
                                                                                  http://www.nationaler-radverkehrsplan.de/transferstelle/downloads/
                                                                                  for-a-04.pdf
© Márcio Cabral de Moura

                           5. Davis (California)

                                                                                  • In Davis (California), a study analysing almost
                                                                                  1.900 shopping trips to a new store found that cy-
                                                                                  clists spend $ 250 per months, car drivers only $ 180.
                                                                                  > Popovich, Handy: Bicyclists as Consumers. Mode Choice and Spending
                                                                                  Behavior in Downtown Davis, California (2014).
                                                                                  http://trrjournalonline.trb.org/doi/pdf/10.3141/2468-06
© Natalie Maynor

                               6. Flanders

                                                                                  • In Flanders, a Master thesis analysing the
                                                                                  transformation of a street from giving space
                                                                                  predominantly to cars towards more public transport
                                                                                  (tram), walking and cycling came to the conclusion
                                                                                  that the customers not coming anymore because of
                                                                                  the lack of car parking after the transformation were
                                                                                  replaced entirely by clients coming by bike or by
                                                                                  foot, and that turnover was slightly higher after the
                                                                                  transformation. 81 per cent of the shop owners that
                                                                                  had established themselves after the transformation
                                                                                  were satisfied with their turnover.
                                                                                  > Delaere, Vandommele: Ruimtelijke en economische impact van fiets- en
                                                                                  tramverbindingen, Casestudie Mortsel – Boechout (2015).
                                                                                  http://www.scriptiebank.be/scriptie/ruimtelijke-en-economische-im-
                                                                                  pact-van-fiets-en-tramverbindingen-casestudie-mortsel-boechout
© apalca

                                        Shopping by bike: Best friend of your city centre
                                                                                                                                                          7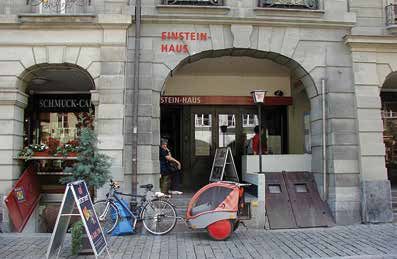
Detailed calculation

             Current volume of shopping by bike in the EU

                                    CURRENT CYCLING                   CURRENT VOLUME OF SHOPPING
                                     MODAL SHARE                          BY BIKE (MILLION EUR)

    European Union (28 countries)         7.64%                                            111.476
              Belgium                     13.0%                                            5.483
              Bulgaria                     1.9%                                              92
           Czech Republic                  7.1%                                            1.139
              Denmark                     18.9%                                            4.847
              Germany                     13.0%                                            36.734
               Estonia                     5.0%                                              77
               Ireland                     3.1%                                             527
               Greece                      3.1%                                            1.129
               Spain                       1.9%                                            2.509
               France                      3.1%                                            6.910
              Croatia                      6.0%                                             419
                Italy                      5.0%                                            10.788
               Cyprus                      1.0%                                              29
               Latvia                      8.1%                                             205
              Lithuania                    5.0%                                             258
            Luxembourg                     1.9%                                              49
              Hungary                     18.9%                                            1.898
               Malta                       1.5%                                              18
            Netherlands                   31.0%                                            16.442
               Austria                     8.1%                                            3.011
               Poland                      9.0%                                            3.912
              Portugal                     1.9%                                             353
              Romania                      5.0%                                             830
              Slovenia                     7.1%                                             357
              Slovakia                     9.9%                                             629
               Finland                    13.0%                                            2.834
              Sweden                      17.1%                                            6.102
          United Kingdom                   1.9%                                            3.895

                                       Shopping by bike: Best friend of your city centre
8
Additional turnover for retailers
             if cycling modal share is doubled in the EU

                                                                                        INCREASE IN LOCAL
                                           NEW MODAL SHARE
                                                                                  RETAIL TURNOVER (MILLION EUR)

       European Union                                 15.3%                                  27.389
(27 countries, excluding Croatia)

            Belgium                                  25.6%                                    1.299
            Bulgaria                                   5.1%                                    39
        Czech Republic                                16.5%                                   368
           Denmark                                   32.4%                                    850
           Germany                                   25.6%                                    8.705
            Estonia                                   12.5%                                    29
            Ireland                                   8.0%                                    205
            Greece                                    8.0%                                    439
             Spain                                     5.1%                                   1.064
             France                                   8.0%                                    2.685
              Italy                                   12.5%                                   4.008
            Cyprus                                    2.7%                                     12
             Latvia                                   18.2%                                    63
           Lithuania                                  12.5%                                    96
          Luxembourg                                   5.1%                                    21
            Hungary                                  32.4%                                    333
             Malta                                     4.1%                                    8
          Netherlands                                 37.3%                                   814
            Austria                                   18.2%                                   926
             Poland                                  20.3%                                    1.203
            Portugal                                   5.1%                                   150
            Romania                                   12.5%                                   308
            Slovenia                                  16.5%                                    115
            Slovakia                                  21.7%                                   184
            Finland                                  25.6%                                    672
            Sweden                                   30.0%                                    1.141
        United Kingdom                                 5.1%                                   1.652

                                    Shopping by bike: Best friend of your city centre
                                                                                                                  9
Methodology
The calculation of the current volume of shopping by bike and the increase in retail turnover that would occur if cycling modal
share was doubled is based on an earlier study from Austria 3.
Current volume of shopping by bike
In this study, the current volume of shopping by bike is calculated as a percentage of the consumption volume of consumer goods.
In order to calculate this value, the following methodology was used.
First, the total volume of consumption in each country was calculated by multiplying the values of two statistics retrieved from
Eurostat4:
• Mean consumption expenditure by household [hbs_exp_t111]
• Number of private households by household composition, number of children and age of youngest child (1 000)
[lfst_hhnhtych].
In a second step, the share of consumer goods in total consumption was computed for each country, since the overall value also
includes items like energy, communication, or housing which are not relevant for retail shopping. The calculation of the share of
consumer goods is based on the data set „Overall structure of consumption expenditure by detailed COICOP level (1 000)
[hbs_str_t211]“ and comprises the following items:
• CP01 Food and non-alcoholic beverages
• CP02 Alcoholic beverages, tobacco and narcotics
• CP03 Clothing and footwear
• CP051 Furniture and furnishings, carpets and other floor coverings
• CP052 Household textiles
• CP053 Household appliances
• CP054 Glassware, tableware and household utensils
• CP055 Tools and equipment for house and garden
• CP0561 Non-durable household goods
• CP0611 Pharmaceutical products
• CP095 Newspapers, books and stationery
• CP091 Audio-visual, photographic and information processing equipment
• CP092 Other major durables for recreation and culture
• CP093 Other recreational items and equipment, gardens and pets
• CP1213 Other appliances, articles and products for personal care
• CP123 Personal effects n.e.c.
The combined share of these items in total consumption varies considerably between countries, from 27 per cent in the
Netherlands to 50-51 per cent in countries like Malta, Romania or Lithuania. In order to account for this variation, it is important
to include it in the calculation.
The aforementioned study from Austria had computed a share of 6.6 per cent in the consumption of consumer goods for
shopping by bike. This calculation is based on the assumption that shopping by bike is local shopping and overwhelmingly done in
the municipality of residence. Therefore, the authors of the study use the share of consumption that is done in the own municipality
3. CIMA Beratung + Management GmbH for LebensministeriumÖsterreich (2010): StudieRadfahren und Einkaufen. Die wirtschaftlicheBedeutung und Potentiale des Fahrradesfür den Einzelhandel in Österre-
ich. https://www.bmlfuw.gv.at/dam/jcr:312a3473-e6b5-4f7f-8281-26bb82aa8737/Studie_20Radfahren_20und_20Einkaufen%5B1%5D.pdf
4. http://ec.europa.eu/eurostat
Shopping by bike: Best friend of your city centre
10by residents and the level of cycling for shopping as parameters to determine the share of shopping by bike in consumption.
Obviously, this is a value that has been calculated specifically for Austria, using consumption volume data from all cities and
municipalities in the country. Since there are no comparable statistics available for the other countries, this value has been used
here to extrapolate values for the rest of the EU. Since the modal share of cycling in Austria (8.1 per cent) is closer to the European
average (7.64 per cent) than in any other EU country, it can be assumed that also the share of shopping by cycling is close to the
EU average value. Therefore, the use of the Austrian value for the other countries should not lead to results that would completely
distort the calculation.
In order to account for differences in cycling levels, the ratio of the share of shopping by bike and the overal modal share in Austria
(6.6 per cent divided by 8.1 per cent) is applied to the modal shares of the other countries, which are based on a previous ECF study
on the job creation effects of cycling 5. For example, in the Netherlands with a modal share of 31 per cent, the share of shopping by
bike would be 25 per cent, whereas in the UK with a modal share of 1.9 per cent it would be 1.5 per cent.
Finally, the share of shopping by bike in the consumption of consumer goods is multiplied by the total volume of consumption of
consumer goods to compute the value of shopping done by bike.
Comparing the value for Austria with the one from the original study shows that our value (ca. 3 billion EUR) is higher than the
former one (2.5 billion EUR). This can mainly be explained by the fact that the original study uses household consumption data
from 2004, whereas we used data from 2010. Household consumption in Austria has increased during that time period by
15 per cent.
Increase of turnover in retail with doubling of cycling modal share
The calculation of the increase in turnover in retail with a doubling in the modal share of cycling is also based on the aforementioned
study from Austria, which has calculated an increase of retail turnover of 0.2 per cent for each percentage point increase in cycling
modal share. This is applied to the growth in modal share estimated for each country , based on the total consumption of consumer
goods.
The model dividing the doubling of the aggregate EU cycling modal share between the different countries is based on the ECF study
on jobs creation mentioned above. This model attributes a higher growth rate of modal share to countries with low base values,
and a much lower growth rate to countries with high base values, like the Netherlands.
Finally, Croatia is not included in this calculation since there is no data available to estimate the growth of modal share.
5. http://www.ecf.com/wp-content/uploads/141125-Cycling-Works-Jobs-and-Job-Creation-in-the-Cycling-Economy.pdf
Shopping by bike: Best friend of your city centre
11Rue Franklin, 28
1000 Brussels, Belgium
Phone: +32 2 880 92 74
Fax: +32 2 880 92 75
office@ecf.com
www.ecf.com
Shopping by bike: Best friend of your city centre
12You can also read