Gender By Numbers: Is Your Education Course Dominated By Your Opposite Gender? - British HCI
←
→
Page content transcription
If your browser does not render page correctly, please read the page content below
Gender By Numbers: Is Your Education
          Course Dominated By Your Opposite
                      Gender?

                     Sara Tranquada                   Nuno Correia                   Ana Caraban
                         FCT, M-ITI                 NOVA Lincs, FCT                    IST, M-ITI
                          Portugal                      Portugal                        Portugal
                 sara.tranquada@m-iti.org            nmc@fct.unl.pt              ana.caraban@m-iti.org

        In this paper we present Gender by Numbers, a physical and virtual prototype that exhibits the
        gender imbalances in the pursuit of future careers. Our system collects and measures relationships
        between courses and gender retrieved from university statistical data. Our goal is to explore how
        high school students can be nudged towards gender consciousness and be aware of the gender
        imbalance of a course before applying to the university.

                                  Gender, Prototype, Physical, Virtual, Education, Equality, Bias

1. INTRODUCTION                                                  colleagues in a class of 100 (Henn, 2014; Luna,
                                                                 2016). Apparent this was one of the reason for
“Boys are doctors. Girls are nurses. Boys are pilots.            eventually dropping out of the field.
Girls are stewardesses.” These are pages of a
controversial book: “I’m Glad I’m a Boy! I’m Glad I’m            To what point can a message persuade someone?
a Girl!” created by Whitney Darrow, Jr. (a previous              Authors (Baesler and Burgoon, 1994) studied the
editorial cartoonist of The New Yorker magazine)                 understanding of message effects. They presented
that highlights the ridiculousness of gender norms.              messages based on statistical evidence and others
Published in 1970, the collection’s stereotypes are              as narrative stories across multiple time periods
still unfortunately relevant 48 years later (Lecher,             (immediate, 48 hours later, or 1 week later).
2018; Popova, 2014).                                             Although both proved persuasive compared to no
                                                                 evidence, statistical evidence was more persuasive
Statistics from the U.S.A. National Science                      than story, and when combined with vividness, it
Foundation about the percentage of women majors                  created more durable persuasion (1 week).
(i.e. Bachelor’s, Master’s, Doctoral), by field of
degree (e.g. medical school, law school, physical                The convergence of physical and virtual worlds can
science and computer science) demonstrate that                   link the “gap between theory and reality”. (Wang and
from 1970 to 2010 women’s participation in these                 Tseng, 2018) explored which activities (physical,
fields increased. However, from 1985 onwards the                 virtual or combined environmental) could better
percentage of women in computer science started to               enhanced students’ knowledge about evaporation
decrease (from almost 40% in 1985 to almost 20%                  and condensation. Activities in a combined
in 2010), while in the other fields it continued to              environment were more efficient in helping students’
increase to more than 40% by 2010. This appears to               conceptual understanding than either virtual or
be ongoing, as the field of computer science is                  physical information alone, respectively.
dominated by men (Henn, 2014).                                   Our aim in this preliminary study was to gently
Patricia Ordóñez is a living example of that                     present to students the harsh reality of gender
professional gender dynamic. Being herself a math                inequity in technical majors, in order not to
wiz in school, she discovered that math could be                 demotivate them, but to inform them and prepare
applied to programing and to grasp computers. As a               them through statistical messages. We will describe
result, Computer Science became her interest. In                 our research approach, and present a fresh design
her first introductory course at the John Hopkins                to enhance the most often encountered (virtual
University in the 1980s, she was faced with the bitter           alone) statistical analysis for future college students
reality of having fewer than 6 female student                    by adding a haptic component. More specifically,
                                                                 this work aims to explore if a combined environment

© 2018, Sara Tranquada et al. Published by
BCS Learning and Development Ltd.                     1
Proceedings of British HCI 2018. Belfast, UK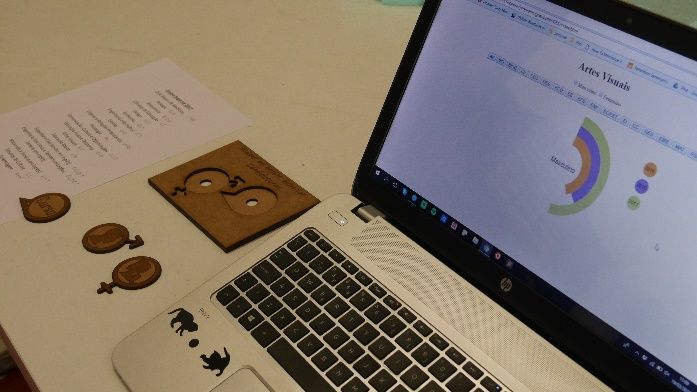
Gender By Numbers: Is Your Education Course Dominated By Your Opposite Gender?
                                  Sara Tranquada ● Nuno Correia ● Ana Caraban

(virtual and physical) could have a critical impact on
facilitating a clear observation of the uneven number
of gender in the courses they apply to. We explore
the benefits that both kinds of interactions can give
us (physical – tactile interaction and virtual – visual
animation) in order to optimize their interaction and
impact.

2. GENDER BY NUMBERS

The design of Gender by Numbers was based on the
missing elements of the website of the Portuguese
Direção-Geral do Ensino Superior (DGES, a division
of the Ministry of Science, Technology, and
Education (“DGES,” n.d.)). This site contains
records of higher education applicants and                        Figure 2: The virtual part of the prototype
placements in Portugal. The existing public site
offers many statistics, however gender is tallied only
for number of applicants as a total, and not by                   Gender by Numbers first displays an animation with
individual courses. The data used for this prototype              the percentage, represented by a pie chart, of the
is derived from that web site, focusing on preliminary            male students that applied to a course (e.g. Arts)
on the applicant’s choice only [Please note that the              within the last 3 years – viewed from inside to out
authors reuse the binary gender categories provided               (see Figure 3). Moments later the same animation
by government statistics; we address concerns with                occurs, changing its percentage this time to the
this reduction in the Future Work section].                       female students (see Figure 4). This animation has
                                                                  a purpose to better demonstrate the contrast
Gender by Numbers uses a two-part selection                       between applications by gender, be it increase,
(gender and course) interface, allowing a user to                 decrease or balance. The cycle repeats.
visualize and segment underlying statistics. We
designed and developed a physical prototype (see
Figure 1) as the centerpiece of the interaction with
the web platform (see Figure 2).

Figure 1: The physical part of the prototype – on the right       Figure 3: Male statistic of the Computer Science course.
a plaque title ‘Access to higher education applications’’         Male students started in 2015 with a majority, decreasing
and on the left: the pieces of a female and male                  the percentage in 2017.
accompanied with a piece representing the Courses.

                                                              2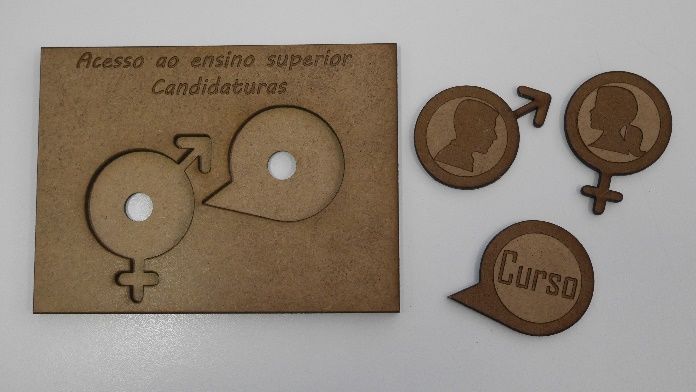
Gender By Numbers: Is Your Education Course Dominated By Your Opposite Gender?
Sara Tranquada ● Nuno Correia ● Ana Caraban
Figure 4: Female statistics of the Computer Science
course. In 2015 women were the minority, increasing the Figure 6 - The Scenario for the experiment.
percentage in 2017.
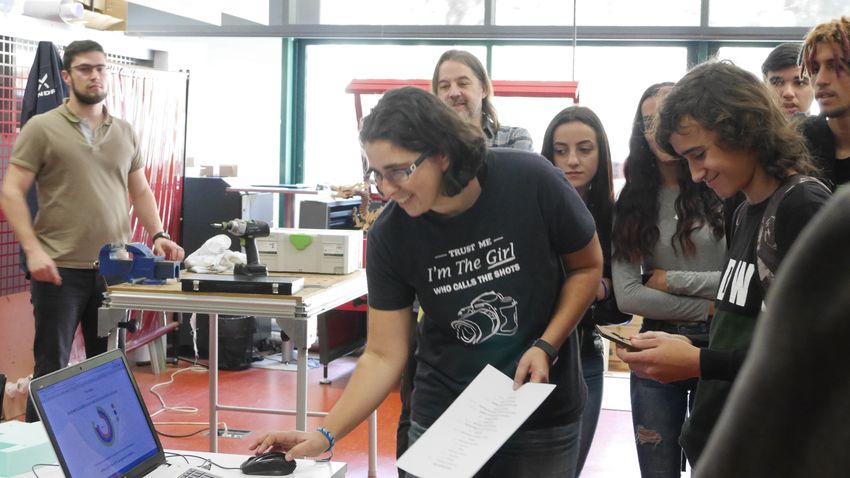
Each participant underwent the same process (see
Our physical prototype (see Figure 1), as mentioned Figure 7): students were asked to select their gender
before, serves to interact with the virtual prototype. and a course, and then guess the perceived gender
For this purpose, the student needs to select the inequality (i.e. male or female majority). One
symbol that corresponds to his/her gender (i.e. researcher asked the participants to express their
female represented by an AIGA/airport female thoughts and recorded their reactions while
symbol inside of the female Linnaean symbol, and interacting with the prototype. The physical
the corresponding male analogy) onto the base of prototype was not fully automatic yet; while the
the prototype (see Figure 1 – left side) and the participants interacted with the pieces, the
intended course. The web application then displays researcher inserted their selections (i.e. gender and
statistical data of the course chosen (see Figure 3 course) into the virtual prototype (see Figure 7).
and 4), and a text describing the percentage of Every interaction with the visual prototype was video
his/her gender cohort if he/she applied to that course recorded and their thoughts regarding the prototype
in the previous year (see Figure 5). The purpose of were audio recorded. After the experiment, data
this selection was to better provide an recorded was transcribed and analysed.
understanding of the large discrepancy among
courses by gender.
Figure 7: During the pilot test, a group of high school
students were asked to interact with our system and
Figure 5: In this example, Computer Science and Male observe gender distribution in different courses.
were chosen and this text would appear
4. DISCUSSION
3. EXPERIMENTS
This research contributes with a web platform that
We conducted a pilot experiment with 21 high school displays a quantitative data of gender distribution
students (13 male and 8 female). The experiment across different courses. Our goal is to increase
was carried out during a visit to our university lab. awareness of gender inequality in high school
Participation was completely voluntary (see Figure students before they apply to the university.
6). During the visit, participants were asked the To increase engagement with the system, our
following questions: “Are you thinking of going to the prototype was devised as an interactive system that
university?” and “What courses are you considering combines virtual and physical domains.
applying to?” We gathered student’s opinions using Our pilot test allowed us to observe that high school
a “think aloud” protocol. students were aware of some gender discrepancy
(i.e. 62% of the students were correct on their guess
3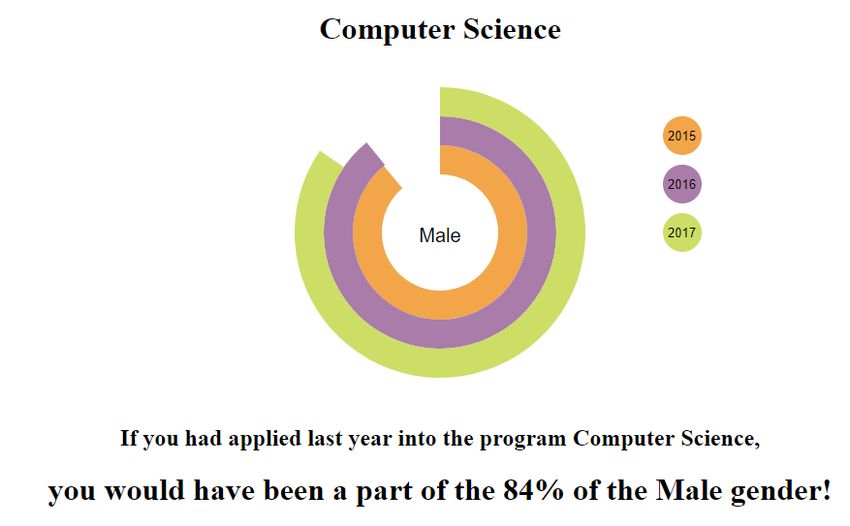
Gender By Numbers: Is Your Education Course Dominated By Your Opposite Gender?
                                  Sara Tranquada ● Nuno Correia ● Ana Caraban

as to who dominated the course). This                            necessarily in accordance with a binary gender
consciousness       increased       throughout     the           category. The authors are aware that the binary
experimentation. Further, we observed that the                   interface presented in this prototype reinforces a
interaction between both prototypes (virtual and                 simplistic binary of gender, and would like to explore
physical) was fluid and intuitive, and the information           alternatives, as this may open opportunities for more
provided was understood.                                         diverse technological possibilities.

Table 1: Some of the participant guesses and results (e.g.
first Line: a male student wanted to see who dominates
the Nursing Course, which he believes to be majority             7. ACKNOWLEDGMENT
female students. Result: more female students than male,
only 26% of students were Male in Nursing course)                This research was supported by ARDITI (Agência
                                                                 Regional para o Desenvolvimento da Investigação,
 Subject         Course          Thought on    Statistic
 Gender                          Domination   2017/2018          Tecnologia e Inovação), Doctoral Grant under the
 Male      Nursing               Female       26% Male           Project M14-20 - 09-5369-FSE-000001.
 Female    Physical education    Male         37%
           and Sports                         Female
 Female    Civil Engineering &   Male         20%                8. REFERENCES
           Electronic                         Female
           Engineering and                                       Baesler, E.J., Burgoon, J.K., 1994. The Temporal
           Telecommunications
 Male      Computer Science      Male         84% Male                   Effects of Story and Statistical Evidence on
 Female    Basic Education       Female       88%                        Belief Change. Commun. Res. 21, 582–
                                              Female                     602.
 Male      Culture Studies       Male         36% Male                   https://doi.org/10.1177/0093650940210050
 Male      Medicine              Male         20% Male
                                                                         02
 Female    Psychology            Female       83%
                                              Female             DGES [WWW Document], n.d. URL
                                                                         http://www.dges.gov.pt/pt (accessed
5. CONCLUSION                                                            1.26.17).
In this paper, we present the preliminary concept of             Henn, S., 2014. When Women Stopped Coding
Gender by Numbers, a system for exploring                                [WWW Document]. NPR.org. URL
statistics to raise awareness of gender                                  http://www.npr.org/sections/money/2014/10
discrepancies among university courses. The                              /21/357629765/when-women-stopped-
underlying motivation was to raise awareness                             coding (accessed 1.17.17).
among future college students with the harsh reality,            Lecher, C., 2018. James Damore sues Google for
helping them to be conscious about the gender                            allegedly discriminating against
domination of a course before applying to the                            conservative white men [WWW Document].
university. With this research, we want to draw                          The Verge. URL
attention to the gender bias surrounding technical                       https://www.theverge.com/2018/1/8/16863
field and non-technical fields.                                          342/james-damore-google-lawsuit-
                                                                         diversity-memo (accessed 5.25.18).
                                                                 Nosek, B.A., Smyth, F.L., Sriram, N., Lindner, N.M.,
6. FUTURE WORK/ NEXT STEPS                                               Devos, T., Ayala, A., Bar-Anan, Y., Bergh,
                                                                         R., Cai, H., Gonsalkorale, K., Kesebir, S.,
Our future work aims to improve “Gender by                               Maliszewski, N., Neto, F., Olli, E., Park, J.,
Number” by making the physical prototype fully                           Schnabel, K., Shiomura, K., Tulbure, B.T.,
interactive and able to retrieve more data from all the                  Wiers, R.W., Somogyi, M., Akrami, N.,
universities of the country.                                             Ekehammar, B., Vianello, M., Banaji, M.R.,
Increasingly, gender is viewed in biology, sociology,                    Greenwald, A.G., 2009. National
and other fields as less of a binary and more of a                       differences in gender–science stereotypes
spectrum or multi-dimensional network. The                               predict national sex differences in science
government statistics that this experiment was                           and math achievement. Proc. Natl. Acad.
based on use a simple binary definition of gender,                       Sci. 106, 10593–10597.
which constrained this initial work. This binary                         https://doi.org/10.1073/pnas.0809921106
definition of gender may be problematic but                      Luna, R.I.M.D., 2016. Patricia Ordóñez: Propelling
nonetheless is still extremely determinant in society                    computer science into the health industry
(Williams and Ceci, 2015), even while the implication                    and equity [WWW Document]. Cienc. P. R.
of the binary varies considerably around the world                       URL https://www.cienciapr.org/en/monthly-
(Nosek et al., 2009).                                                    story/patricia-ordonez-propelling-computer-
Work by (Tonso, 2006) and others have                                    science-health-industry-and-equity
demonstrated how technical students have plural                          (accessed 5.25.18).
ranges of gender expression in technical fields, not             Popova, maria, 2014. I’m Glad I’m a Boy! I’m Glad
                                                                         I’m a Girl! – Brain Pickings [WWW

                                                             4
Gender By Numbers: Is Your Education Course Dominated By Your Opposite Gender?
Sara Tranquada ● Nuno Correia ● Ana Caraban
Document]. URL Grade Students’ Science Achievement and
https://www.brainpickings.org/2014/01/20/i Conceptual Understanding of Evaporation
m-glad-im-a-boy-im-glad-im-a-girl-darrow/ and Condensation. Int. J. Sci. Math. Educ.
(accessed 1.26.17). 16, 203–219.
Tonso, K.L., 2006. Student Engineers and https://doi.org/10.1007/s10763-016-9774-2
Engineer Identity: Campus Engineer Williams, W.M., Ceci, S.J., 2015. National hiring
Identities as Figured World. Cult. Stud. Sci. experiments reveal 2:1 faculty preference
Educ. 1, 273–307. for women on STEM tenure track. Proc.
https://doi.org/10.1007/s11422-005-9009-2 Natl. Acad. Sci. 112, 5360–5365.
Wang, T.-L., Tseng, Y.-K., 2018. The Comparative https://doi.org/10.1073/pnas.1418878112
Effectiveness of Physical, Virtual, and
Virtual-Physical Manipulatives on Third-
5You can also read