Generating Real-Time Profiles of Runtime Energy Consumption for Java Applications
←
→
Page content transcription
If your browser does not render page correctly, please read the page content below
Generating Real-Time Profiles of Runtime Energy
Consumption for Java Applications
Muhammad Nassar, Julian Jarrett, Iman Saleh, M. Brian Blake
Department of Computer Science
University of Miami
Coral Gables, Florida, USA
m.mansour1@umiami.edu
{j.jarrett, iman, m.brian.blake}@miami.edu
To address these research questions, we introduce a unique
Abstract— Energy consumption of computer-based systems is a
growing concern, especially for large scaled distributed systems method for profiling applications in terms of their runtime
that operate in data centers and server farms. Currently, there power consumption. To support this method, we
exist many hardware implementations that holistically measure conceptualized and developed a novel Energy Profiler for Java
the consumption of energy for hardware and software systems. applications. The profiler integrates with Java applications in
These approaches are limited as they measure the current power such a way that provides an energy consumption estimate for
consumption of the overarching system - an approach that does the software in question. The profiler leverages the energy
not necessarily assist in making the underlying software more model described in [1], where the authors estimate the power
power-aware while under operation. This paper introduces the consumption of a computational model with N number of
algorithm and process of calculating the energy consumption of
processors, a separate cache memory for each processor and
Java applications at runtime. This approach is evaluated using a
new energy profiler tool that is designed to integrate with a Java main memory. This approach enables software developers to
application leveraging the underlying physical architecture of the use energy efficiency as a key performance metric influencing
hardware. By incorporating the awareness of energy their software design decisions. Moreover, software engineers
consumption within the software application, then that will be able to abstract design practices and patterns that
application can dynamically choose the most energy-efficient decrease the energy footprint of applications. We evaluate this
processing paths within its operations. model by comparing estimated values produced from the
energy profiler with measures produce from a physical power
Keywords - power consumption; java; energy; distributed systems; consumption meter. Using varying programming constructs to
software profiling implement the same function, we show a significant degree of
accuracy with our model and implementation when comparing
I. INTRODUCTION energy consumption trends to processing intensity.
Energy consumption is a significant global challenge. Data
centers and servers in the United States consume huge II. RELATED WORK
amounts of energy and consequently challenge the Many frameworks have been proposed to profile power and
sustainability of our natural resources [8,9,10]. The use of energy consumption across different types of computer
enterprise service-oriented systems has only exacerbated the systems. These frameworks utilize both hardware and software
challenges [7,16]. Furthermore, on an individual basis with techniques for profiling energy and target both servers and
the prevalence of mobile devices, it is important to optimize mobile devices. In the early work of one of the co-authors of
software operations in order to extend battery capabilities. this paper, a method was proposed that leveraged design-time
testing of web services using generic loads of web traffic. The
What attributes are required and which are most energy was measured during a training phase and was used to
effective in calculating energy consumption in a develop a model for a specific web service at various server
runtime environment of a Java application? and software states [5]. The work described in [5] and [6]
What are the challenges for disambiguating residual uses a more predictive model applied towards the efficient
power consumption from the hardware platform with power management of web services and redundantly deployed
power consumed by the targeted software cloud environments.
application? Some of the previous efforts in this area evaluate the overall
system energy usage [11,12], while others have the capability
Are there approaches for reducing the amount of of applying more granular measurement techniques to isolate
residual power calculated within the software and profile individual components. The authors in [2]
application-specific calculation? introduce the PowerPak Framework; a combination of
hardware and software components capable of low-level
592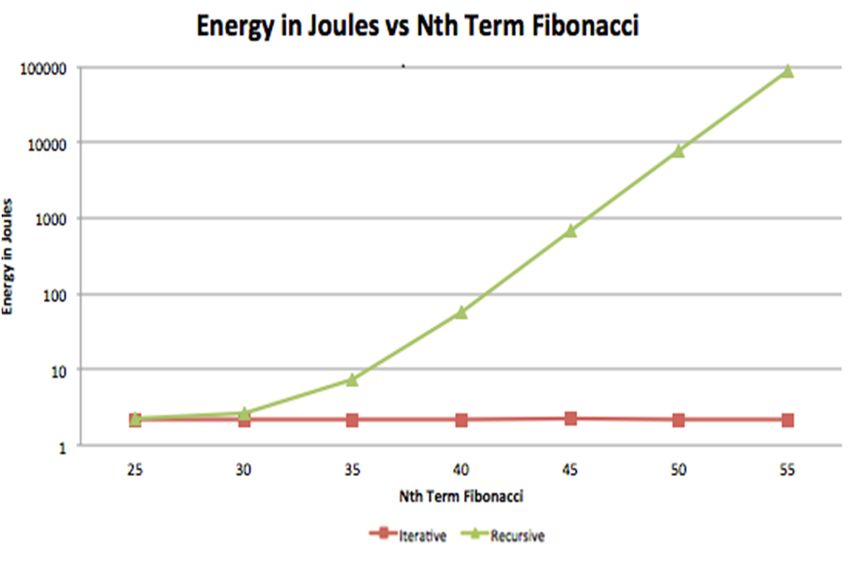
energy profiling of parallel scientific applications on multi- Memory access energy: Em * TActive * (The amount of
core, multi-processor distributed systems. They use physical memory used in bytes)
instrumentation including sensors, meter circuits and data
acquisition devices for measurement. Software components Leakage Energy: El * TActive * X
consist of drivers for physical meters, sensors, and a user level where, EPI is the energy consumed per CPU instruction (in
API for automated power profiling and synchronization of the instruction set of the CPU), TCPU is the total time the CPU
code. The framework is also capable of producing direct and is active, Em is the energy consumed for a single memory
derived measurements and isolating individual component access, El is some hardware constant, TActive is the total time the
consumption through the use of fine-grained systematic power system is active (including CPU idle time) and X is the CPU
measurements. PowerScope is a tool proposed by the authors clock frequency.
in [3] to profile the energy usage of mobile applications This energy model is loosely based on the one described in
through statistical sampling. A digital multi-meter is used to [1], and relies on the values obtained from the Java Virtual
sample both the power consumption and system activity and Machine (JVM). The computational energy component is
passes this information to a data collection computer running computed as the product of the CPU frequency, the total time
the energy monitor. An energy profile is then generated and the CPU is active – where these two terms provide the total
the data is analyzed offline to remove profiling overhead. number of instructions executed – and the energy consumed
In [4], researchers at Microsoft present a Windows based fine- per instruction, which is a chipset constant. The JVM provides
grained energy profiler by implementing and integrating a the total time the CPU is active, while the user is responsible
workload manager, an event logger and an energy profiler. for providing the CPU frequency, and the energy per
Event tracing is started by the workload manager, which instruction value, if available. Some assumptions are made
executes code under fixed loads of data. Tracing includes while calculating the computational energy component. The
kernel level tracing of components such as the CPU, Disk I/O, system used for testing has an Intel Core 2 mobile chipset and
page faults, heap range creation and context switches. The it is assumed that the CPU performed one instruction per
event logger simply logs all events generated by the workload cycle. It is also assumed that the microprocessor is the sole
manager and the energy profiler is then used to correlate energy consumer and that other parts of the chipset – like the
system resource usage of an application. north/southbridge – is not taken into account since the energy
Some other efforts on the hardware level make use of model in [1] does not incorporate them. The Graphics
Dynamic Voltage and Frequency Scaling (DVFS). DVFS is a Processing Unit (GPU) is not incorporated in the model either,
widely used technique for power manipulation [13,15]. Its and is not taken into account. However, the tests presented in
basic idea is to decrease the CPU frequency to allow a later sections do not call for any GPU usage.
corresponding change in the supplied voltage. This in turn As for the memory access energy, since there is no direct
results in a reduction of the overall power consumption. DVFS way of computing the exact number of memory accesses, and
is being used mainly to control the power consumed by the since the JVM provides the total amount of memory it uses
CPU cores rather than main memory. Despite this fact, the directly, an approximated calculation is used as described
writers of [14] successfully developed a memory frequency- above. The total memory access energy is calculated as the
scaling algorithm that could reduce the power consumption of product of the amount of memory used by the JVM, the total
main memory by around 14% on average without any time the application is active – where these two terms provide
noticeable performance degradation. the total amount of memory that needs to be sustained for the
Unlike the previous approaches, our tool does not require lifetime of the application – and the energy consumed per
the use of external instrumentation for measurement. Our memory access, which is also a chipset constant. The JVM
approach for application profiling utilizes a plug-in that provides the total amount of memory used, and the total time
operates in real-time and produces an estimate of the total the application is active is calculated as the difference between
energy consumed by the application. The plug-in is provided the end and start times of the application obtained directly
as a JAR file that can be imported into Java applications. This from the JVM. The user provides the energy per memory
approach extends the state of the art as it allows application- access value, if available.
level estimations. The profiler allows the applications to be The leakage energy component is calculated in the exact
more self-aware of their own energy signatures. We use a same manner as described in [1], which is the product of the
mathematical model that estimates the energy usage given a CPU frequency, the total time the application is active, and El,
set of parameters describing the underlying hardware. We which is a hardware constant value provided by the user if
validate our model’s accuracy by comparing the estimated available.
values to the ones measured by an energy meter.
IV. DESIGN AND ARCHITECTURE
III. ENERGY MODEL
An energy profiler plug-in that implements the energy model
According to our model, the energy consumed by a software described in Section 3 was developed in Java. It is available as
system has 3 main components: a JAR file which can be easily integrated into other Java
Computational Energy: EPI * TCPU * X applications. As shown in Figure 1, the plug-in gathers the
data it needs from two sources, user input about chipset
593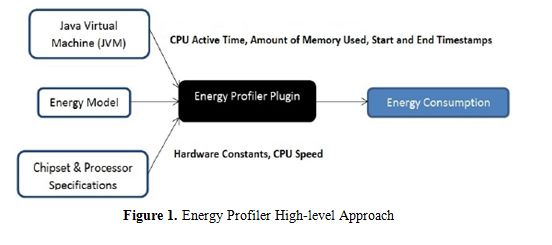
specific constants and CPU and memory performance
information from the JVM. The plug-in then applies this data
to the energy model to produce the energy consumption
information.
    As shown in the class diagram described in Figure 2, the
application is split into three classes. The CPUMonitor class is
responsible for fetching CPU utilization information from the
JVM. The MemoryMonitor class gathers memory utilization
information from the JVM. The EnergyCalculator class
collects the data retrieved by these two components, plugs
them along with the hardware constants into the energy model,
and provides a total consumption estimate in Joules. The
hardware constant values EPI, Em and El are hardware-specific
and should be provided by the developers. If not provided, the
plug-in uses default values specific to the Intel Core 2 Duo
processor architecture. In order to use the plug-in to gather
energy consumption data, some steps need to be performed.
Before the code block whose energy consumption needs to be
analyzed, an object of type EnergyCalculator is declared and
the current CPU frequency in GHz is passed as a parameter to
its constructor. If the hardware constants EPI, Em and El are
known, another constructor is provided that accepts them as
parameters alongside the CPU frequency. If these constants
are not provided, default values are used as described earlier.
After the code block that is being examined, the method
PlugDataIntoModel() is called from the previously defined
                                                                                       Figure 2. System Class Diagram.
EnergyCalculator object. This method returns a string value
that represents the energy consumed by the enclosed code
block in Joules.
    Listing 1 shows how an EnergyCalculator class object can             EnergyCalculator calc(OperatingFrequency, EPI,
                                                                                                                 Em, El);
be used to profile the energy usage of Java code. As explained
earlier, the EnergyCalculator class object has to be initialized
before the code block in question and a call to the
PlugDataIntoModel() method after the code block will
                                                                         String Energy_Consumption =
provide the energy consumption estimate. Listing 2 shows the                                    ;
pseudo-code of the EnergyCalculator class.
                                                                                      Listing 1. Energy Profiler’s Usage.

                                                                   594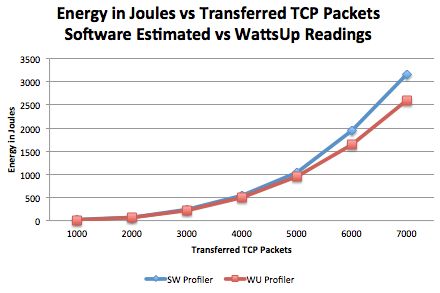
public EnergyCalculator (CPUFrequency, EPI, Em, El) Figures 4 and 5 provide sample results illustrating the usage of
{ the profiler. Figure 4 illustrates a comparison between the
CPUMonitor myCPUMonitor;
MemoryMonitor myMemoryMonitor;
estimated energy calculated by the energy profiler and the
double StartTime = ; actual readings obtained using the WattsUp meter. The test is
double OperatingFrequency = ; conducted on a simple TCP implementation in Java. Figure 5
double EPI = ;
provides a similar comparison using a recursive
double Em = ; As noted in Figure 4, the estimated and measured energy
double El = ;
consumption values increased consistently with the rise in the
} number of packets sent. The difference between estimated and
private void CalculateEnergyConsumption () measured values increased as the load on the system increased.
{ This difference increased from around 10% on lighter system
double memoryUsage = ; loads to approximately 18% with the highest tested load. We
double cpuUsage = ; energy consumption since the energy profiler only measures
double EndTime = ;
double TotalTime = ; the consumption of the application in question, whereas the
} WattsUp meter measures the entire system’s consumption.
public String PlugDataIntoModel() Figure 5 shows that the estimated and measured values also
{
CalculateEnergyConsumption(); increased consistently with the increase in the value of the
double E_comp = ;
double E_mem = ; To better understand calculated energy, we decomposed the
double E_leak = ;
double TotalEnergy = ;
average relative contributions of computational energy,
return TotalEnergy.toString(); memory access energy and leakage energy are approximated
} to 85%, 10% and 5% for the TCP simulation application and
90%, 3% and 7% for the Fibonacci sequence calculator
Listing 2. Energy Profiler’s Pseudo-code.
application. The level of contribution of each component is
reasonable with respect to the results presented in the related
works [17] and [18]. The obtained increase our confidence in
the validity of the profiler. Within each experiment, the
percentages are consistent as the load increased and the results
are also consistent across different applications.
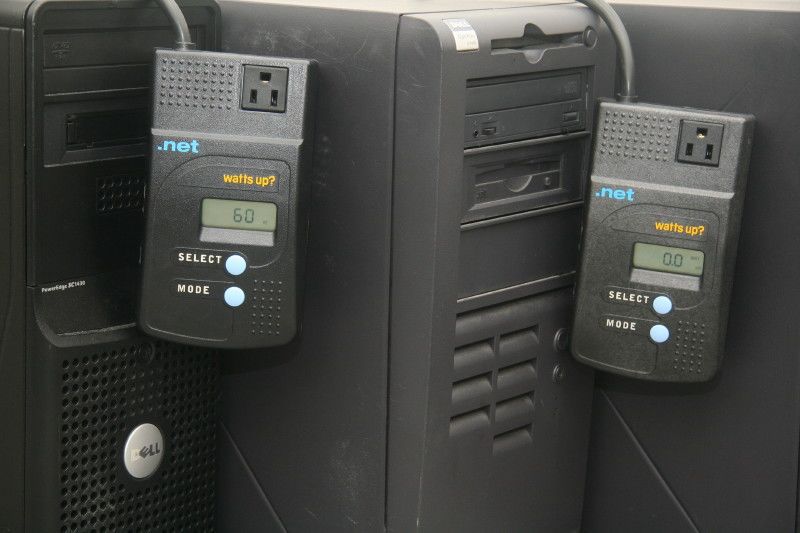
Figure 3. Picture of the Watts-Up Measurement Devices.
V. EVALUATION
The energy profiler can be used to estimate the energy
consumed by Java applications as well as compare the
consumption of different implementations of the same Figure 4. Estimated vs. Actual Energy Readings for a Simple TCP
algorithm. To validate our estimates, we compared energy Implementation.
consumption output from the profiler to energy consumption
figures obtained from the WattsUp meter
Figures 6, 7 and 8, illustrate the results obtained when the
(https://www.wattsupmeters.com), a physical device that
profiler is used to measure the energy consumption of both
measures the real time energy consumption of electronic
recursive and iterative implementations of a Fibonacci
devices in Watts. The WattsUp meter is shown in Figure 3.
sequence calculator.
595Figure 8. A Comparison between Recursive and Iterative Fibonacci
Implementations on Ubuntu Linux 11.10.
Figure 5. Estimated vs. Actual Energy Readings for a Recursive Fibonacci
The average energy consumption values for each Fibonacci
Implementation. term (from 25 to 55 in increments of 5) are recorded over 12
runs. The tests are repeated across three major operating
systems; Microsoft Windows 7, Mac OS X 10.8.5 and Ubuntu
Linux 11.10. The results for all three operating systems
demonstrated the same pattern. The nature of complexities of
the recursive and iterative Fibonacci implementations is
evident in the graphs, where the complexity of the iterative
implementation grows linearly while that of the recusrive
implementation grows exponentially. The results obtained
demonstrate the expected behaviors of both implementations.
VI. DISCUSSION
The results of our experiments demonstrate that the energy
profiler tool is effective in providing estimates that compare
favorably to real measurements. Although many factors are
involved when it comes to measuring the energy consumed by
different kinds of hardware, the profiler allows for the
Figure 6. A Comparison between Recursive and Iterative Fibonacci specification of the hardware constants EPI, Em and El of the
Implementations on Microsoft Windows 7. underlying chipset as well as the CPU operating frequency.
For the sake of consistency and accuracy of the results, all of
the experiments are conducted on the same hardware with no
other applications running except the operating system itself.
A. Estimating Energy Consumption
The first of the two major functionalities of the profiler is
to provide absolute estimates of the energy consumed by a
certain Java application. Figures 4 and 5 illustrate how those
estimates compare to real measurements. It is worth
mentioning that in these figures, the energy usage estimates
obtained from the profiler are actually higher than those
collected by actual measurements. This would not normally be
expected since the profiler measures only the energy usage of
the Java application under investigation, while the WattsUp
meter measures the consumption of the whole system. This
could be explained by the fact that no other applications were
running while the experiments were being conducted - only
the application under investigation and the OS processes - and
Figure 7. A Comparison between Recursive and Iterative Fibonacci by the fact that a margin of error in the estimation is expected
Implementations on Mac OS X 10.8.5.
since many hardware factors and constants are involved in the
calculation. Taking these facts and factors into consideration,
596the difference between the estimated and actual figures is REFERENCES
negligible on lighter levels of system load, however acceptable
at the higher load levels. [1] Agha, G. and Korthikanti, V. 2010. Towards Optimizing Energy Costs
When it comes to measuring the absolute energy of Algorithms for Shared Memory Architectures. Proceedings of the
consumption values, the hardware constants described earlier 22nd ACM symposium on Parallelism in algorithms and architectures.
pp. 157-165.
in the energy model play a major role in the correct estimation.
[2] Ge, R., Feng, X., Song, S., Chang, H., Li, D., and Cameron, K. W. 2010.
The constants that are the hardest to collect are EPI, Em and El. "Powerpack: Energy profiling and analysis of high-performance systems
These constants are chipset dependent and have to be collected and applications." Parallel and Distributed Systems, IEEE Transactions
form the chipset datasheet. We successfully found the values on 21, no. 5 (2010). pp. 658-671.
of EPI and Em for the Intel Core 2 mobile chipset, but we [3] Flinn, J. and Satyanarayanan, M. 1999. "Powerscope: A tool for
couldn’t find an exact value for El and its value is estimated profiling the energy usage of mobile applications." In Mobile Computing
Systems and Applications, 1999. Proceedings. WMCSA'99. Second IEEE
based on information we obtained from the datasheet of a Workshop on, pp. 2-10.
similar chipset to the one we used. The authors in [19] provide [4] Kansal, A. and Feng, Z. 2008. "Fine-grained energy profiling for power-
the EPI values for different Intel microprocessors. In its aware application design." ACM SIGMETRICS Performance Evaluation
current form, we believe the energy model we use should Review 36, no. 2 (2008): pp. 26-31.
provide highly accurate results as long as all the variables in [5] Bartalos, P., Blake, M.B., and Remy, S. 2011. "Green Web Services:
Models for Energy-Aware Web Services and Applications" IEEE
the model are as accurate as possible. International Workshop on Knowledge and Service Technology for Life,
Environment, and Sustainability (KASTLES 2011), pp. 1-8.
B. Comparing Algorithm Implementations [6] Bartalos, P. and Blake, M.B. 2012. “Green Web Services: Modeling and
Figures 6, 7, and 8 demonstrate how the profiler can be Estimating Power Consumption of Web Services”, IEEE International
effective for another purpose, which is comparing different Conference on Web Services (ICWS 2012), pp. 178-185.
implementations of the same algorithm from the point of view [7] Wei, Y. and Blake, M.B. 2010. “Service-Oriented Computing and Cloud
Computing: Challenges and Opportunities” , IEEE Internet Computing,
of energy consumption. This could prove to be very important Vol. 14, No. 6, pp. 72-76.
in real world applications as it provides the capability of [8] Talebi, M. and Way, T. 2009. “Methods, metrics and motivation for a
comparing the energy consumption of complicated algorithms green computer science program,” SIGCSE Bull, vol. 41, no. 1, pp. 362–
without having to analyze their complexities thoroughly. It 366.
could be considered as a black box technique of analyzing [9] Ghose, A., Hoesch-Klohe, K., Hinsche, L., and Le L. S. 2010. “Green
business process management: A research agenda,” Australasian
algorithms. The task illustrated (computing the Nth Fibonacci Journal of Information Systems, vol. 16, no. 2.
term) provides a good example of such usage. As anticipated, [10] Murugesan, S. 2008. “Harnessing Green IT: Principles and Practices,”
the recursive implementation consumed much more energy IT Professional, vol. 10, no. 1, pp. 24 –33.
than the iterative one, especially as the load on the system [11] Rivoire, S., Ranganathan, P., and Kozyrakis, C. 2008. “A comparison of
increased with the increase of the value of the Fibonacci term. high-level full-system power models,” in Proceedings of the 2008
The results are also consistent across different platforms. The conference on Power aware computing and systems, 2008, pp. 3–3.
marginal error contained in the estimation technique is [12] Li, T. and John, L. K. 2003. “Run-time modeling and estimation of
operating system power consumption,” SIGMETRICS Perform. Eval.
somewhat irrelevant when comparing different algorithms, Rev., vol. 31, no. 1, pp. 160–171.
since the magnitude of the delta between the estimations is the [13] Le Sueur, E. and Heiser, G. 2010. Dynamic voltage and frequency
decisive factor for comparison, rather than the absolute scaling: the laws of diminishing returns. Proceedings of the 2010
figures. international conference on Power aware computing and systems,
HotPower10. pp. 1-8.
VII. CONCLUSION AND FUTURE WORK [14] David, H., Fallin, C., Gorbatov, E., Hanebutte, Ulf R., and Multu, O.
2011. Memory Power Management via Dynamic Voltage/Frequency
This paper presented the experience, method and Scaling. ICAC ’11 Proceedings of the 8thACM international conference
application of creating an energy profiler tool with the ability on Autonomic computing, pp. 31-40.
to isolate the energy consumption of a specific Java [15] Liang, W., Chen, S., Chang, Y., and Fang, J. 2008. Memory-aware
application. Initial experimentation demonstrates that this dynamic voltage and frequency prediction for portable devices. In
Embedded and Real-Time Computing Systems and Applications, 2008.
approach and toolset compare favorably to real measurements. RTCSA ’08. 14th IEEE International Conference, pp. 229 –236.
Future work will focus on tweaking the energy model to take [16] Blake, M.B. and Gomaa, H. 2009. "Agent-Oriented Compositional
into account the internal workings of the JVM, and Approaches to Services-Based Cross-Organizational Workflow", Special
consequently decreasing the gap between the actual and Issue on Web Services and Process Management, Decision Support
estimated values. The model can also be expanded to Systems, Vol. 40, No. 1, pp 31-50.
incorporate more hardware component, like the GPU, Video [17] Do, T., Rawshdeh,S. and Shi, W. 2009. "ptop: A process-level power
profiling tool." Proceedings of the 2nd Workshop on Power Aware
RAM and IO components. We plan to leverage the energy Computing and Systems (HotPower’09).
profiler in developing a body of work that describes energy [18] Chen, H., Wang,s and Shi,W. 2011. "Where does the power go in a
concerns when using specific design patterns for certain types computer system: Experimental analysis and implications." In Green
of infrastructures. We believe that this energy profiling Computing Conference and Workshops (IGCC), 2011 International, pp.
1-6.
approach at the application-level can be used as a training aid
[19] Grochowski, E. and Annavaram, M. 2006. "Energy per Instruction
for software engineers and developers when it comes to Trends in Intel® Microprocessors " Technology@Intel Mag., pp. 1-8
developing sustainable software.
597You can also read