Gesundheitsförderung und Prävention durch Bewegung
←
→
Page content transcription
If your browser does not render page correctly, please read the page content below

Gesundheitsförderung und Prävention
durch Bewegung
Andreas M. Nieß1, 2
1 Innere Medizin V, Abteilung Sportmedizin, Universitätsklinikum Tübingen
2 Interfakultäres Forschungsinstitut für Sport und körperliche Aktivität, Universität Tübingen

04.05.20
© UNIVERSITÄTSKLINIKUM TÜBINGEN.
Agenda

                                             Evidenz

             Epidemiologische Studien
       Mechanismen körperlicher Aktivität
      Individuelle Dosis-Wirkungsbeziehung

2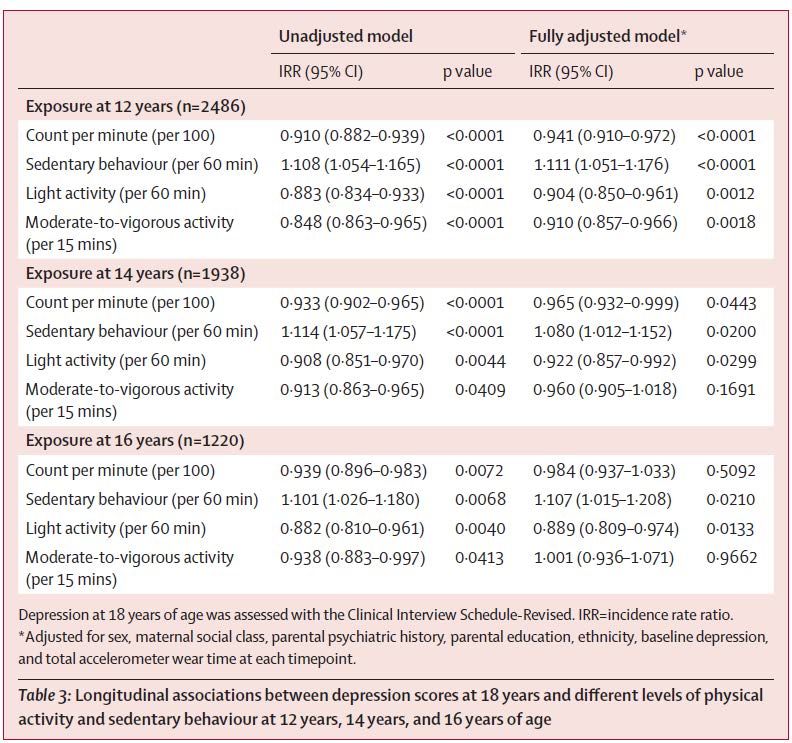
Körperliche Aktivität und Krankheitsrisiko
       – Die historische Entwicklung

                 Inzidenz der KHK

    Morris et al. (1953) Lancet 265: 1111-20   Wen et al. Lancet (2011) 378: 1244-1253

3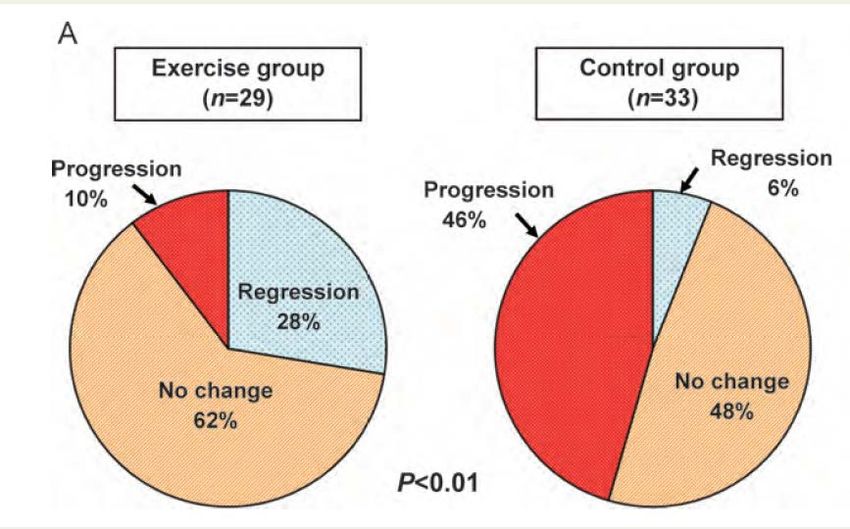
Epidemiologische Evidenz
                  All cause                                       All cancer

                                                                                                                          Lancet (2011) 378: 1244-1253

                                                                                             N = 416.175 Personen
                                                                                                199.265 Männer, 216.910 Frauen

           Cardiovascular disease                            Diabetes mellitus               Gruppen körperlicher Aktvität (MET-Std. / Woche):

                                                                                             inaktiv:           < 3.75
                                                                                             gering:            3.75 – 7.49
                                                                                             mittlere:          7.49 – 16.49 (z.b. 2.5 Std. Walking)
                                                                                             hohe:              16.49-25.49
                                                                                             Sehr hohe:         > 25.49 (e.g. >3.5 hrs. Jogging)

Inactive    Low    Medium High   Very high       Inactive   Low    Medium High   Very high
                                         Activity level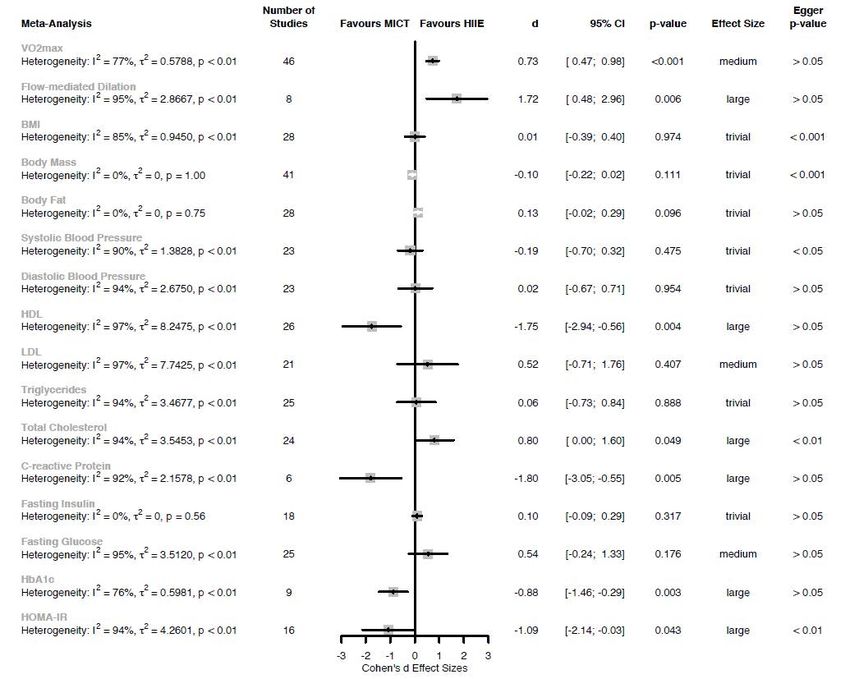
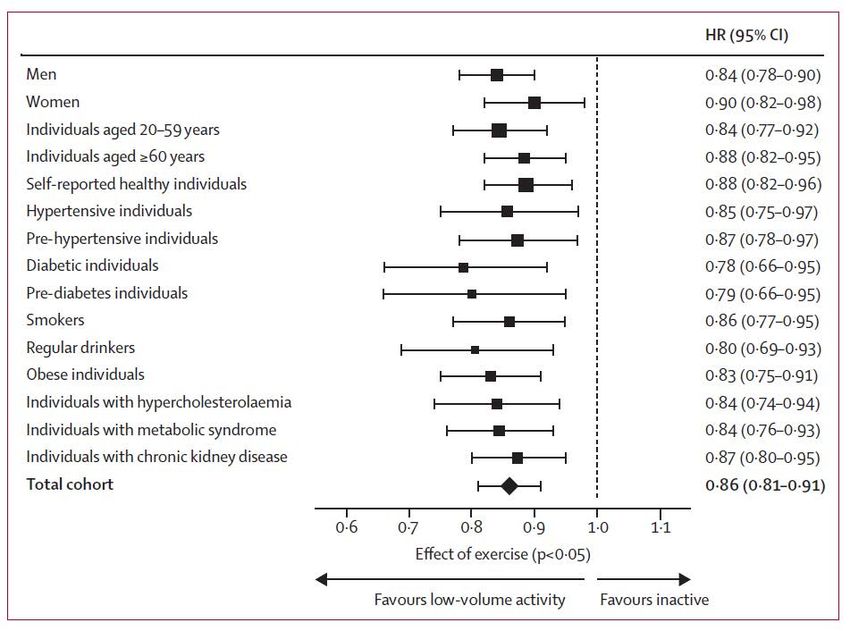
Epidemiologische Evidenz - Subgruppenanalyse

               Wen et al. (2011) Lancet 378: 1244-1253
Epidemiologische Evidenz - Gesamtaktivität

Kyu et al. (2016) BMC 354: j3857
Quant 0.64 (0.52–0.79) 40.6 5
Walking time Combined Between
Dose Response All studies Physical
0.71 (0.59–0.84)
Activity 44.7 7 of
and Risk
Epidemiologische Evidenz Coronary
Quant Heart Disease
.2
0.67 (0.57–0.79) 37.2 5
1 2 3 4 5 A Meta-Analysis
Category of Leisure−time Physical Activity Men All studies 0.63 (0.34–1.17) 76.9 2
792 - Circulation
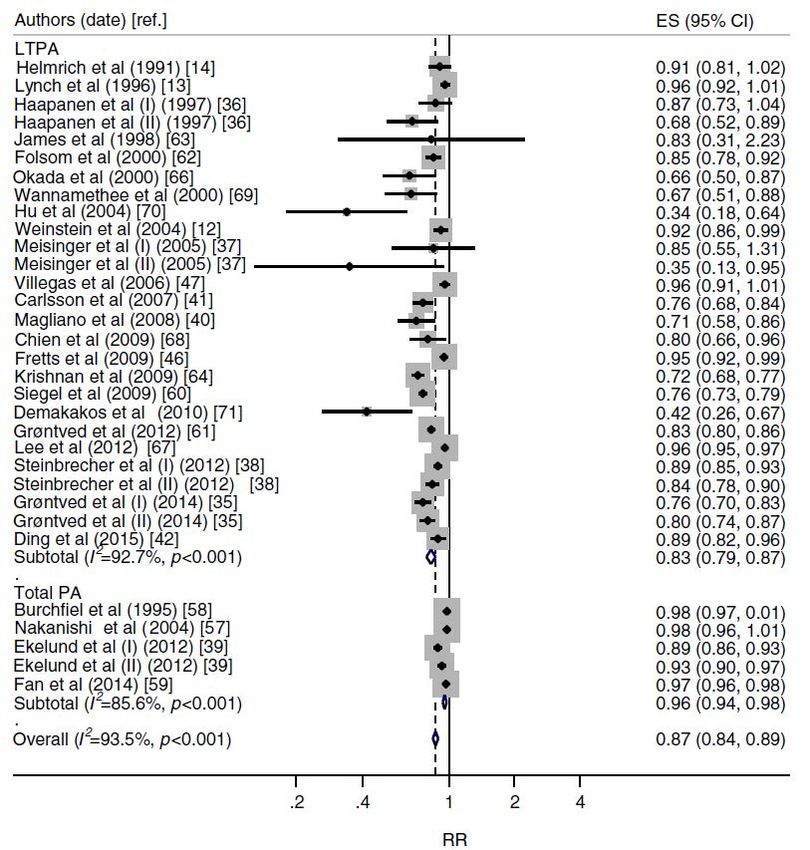
Koronare Herzerkrankung
August 16, 2011 -
Figure 1. Plot of the relative risks of coronarySattelmair
heart diseaseetbyal
Jacob Sattelmair, MSc, ScD; Jeremy Pertman, MS; Eric L. Ding, ScD; Harold W. Kohl III, PhD;
Physical Activity and Coronary Heart Disease
WilliamQuant
Haskell, PhD;0.63
I-Min(0.34–1.17)
Lee, MBBS, ScD 76.9 2 791
category of leisure-time physical activity. All study categories Circulation (2011) 124: 789-795
Background—No reviews have quantified the specific amounts of physical activity required for lower risks of coronary
Women All studies 0.65 (0.55–0.76) 0
heart disease when assessing the dose-response relation. Instead, previous reviews have used qualitative estimates such 4
were standardized to 5 categories for ease of comparison. The as low, moderate, and high physical activity.
size of the data point corresponds to the study size; the larger Quant 0.64 (0.54–0.76) 0 3
Plots of the dose-response relation between quantitative
Methods and Results—We performed an aggregate data meta-analysis of epidemiological studies investigating physical
Table. Pooled Relative Risks of Coronary Heart Disease Comparing
activity and primary prevention of CHD. We included prospective cohort studies published in English since 1995. After es
the dot is, the larger the sample size is. Dashed lines indicate
1
Walking
mates pace LTPA Combined All studies 0.53 per (0.43–0.66) 0
reviewing 3194 abstracts, we included 33 studies. We used random-effects generalized least squares spline models for 3
andofLowest in kilocalories week and CHD risk (
1
14 –22
studies with physical activity categorized quantitatively; solid Highest Physical Activity Categories
trend estimation to derive pooled dose-response estimates. Among the 33 studies, 9 allowed quantitative estimates of
leisure-time physical activity. Individuals who engaged in the equivalent of 150 min/wk of moderate-intensity
lines, studies with physical activity categorized categorically. comparisons; 9 studies), Quantincluding 0.51 (0.35–0.74)
a trend line 0 derived 2 fro
.9
leisure-time physical activity (minimum amount, 2008 US federal guidelines) had a 14% lower coronary heart disease
Relative Studies,
risk (relative risk, 0.86; 95% confidence interval, 0.77 to 0.96) compared with those reporting no leisure-time physical
Men1-stage All studies
random effects, GLST0.53 (0.42–0.67)
spline analysis 0 for 2both sex
activity. Those engaging in the equivalent of 300 min/wk of moderate-intensity leisure-time physical activity (2008 US
.8
2
Type of Activity Sex Studies Risk (95% CI) I,% n*
.8
federal guidelines for additional benefits) had a 20% (relative risk, 0.80; 95% confidence interval, 0.74 to 0.88) lower
for women (based on population norms for weight). These intervals combined, isWomen shown All instudies
Figure 2. Pooled results indicated 1
risk. At higher levels of physical activity, relative risks were modestly lower. People who were physically active at levels
lower than the minimum recommended amount also had significantly lower risk of coronary heart disease. There was
t
LTPA Combined All studies 0.74 (0.69 – 0.78) 28.3 26
.7
Relative Risk
were used as a guide to extend analyses to higher levels of LTPA to fit expectedPAinverse
Occupational Combined relation
All studies between LTPA and0CHD4risk. Ind
0.84 (0.79–0.90)
a significant interaction by sex (P!0.03); the association was stronger among women than men.
Relative Risk
Conclusions—These findings provide quantitative data supporting US physical activity guidelines that stipulate that “some
the available data; higher doses were assigned to balance model Quant 0.71 (0.63–0.80) 39.8
physical activity is better than none” and “additional benefits occur with more physical activity.” (Circulation. 2011; 9
viduals who met Men the All basicstudiesguideline0.87 (0.81–0.99) had a 14% 0 lower 3 risk
.6
.6
124:789-795.)
parsimony and goodness of fit. Men
In a sensitivity analysis, we examined lower doses of physical activity CHD thanKeythose Words:
Women whoAll
coronary heart studies
Allengaged
disease
studies
0.78
! exercise (0.73–0.82)
in! meta-analysis
no LTPA (RR, 0 ! women
! physical activity
0.86; 15
1 95% C
.5
0.77 to Quant 0.79 (0.72–0.86) 0 5
(eg, 275 kcal/wk for both sexes combined) to test the statement in the Transport PA 0.96), whereas
Combined those
Allof studies heartwho
0.87 metreviews
(0.74–1.02) theor advanced81.0 4 guideli
A lthough prevalence and incidence rates coronary in numerous meta-analyses. Although all re-
2– 8
disease (CHD) mortality have declined since the 1960s, views agree that physical activity is associated with a 20% to
2008 US guidelines that, in addition to recommending levels of physical Women All
in thestudies States 0.67 (0.61–0.74) 12.5 11hasto
.4
haditareisliving
aestimated
20% lower
million peoplerisk (RR, 0.80; 95% of CHD, CI, 0.74 0.88
.4
that "17
Men All studies
United
0.9330%
(0.85–1.02)
lower risk
25.9
no work
7,8 to date
3 designated
activity, says, “All adults should avoid inactivity. Some physical activity with CHD in 2010. Coronary heart disease causes quantitative assessments of the amount of physical activity
1
Additionally lower risks
"425 000 annual deaths in the United States, Quant
making it the 0.64
ofand moderate (0.52–0.79)
required
magnitude
for these lower risks, 40.6 were5 toobserv
referring instead qualitative
Women All studies char- 0.74 (0.57–0.97)
of physical activity 73.2 (eg, high versus2 low). Public
.3
is better than none, and adults who participate in any amount of activity leading cause of mortality nationwide. Identifying
1 levels 8
gain some health benefits.”9 among
Walking
Total for publicthose
time health and withmedicine.
Combined higherAll studies physical
acterizing modifiable risk factors for CHD remain important
PA Combined
clinical All studies 0.74foractivity
0.71health
(0.59–0.84)
(0.62–0.90)
health benefits havelevels; 44.7 eg, there
relied0 on individual 3 was
7studies rather
guidelines on the amount of physical activity required
.2
than a systematic assessment of the overall evidence. 9
We also assessed prespecified potential interaction by geographic 25%Thelower Clinicalrisk for
Perspective
Men those
on
All
795 active
p Quant
studies
0.67atMany
the primary 0.79
5andearlytimes
(0.57–0.79)
(0.59–1.07) the37.2the
studies that assessed
18.9 basic 2 guidelin
5 physical
relation between
0 1 (North
region 550 America,
1100 2 1650 Middle
Europe, 3
2200 4
2750adjustment
East), 3300 3850
for 5
4400
confound-
independent role of physical activity in activity CHD dichotomized participants according to their
Category of Leisure−time Physical Activity Amongprevention ofpersons
Men who
CHD is well established
All were
and has
studies physically
been assessed
Women All studies 0.66 (0.44–0.99) 0.63 (0.34–1.17)
activity levels (eg,active 76.9at
active versus inactive);
0
half
however,the
22 bas
more recent
ing (multivariate,Leisure−time
multivariatePhysical Activity (Kcal/wk)
inclusive of intermediates), and CHD
guideline level (275 kcal/wk),0.63 we(0.34–1.17)
found a 14% 76.9 lower risk
Figure
Figure 1.
2. Plot
outcome Plot of
(fatal, the
withnonfatal,relative
spline combined)risks
(smoothed of coronary
using
fit) GLST
and 95% heart disease
splineconfidence by
models, evalu- Nonspecific PA Combined AllQuant studies 12
Continuing medical education (CME) credit is available for this article. Go to http://cme.ahajournals.org to take the quiz.
category P of leisure-time physical activity. All study categories CHD (RR, 0.86; Women95% CI, 0.760.65 to 0.97).
Received November 28, 2010; accepted June 2, 2011.
intervals
ating(CIs) of relative
values risks
for interaction of coronary
terms heart
with indicator disease
variables. by kilo-
We were All studies Combined All
All studies
studies 0.75 (0.55–0.76)(0.71–0.79) 47.6 0 33†4
From the Department of Epidemiology, Harvard School of Public Health, Boston, MA (J.S., J.P.); Channing Laboratory, Department of Medicine,
Brigham and Women’s Hospital and Harvard Medical School, Department of Nutrition, Harvard School of Public Health, Boston, MA (E.L.D.); Division
were standardized to 5 categories for ease of comparison. The
calories
size of
pertoweek
unable
the
assessof
data point
leisure-time
potential interaction
corresponds
physical activity
by age (!65
to the study
or !65
size;
(LTPA).
the
yearsGLST
of age
larger
Using GLST spline Quant models,0.64 we(0.54–0.76)
observed significant 3 intera
of Epidemiology, Genetics and Environmental Health Sciences, University of Texas Health Science Center–Houston, Department of Kinesiology and
0
Health Education, University of Texas at Austin (H.W.K.); Stanford Center for Research in Disease Prevention, Stanford Medical School, Stanford, CA
7
indicates generalized
at baseline) least squares.
or race (white, black, other) because there was insufficient LTPA indicates leisure-time physical activity; I , percentage of variation 2
(W.H.); Division of Preventive Medicine, Department of Medicine, Brigham and Women’s Hospital and Harvard Medical School, Department of
the dot is, the larger the sample size is. Dashed lines indicate tion
Walking by sex
pace
across studies
(P"0.03).
Combined
is due to All
Figure
studies 3
Epidemiology, Harvard School of Public Health, (I.-M.L.).
Guest Editor for this article was Gregory Y.H. Lip, MD.
that heterogeneity
shows
0.53 (0.43–0.66)
rather
trend lines from
than chance;0 All studies, 3 gende
The online-only Data Supplement is available with this article at http://circ.ahajournals.org/lookup/suppl/doi:10.1161/CIRCULATIONAHA.110.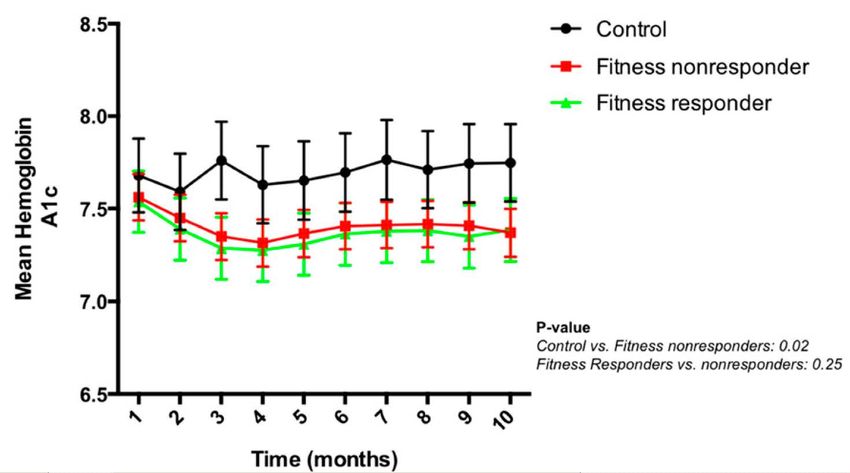
Epidemiologische Evidenz
          - Typ 2 – Diabetes -
                                                                                     Diabetologia (2016) 59: 2527-2545
    Risikoreduktion pro 10 MET-Stunden pro Woche

                                                   Dosis an körperlicher Aktivität        Risikoreduktion

                                                   Pro 10 MET-Stunden/Woche               13% (95% CI 11 – 16%)

                                                   150 min moderat
                                                   11.25 MET-Stunden/Woche                26% (95% CI 20 – 31%)

                                                   300 min moderat                        36% (95% CI 27 – 46%)

                                                   60 MET-Stunden/Woche                   53%

8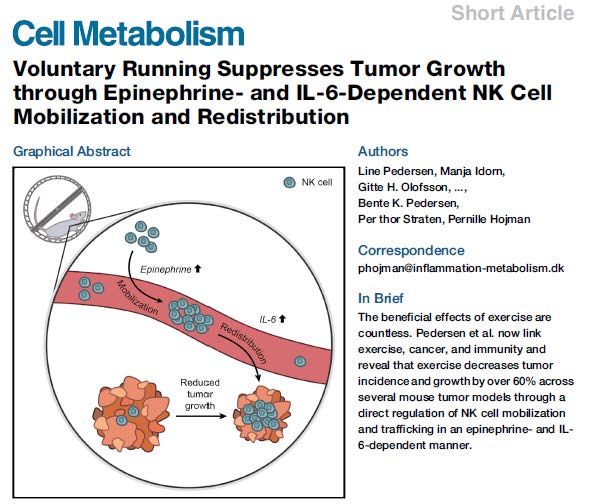
Epidemiologische Evidenz
- Neoplastische Erkrankungen -
 n = 1.44 Mio. Teilnehmer

 In 13 von 26 Tumorentitäten geringeres
 Risiko unter körperlicher Aktivität

 Bei 7 Tumorentitäten
 Risikoreduktion > 20%

                                          Moore et al. (2016) JAMA Intern Med 176: 816–825
Epidemiologische Evidenz
- Sitzen und Sterblichkeitsrisiko -

                                            Lancet (2016) 388: 1302-1310

                                      STERN Nr. 16 20-04-2015
Epidemiologische Evidenz
- Inaktivität und Seelische Gesundheit
Lancet Psychiatry (2020) 7: 262-271„Polypill“ Körperliche Aktivität
td.)
Physical activity retard (12 MET-S
http://www.healthexpress.eu/deWirkmechanismen körperlicher Aktivität
- Insulinresistenz - Diabetes (1992) 41: 1091-1099
Wiederholte
Insulin Muskelkontraktion
ATP → ADP + P
Insulinrezeptor Metformin
2 ADP → ATP + AMP
AMP-aktivierte Kinase
GLUT-4
Glukose GLUT-4:
Glukosetransporter-4 Abbildung: nach König et al. Dtsch Z Sportmed (2006) 57: 242 – 247Wirkmechanismen körperlicher Aktivität
- Kardiovaskuläre Erkrankungen –
Koronare Arteriosklerose im 12-monatigen Follow-up
Schuler et al. (2018) Eur Heart J 34: 1790–1799Wirkmechanismen körperlicher Aktivität - Krebserkrankungen -
(2016) 23, 554–562
Natürliche
KillerzellenWirksamkeit körperlicher Aktivität
- Qualitative Aspekte
Kraft vs. Ausdauertraining
Nieß & Thiel (2017) Diabetologie 12: 112-126
Adapted from Pollok et al., 2001; Mandic et al., 2012
Fagard et al. 2006Wirksamkeit körperlicher Cardio-metabolic risk factors adaptations in HIIE and MICT: A meta-analysis
Aktivität - Qualitative Aspekte VO2max
Flow-mediated Dilation
BMI
Body Mass
Body Fat
Exerc Sport Sci Rev (2008) 36: 58-63 Systolic Blood Pressure
Diastolic Blood Pressure
HDL
LDL
Triglycerides
Total Cholesterol
C-reactive Protein
Fasting Insulin
Fasting Glucose
HbA1c
HOMA-IR
Mattioni et al. (under review)Individuelle Trainierbarkeit
Maximale Sauerstoffaufnahme Belastungs-Herzfrequenz Nüchtern-Insulin
n = 720
Mean response: +384 ±202 ml VO2.
Bouchard & Rankinen (2001) Med Sci Sports Exerc 33: S446 Bouchard et al. (2012) PLoS ONE 7: e37887
18Individuelle Trainierbarkeit
PLoS ONE (2012) 7: e37887
13,3%
Anteil Non-Responder (%)
8,3%
Anteil Non – Responder für 1 RF: 31%
2 RF: 6%
HERITAGE HERITAGE DREW INFLAME STRRIDE MARYLAND JYVASKYLA Total HERITAGE HERITAGE DREW INFLAME STRRIDE MARYLAND JYVASKYLA Total
3-4 RF: 0,8%
Anteil Non-Responder (%)
12,2%
10,3%
HERITAGE HERITAGE DREW INFLAME STRRIDE MARYLAND JYVASKYLA Total HERITAGE HERITAGE DREW INFLAME STRRIDE MARYLAND JYVASKYLA TotalIndividuelle Trainierbarkeit
n = 202 Personen mit Typ-2-Diabetes
9-monatiges Trainingsintervention
3-5 x Ausdauer-/Kraft-/Kombitraining/Woche
bei 50-80% VO2peak
20Individuelle Trainierbarkeit
J Physiol (2017) 595: 3377-3387
Alles nur eine Frage der Dosis ?
Gabriel & Zierath (2017) Cell Metabol 25: 1000-1011
21Vom vom Trainingsreiz zur Trainingsanpassung
Reiz mechanischer metabolischer neuronaler hormoneller
Modulatoren:
Auslenkung z.B. Tension ¯O2 ¯ATP/AMP Laktat FFA ROS Ca 2+
Stressresponse
Homöostase
z.B. MAPK HIF-1a AMPK PPARag PGC-1a NFAT
Signaling
Genetics
Zellkern
Epigenetics
Transkription
Translation
z.B. Muskelfaser- Fettsäure-/Glukose Mitochondriale Gefäßwachstum
Transformation Stoffwechsel Biogenese -regulation
modifiziert nach: M. Flück (2006) J Exp Biol 209: 2239 • Hood et al. (2006) J Exp Biol 209: 2265 • Yan et al. (2011) J Appl Physiol 110: 264Zusammenfassung Große Evidenz zur Wirksamkeit körperlicher Aktivität aus epidemiologische Studien mit Hinweisen zu Dosis-Wirkungsbeziehung (Gruppeneffekte) als robuste Basis für Empfehlungen zur aktivitätsbasierten Prävention Wachsende Erkenntnisse zu den zugrundeliegenden Mechanismen körperlicher Aktivität bei der Risikoreduktion mit präzisierenden Hinweisen zur Dosis-Wirkungsbeziehung und Reizqualität sowie unter entitätsspezifischen Gesichtspunkten Individuelle Dosis-Wirkungsbeziehung körperlicher Aktivität als „offene Flanke“ in der aktivitätsbezogenen Prävention mit der Notwendigkeit des Verfolgens interdisziplinärer Forschungsansätze 23
Vielen Dank für Ihre
Aufmerksamkeit

04.05.20
© UNIVERSITÄTSKLINIKUM TÜBINGEN.
You can also read