Global Attractions Attendance
←
→
Page content transcription
If your browser does not render page correctly, please read the page content below
Global
Attractions
Attendance
Report
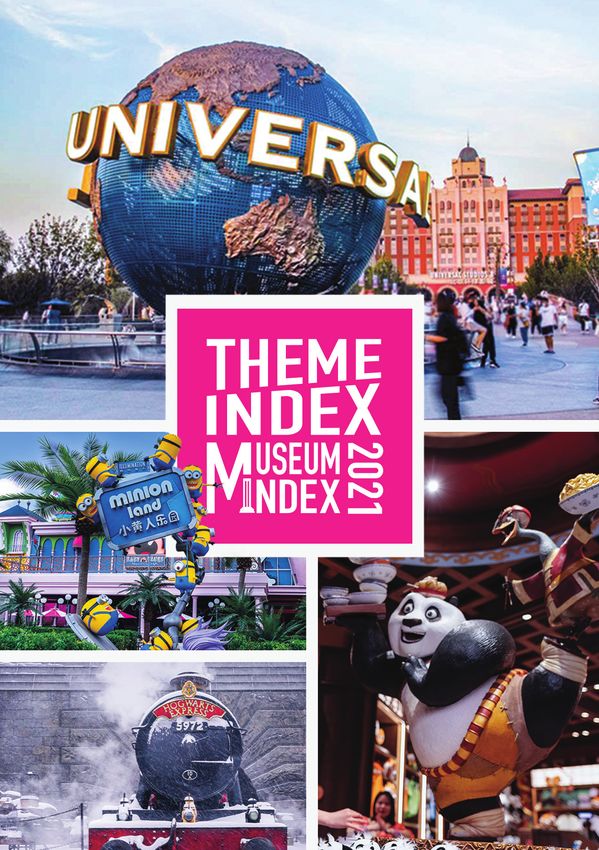
Cover image:
Universal Beijing Resort opened on September 20, 2021 and
includes the Universal Studios Beijing theme park, two resort
hotels and Universal CityWalk Beijing.
© Universal Parks & Resorts

Credits
TEA/AECOM 2021 Theme Index and Museum Index: The Global Attractions Attendance Report
Publisher: Themed Entertainment Association (TEA)
Research: AECOM Economics + Advisory
Editor: Martin Palicki
Producer: Francisco Refuerzo and Linda Cheu
Lead Designer: Josue Thur de Koos
Publication team: Cristian Bevington, Beth Chang, Linda Cheu, Lucia Fischer, Lillian Holmes, Doris Li,
Jodie Lock, Andrew Logan, Daisy Long, Jason Marshall, Martin Palicki, Michael Posso, Francisco Refuerzo,
John Robinett, Pedro Spindler-Ruiz, Joseph Vitone, Chris Yoshii.

©2021 TEA/AECOM. All rights reserved.

Contacts
For further information about AECOM:

Economics + Advisory

John Robinett                                                      Chris Yoshii
Senior Vice President – Economics, Americas                        Vice President – Economics, Asia-Pacific
john.robinett@aecom.com                                            chris.yoshii@aecom.com
T +1 213 593 8100                                                  T +852 3922 9000

Linda Cheu                                                         Beth Chang
Vice President – Economics, Americas                               Executive Director – Economics, Asia-Pacific
linda.cheu@aecom.com                                               beth.chang@aecom.com
T +1 415 796 8100                                                  T +852 3922 8109

Jodie Lock                                                         Francisco Refuerzo
Associate Director – Economics, EMEA                               Senior Analyst – Economics, Americas
jodie.lock@aecom.com                                               francisco.refuerzo@aecom.com
T +44 207 061 7000                                                 T +1 213 593 8490

Architecture and Design

Jeff Damron, AIA
Architect                                                          Zak Nawrocki, AIA, NCARB
Jeff.damron@aecom.com                                              Managing Principal—Orlando
T +714 5677-2400                                                   Zachary.nawrocki@aecom.com
                                                                   T +1 407 843 6552

For information about TEA (Themed Entertainment Association):

Martin Palicki                                                     Lindsey Nelson
Theme Index Editor and Press Contact                               TEA Executive Director
martin@inparkmagazine.com                                          lindsey@teaconnect.org
T +1 262 412 7107                                                  T +1 818 843 8497

TEAconnect.org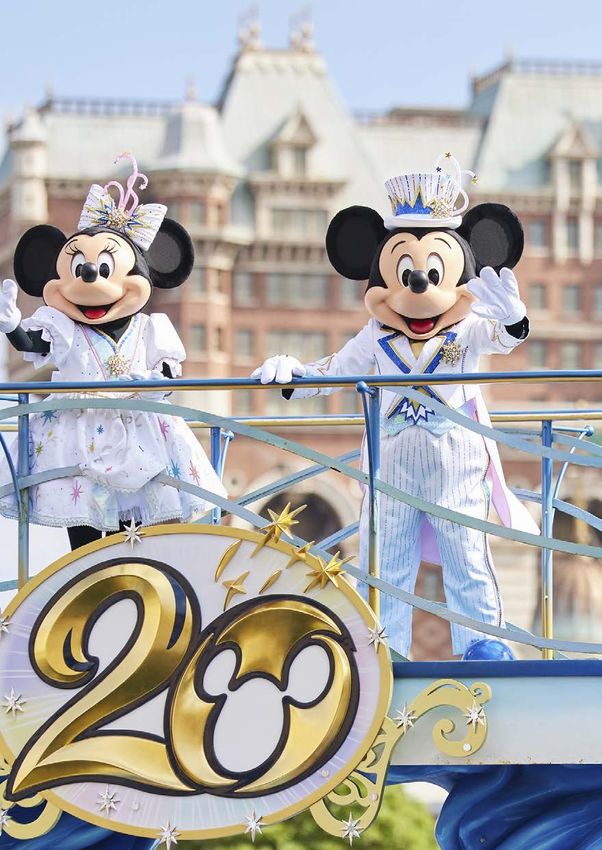
Global
Attractions
Attendance
Report
The definitive annual
attendance study for the
themed entertainment and
museum industries.

Published by the Themed
Entertainment Association
(TEA) and the Economics
practice at AECOM.
4
Contents
The Big Picture                            6
The Americas                              18
Asia-Pacific                              36
EMEA                                      50
Museums                                   62
About The Study                           92
Frequently Asked Questions                93

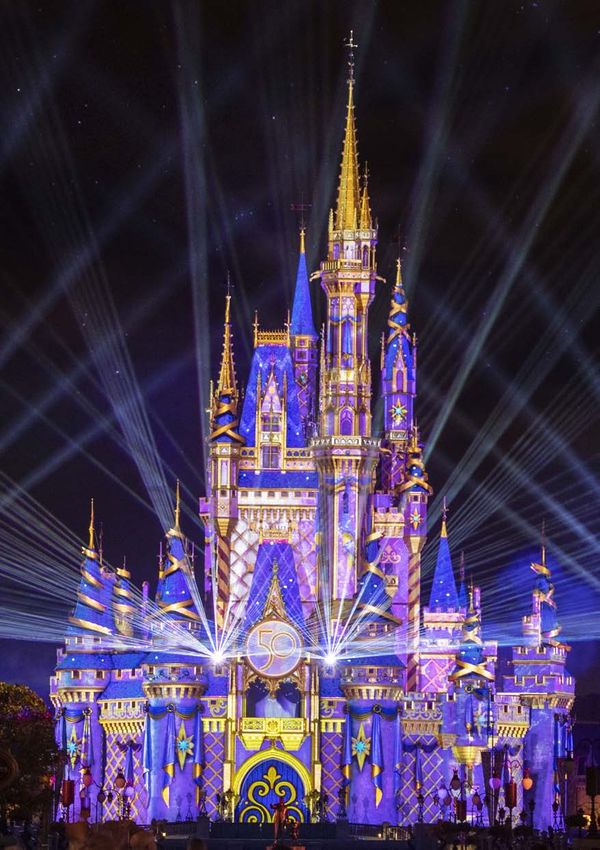
                             Disney Enchantment at Magic Kingdom Park debuted in October of
                                   2021 as part of Disney World’s 50th Anniversary celebration
                                                                                      © Disney

                                                                                                 5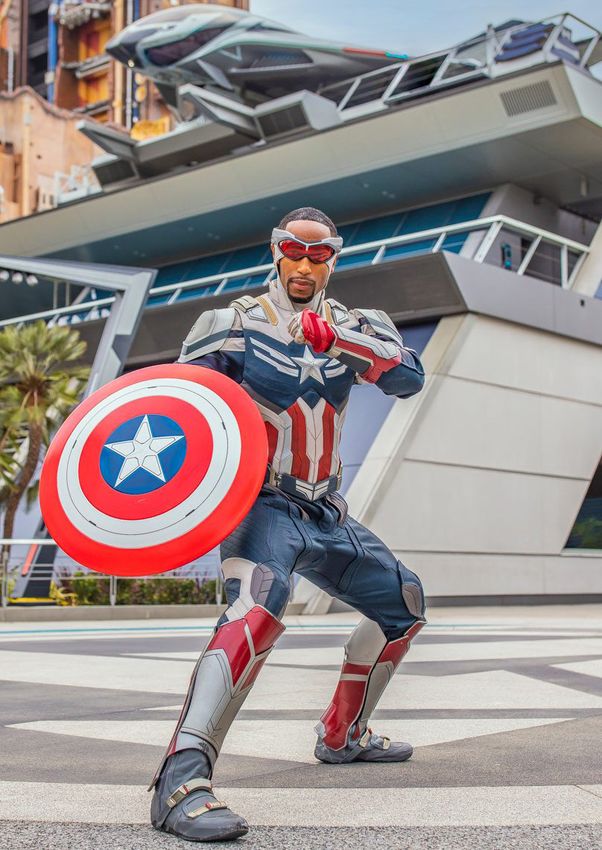
The Big Picture

    The industry started on the road to recovery in 2021.
    Compared to the year prior, theme parks increased
    attendance globally by an impressive 72%.

    Total attendance in some areas of the world was in reach of pre-pandemic
    levels. The speed of recovery was largely influenced by the level of government
    restrictions, the success of vaccine rollouts, and general consumer confidence
    levels.

    China, the engine behind Asia’s growth in recent years, struggled with lockdowns,
    quarantines, and travel restrictions, resulting in only a 25% increase over 2020.
    North America fared exceptionally well with a 136% increase in attendance over
    2020, fueled by pent-up demand and more relaxed restrictions during the key
    summer months.

    With perhaps the notable exception of China, the marketplace has continued to
    bounce back this year. Although challenges like labor, supply chain, and inflation
    continue, the industry is poised to continue its comeback in 2022 and 2023.

                                                    Total attendance in some
    John Robinett                                   areas of the world was in
    Senior Vice President,                          reach of pre-pandemic
    AECOM Economics + Advisory                      levels.

6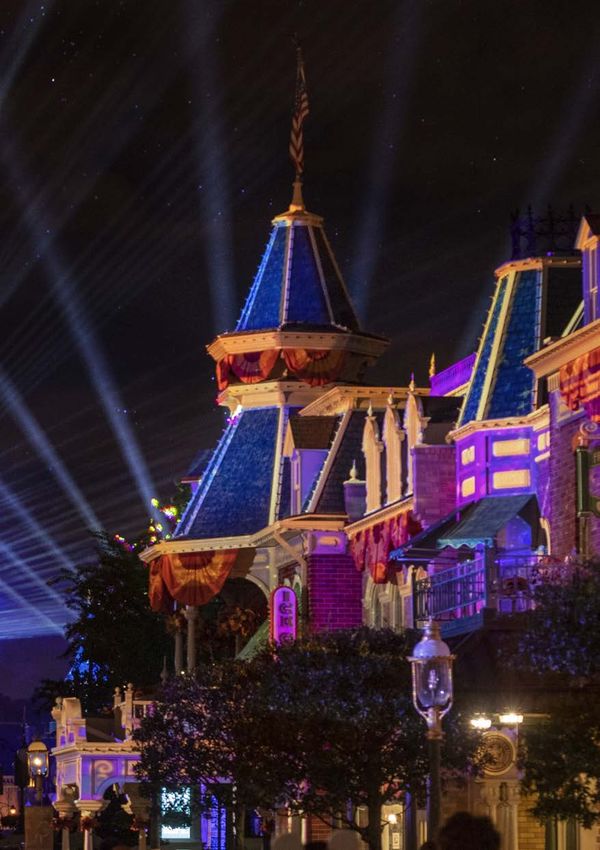
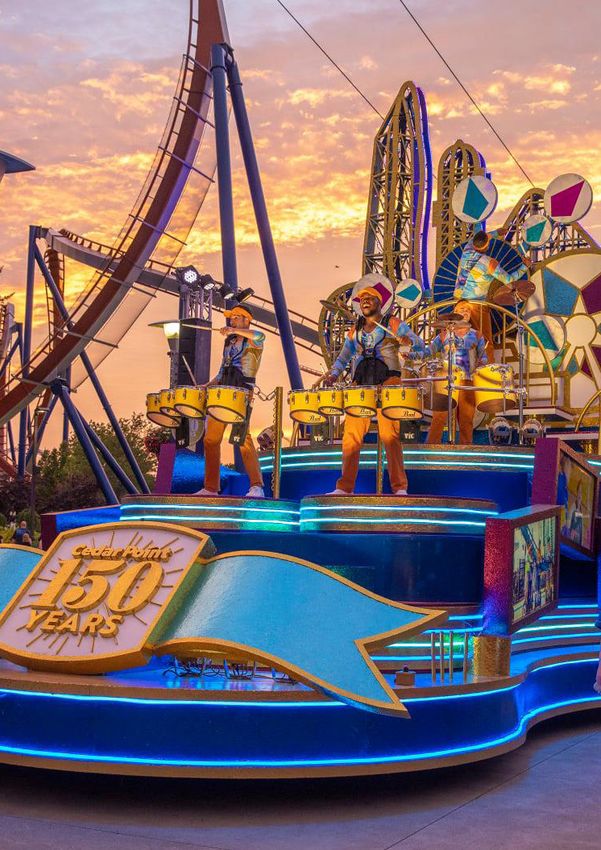
Cedar Point 150th Anniversary Celebration, Sandusky, Ohio
                                             © Cedar Fair

                                                            7
Parks capitalized on that through additional
    Ranking                                           retail and food options, but they also turned
                                                      to technology.
    Because of the vast disparity in operating
    conditions imposed on parks around the            Technological solutions addressing ticketing,
    world, the playing field was not level. We        capacity, and queueing were accelerated
    decided to continue last year’s system of         during the pandemic. Dynamic pricing,
    holding the 2019 rankings and showing how         required reservations, electronic ticketing,
    parks performed relative to 2019 and 2020.        and queue management are examples of
    We are optimistic that conditions will allow us   how parks have been able to provide more
    to resume ranking parks and museums soon.         efficiency and sometimes monetize perks
                                                      that used to be free. As a benefit to guests,
    Unpacking the numbers                             the overall visitor experience was made more
                                                      comfortable and less stressful.
    Across the board, facilities that operated
    seasonally and draw from a more local
    resident population performed better,

                                                                                 141.35m
    largely because the summer of 2021 saw
    few governmental restrictions but also fewer
    international tourists. Parks and museums
                                                                           Top 25 theme parks worldwide
    that normally see a large number of Chinese                                        attendance 2021
    tourists were especially affected.

    Despite continuing volume generally below
    pre-pandemic levels, many parks reported
                                                                                   83.26m
                                                                           Top 25 theme parks worldwide
    substantial gains in per capita spending. Part                                     attendance 2020
    of that is due to consumers’ pent-up demand
    from 2020, as well as elevated savings levels.

                                                                              Tivoli Gardens, Denmark
                                                                                       © Tivoli Gardens

8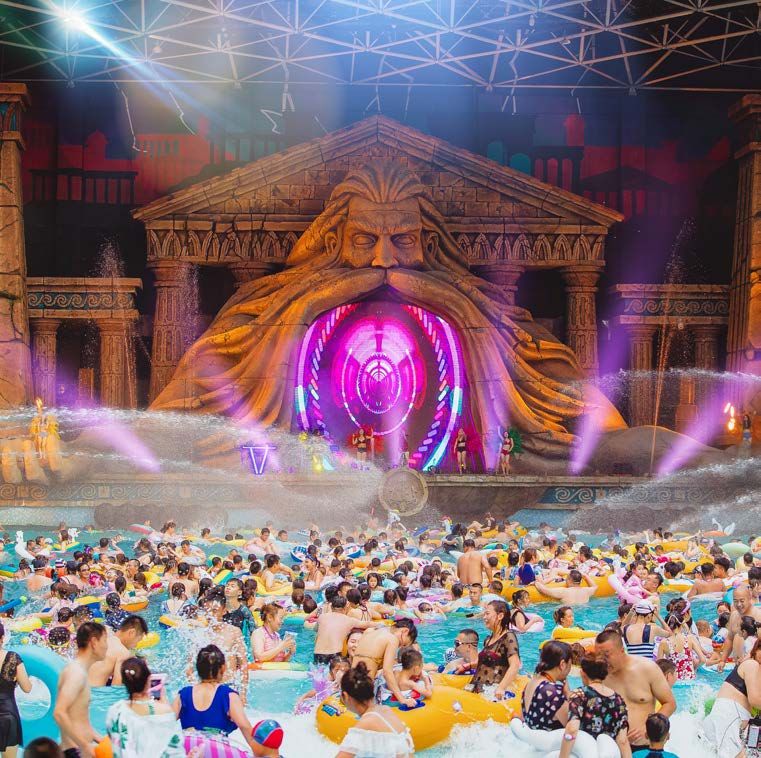
R&F Hainan Ocean Paradise, Hainan, China
                                                                    © R&F Hainan Ocean Paradise

The industry continues to face an ongoing
labor shortage. The large amount of entry-      Asia Pacific
level seasonal positions is particularly
challenging to fill with the current labor      Pandemic restrictions varied widely from
market squeeze. Parks utilized a variety        country to country, with China being one
of solutions, from adjusting operating          of the strictest in the world. The outsized
schedules, offering significant hiring          role China plays in the market resulted in
bonuses, and in some cases, reducing the        a dampening effect on parks all around
amount of workforce needed.                     the region, with results performing at 55%
                                                of 2019 attendance. One exception was
We would be remiss not to mention the           China’s OCT chain, which bounced back to a
current global economic situation. As           reported 97% of pre-pandemic numbers, in
always, there are certain factors we are not    large part due to the acquisition of nine new
able to control within the industry. Global     properties and aggressive discounting.
inflation and economic contraction are risks
likely to shape the near future. These are      Within the market we see a fairly strong
part of the natural business cycle and our      pipeline of investment, as well as the start of
industry will respond professionally to them,   consolidation as the industry in Asia begins
as it always has.                               to mature. Once the Chinese tourism engine
                                                is unshackled from government restrictions,
                                                we see a strong comeback for the entire
                                                region.

China's OCT chain
bounced back to a reported
97% of pre-pandemic
numbers.

                                                                                                  9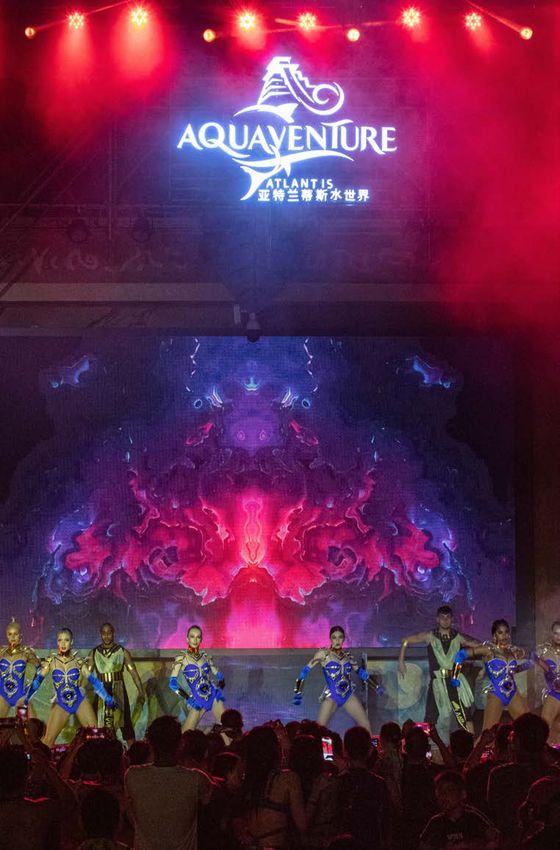
Tornado Chasers ride at Futuroscope
                                                                                     © Futuroscope

     Europe, Middle
     East, Africa
     Because many European parks are
     seasonal, it was largely back to business in     We think demand is strong
     the summer of 2021. Merlin notably reported      on the continent with
     revenues at some properties greater than
     2019. On the attendance front, Europa-Park       investments being planned
     and Efteling were standouts both with over       for upcoming years.
     3 million visitors, rivaling Disneyland Paris,
     which had the best numbers in Europe at 3.5
     million.                                         Dhabi will soon make it onto our top-ranking
                                                      lists.
     We think demand is strong on the continent
     with investments being planned for
     upcoming years. All things remaining equal,
                                                      Americas
     2022 and 2023 should be improved years.          Pent-up demand and reduced worries about
                                                      COVID during the summer of 2021 led to the
     Parks in the Middle East, particularly in the    US outperforming every other market. This
     UAE, were open for visitors quickly thanks to    is impressive, given China’s rapid outpacing
     effective vaccination efforts and relatively     of American parks prior to the pandemic.
     easy access. Expo 2020 Dubai served as a         Of particular note were North American
     major draw for the end of 2021 and helped        waterparks, which improved significantly
     highlight the region’s tourism potential. We     from 2020 and even approached 2019
     hope some of the parks in Dubai and Abu

10
levels. Hurricane Ian.
The region’s hub of Orlando, Florida, It’s worth noting that many major operators
home to many of our list’s top operators, are moving ahead with planned investments,
successfully welcomed backed visitors signaling that 2022 will be a strong year.
anxious to return to the parks while still Responding to guest expectations for new
navigating COVID precautions and reduced attractions and capital will be key for 2023
international travel. The word “resilient” and beyond.
comes to mind when looking at this market,
as evidenced most recently by safe and
quick re-openings following the damaging
Ice Breaker at SeaWorld, Orlando, Florida
©SeaWorld
11M+, West Kowloon Cultural District, Hong Kong
© M+
Museums
Because they are indoor, museums did
not fare as well as outdoor parks in 2021.
Though the top museums worldwide are up
by 32% from 2020, attendance is still only
29% of 2019 levels. Many museums and
their visitors tended to be more cautious Smartly, museums
with COVID, accounting for part of the used the pandemic to
disparity with other market segments. In
fact, museums with outdoor elements such
create a wealth of digital
as sculpture gardens tended to see more programming in order
attendance over the year. to engage with guests
Smartly, museums used the pandemic to
remotely.
create a wealth of digital programming in
order to engage with guests remotely. The
pivot to the electronic museum was swift
and successful. We are already seeing a
bounce back in attendance in 2022 and
expect that to continue.
12Notes for the future The travel industry has faced significant
challenges in the past two years. Clearly the
There are a few industry highlights worth demand for air travel is back, and airlines
considering while planning for the future. are sorting through the labor challenges to
Immersive experiences are gaining in meet that demand. As they work through
popularity. But what was once the realm that, expect travel to largely return to
of just theme parks and a few specialty normal patterns. This is good news for the
attractions is now impacting a large swath attractions and leisure markets.
of sectors, from zoos to retail to hospitality.
Guest expectations for immersive Our industry has proven to be resilient and
experiences will continue to rise. did a very good job of managing during
the worst of the pandemic. Operators
Premium experiences in attractions has are seeing positive signs of business
always been a component of the industry; improvement and are starting to reinvest
many parks have long offered up-charged now for a better visitor experience. I believe
VIP experiences for high end guests. But that our industry has an inherent mission
the larger industry is now looking for ways to bring joy, excitement, and hope to
to provide for this market. In fact, part of the people - particularly in times of struggle
increase in per capita spending last year and adversity. Our industry delivered on
was due to capturing additional revenue that promise over the last few years, and we
streams from customers seeking more will continue to provide that during the next
exclusive experiences. business cycle, and beyond.
JurassicWorld Isla Nublar, Universal Studios Beijing
© Universal Studios/Amblin.
13Top 25
Amusement/Theme Parks
Worldwide
ATTENDANCE
ATTENDANCE
ATTENDANCE
% CHANGE
2019 RANK
2020-2021
LOCATION
PARK
2021
2020
2019
MAGIC KINGDOM THEME PARK AT WALT DISNEY WORLD RESORT,
1 LAKE BUENA VISTA, FL, U.S.
82% 12,691,000 6,941,000 20,963,000
2 DISNEYLAND PARK AT DISNEYLAND RESORT, ANAHEIM, CA, U.S. 133% 8,573,000 3,674,000 18,666,000
3 TOKYO DISNEYLAND AT TOKYO DISNEY RESORT, TOKYO, JAPAN 51% 6,300,000 4,160,000 17,910,000
4 TOKYO DISNEYSEA AT TOKYO DISNEY RESORT, TOKYO, JAPAN 71% 5,800,000 3,400,000 14,650,000
5 UNIVERSAL STUDIOS JAPAN, OSAKA, JAPAN 12% 5,500,000 4,901,000 14,500,000
DISNEY'S ANIMAL KINGDOM AT WALT DISNEY WORLD, LAKE BUENA
6 VISTA, FL, U.S.
73% 7,194,000 4,166,000 13,888,000
7 EPCOT AT WALT DISNEY WORLD, LAKE BUENA VISTA, FL, U.S. 92% 7,752,000 4,044,000 12,444,000
8 CHIMELONG OCEAN KINGDOM, HENGQIN, CHINA 55% 7,452,000 4,797,000 11,736,000
DISNEY'S HOLLYWOOD STUDIOS AT WALT DISNEY WORLD,
9 LAKE BUENA VISTA, FL, U.S.
134% 8,589,000 3,675,000 11,483,000
10 SHANGHAI DISNEYLAND AT SHANGHAI DISNEY RESORT, SHANGHAI, 54% 8,480,000 5,500,000 11,210,000
11 UNIVERSAL STUDIOS FLORIDA AT UNIVERSAL ORLANDO, FL, U.S. 119% 8,987,000 4,096,000 10,922,000
UNIVERSAL'S ISLANDS OF ADVENTURE AT UNIVERSAL ORLANDO,
12 FL, U.S.
127% 9,077,000 4,005,000 10,375,000
2021 attendance trends were largely
due to agency restrictions limiting
operating days and capacities in the
COVID-19 pandemic. Therefore, we
have kept the 2019 rankings in place
for the 2021 report.
14 2021TEA / AECOM
© 2020ATTENDANCE
ATTENDANCE
ATTENDANCE
% CHANGE
2019 RANK
% CHANGE
2020-2021
LOCATION
2020-2021
PARK
2021
2020
2019
DISNEYLAND CALIFORNIA ADVENTURE PARK AT DISNEYLAND
13 RESORT, 159% 4,977,000 1,919,000 9,861,000
ANAHEIM, CA, U.S.
DISNEYLAND PARK AT DISNEYLAND PARIS, MARNE-LA-VALLEE,
14 FRANCE
34% 3,500,000 2,620,000 9,745,000
15 UNIVERSAL STUDIOS HOLLYWOOD, UNIVERSAL CITY, CA, U.S. 324% 5,505,000 1,299,000 9,147,000
16 EVERLAND, GYEONGGI-DO, SOUTH KOREA 34% 3,710,000 2,760,000 6,606,000
17 LOTTE WORLD, SEOUL, SOUTH KOREA 58% 2,460,000 1,560,000 5,953,000
18 NAGASHIMA SPA LAND, KUWANA, JAPAN 50% 3,600,000 2,400,000 5,950,000
19 EUROPA-PARK, RUST, GERMANY 20% 3,000,000 2,500,000 5,750,000
20 OCEAN PARK, HONG KONG SAR -36% 1,400,000 2,200,000 5,700,000
21 HONG KONG DISNEYLAND, HONG KONG SAR 65% 2,800,000 1,700,000 5,695,000
DE EFTELING, EFTELING THEME PARK RESORT, KAATSHEUVEL,
22 NETHERLANDS
14% 3,300,000 2,900,000 5,260,000
WALT DISNEY STUDIOS PARK AT DISNEYLAND PARIS, MARNE-LA-
23 VALLEE, FRANCE
34% 1,884,000 1,410,000 5,245,000
24 OCT HAPPY VALLEY, BEIJING, CHINA 25% 4,930,000 3,950,000 5,160,000
25 CHIMELONG PARADISE, GUANGZHOU, CHINA 45% 3,890,000 2,681,000 4,905,000
TOP 25 TOTAL ATTENDANCE 2021 70% 141,351,000 83,258,000 253,724,000
TOP 25 TOTAL ATTENDANCE AS % OF 2019 (PRE-PANDEMIC) 56%
© 2021 TEA / AECOM
70% 141.4m 83.3m
Top 25 amusement/theme parks Top 25 amusement/theme parks Top 25 amusement/theme parks
worldwide attendance change worldwide attendance 2021 worldwide attendance 2020
2020–21
2021TEA / AECOM
© 2020 15Top 25
Amusement/Theme Parks
Worldwide
NETHERLANDS
1 PARK
3.3m
22
15 3
19.0m 2
23
5.4m
14
13
FRANCE
CALIFORNIA, U.S.
12 2 PARKS
3 PARKS 1
11
54.3m
9
6 FLORIDA, U.S.
6 PARKS
7
Key
100%
attendance change at the ranked
n/a - undefined park versus all other ranked parks.
change
16 © 2020
2021 TEA / AECOMSOUTH KOREA
17
2 PARKS
GERMANY
6.2m
16
1 PARK
3.0m 8 3
25
4
19
CHINA
4 PARKS 24.8m 21.2m
24 JAPAN
10
5 18 4 PARKS
21
4.2m 20 HONG KONG
2 PARKS
70% 141.4m 83.3m
Top 25 amusement/theme parks Top 25 amusement/theme parks Top 25 amusement/theme parks
worldwide attendance change worldwide attendance 2021 worldwide attendance 2020
2020–21
2021 TEA / AECOM
© 2020 17The Americas
A New Normal... or a Moment
in Time?
As many expected, 2021 was a year of recovery from the
COVID-19 pandemic.
This was true for theme parks and water parks in North and South America,
albeit uneven depending on government protocols, strength of local and
tourist markets, and the individual strategies pursued by park operators.
However, as vaccine rollout expanded, capacity restrictions loosened, and
consumers’ attitudes towards traveling and gathering shifted, one pattern
seemed to ring true across the board: that attendance trended upward from
the beginning of 2021 to the end of the year.
The 2021 post-Covid recovery story for theme parks and water parks in the
Americas is marked by several major trends. Some of these trends emerged
as operators reacted to an ever-changing web of government restrictions
and diverse ideas on what consumer behavior and societal priorities should
be in a pandemic; but some of these trends may be viewed as an accelerated
response to cultural and generational shifts long in the making. The trends in
the following pages characterize the Americas in 2021, but the jury is still out if
they point to a new normal in the way we operate and experience theme parks,
or if they just capture this moment in time.
Francisco Refuerzo
Senior Analyst,
AECOM Economics + Advisory
18Avengers Campus at
Disneyland Resort, Anahaim, California
© Disney
19places. The year 2021 got off to a rocky
Rollercoaster of Recovery start for theme park attendance as some
parks were closed and others operated
Summer 2020 saw a downward trend in under government- or self-imposed
COVID-19 cases, ushering in a period of capacity restrictions. But attendance
hope for the theme park industry as some accelerated quickly around the start of the
governments cautiously allowed theme summer season, and by the last quarter of
parks to reopen with varying degrees of 2021 some park operators were reporting
capacity restrictions. Holiday spikes and attendance that reached pre-pandemic
new variants would soon bring a new wave levels.
of closures and lockdowns that prevented
large events and indoor gathering in some
Shark Encounter at SeaWorld,
San Diego, California
© SeaWorld Entertainment
20By July 2021, all of the top 20 theme and had last been open in 2019. Provincial
parks in North America were in operation, policies provided the park with several
and their collective attendance for 2021 false starts for reopening in 2021, pushing
amounted to 136% year-over-year growth, the date from May to June to July, and
the biggest gain for theme parks across leaving fans frustrated. Mexico also had
the other major regions. The top 20 water strong park restrictions—Six Flags Mexico
parks in North America had an even suspended operations in December 2020,
stronger showing with collective 2021 but reopened in March 2021 with the
attendance up by 177% over 2020. Latin government allowing operations at 20%
America’s top theme parks and water capacity and limiting visitor access to
parks posted attendance growth of 54% outdoor areas only.
and 74%, respectively, over the previous
year—less shocking than triple-digit The US market stood out with theme park
growth, yet anything but modest. attendance increasing by 134% over 2020
figures. US theme park attendance was at
Major operators had the difficult task 67% of 2019’s peak numbers.
of navigating layers of government
restrictions and supporting the reopening
of multiple parks, sometimes under wildly
different state policies and timelines.
Comparing Universal’s Florida and
California parks offers a clear example.
All of Universal’s Orlando and Hollywood
parks operated without capacity limits in
the third quarter of 2021, but Florida had
104.4m
state-level restrictions lifted earlier in the Top 20 theme parks in
North America attendance 2021
year, resulting in those parks performing
better.
Canada’s Wonderland was the last theme 44.3m
park in the North America top 20 to start Top 20 theme parks in
operations in 2021 and was also closed North America attendance 2020
longer than any park on the region’s
list—the park typically closes for winter
Major operators had the difficult
task of navigating layers of
government restrictions and
supporting the reopening of
multiple parks, sometimes under
wildly different state policies and
timelines.
21Cedar Fair's Grand Carnivale
© Cedar Fair
Homecoming in the recovery. Nearly every major park
took pandemic closures as an opportunity
Theme parks placed extra emphasis on their to review and rethink their approach to
local markets in 2021, an effort to build up season passes. Some operators like Six
a loyal and lucrative base of repeat visitors. Flags offered steep discounts to their pass
In some ways, the pandemic strengthened program to entice people to come back.
theme parks as a regional destination, a Others, like Disney, completely revamped
nostalgic, affordable, and safe outdoor their season passes and raised prices in
alternative to destinations that require the process. Universal Orlando offered
traveling. ticketing and pass deals aimed at Florida
residents in an effort to make up for the lack
International attendance, a factor for many of international traffic. The focus on season
of the destination parks, has been slower to pass sales were largely effective. SeaWorld
recover. Until mid-2022, complicated COVID Entertainment, for example, saw a 10% drop
testing requirements hindered international in general attendance from 2019 to 2021,
travel to many destinations, including the but their season pass base was only down
US. According to Visit Orlando, international 3% for the same time frame.
traffic made up 9% of visitors in 2019; in
2021 it was 4%. Not surprisingly, combined Cedar Fair's Ohio parks (Cedar Point and
domestic and international travel to Kings Island) were very successful in 2021,
Orlando in 2021 was at 78% of 2019 levels, likely due to a combination of fewer opening
which aligns with attendance percentage restrictions and active local markets. Both
reporting from central Florida’s theme parks. were certainly helped by their reputations as
International traffic is expected to return to regional destination parks. Visitors still not
pre-pandemic levels near the end of 2022, ready to hop on an airplane were likely more
although a strengthening US dollar makes willing to take a road trip to a high-profile
travel more expensive for overseas visitors regional park. Cedar Point also offered a new
planning to visit the parks on our Top 20 list. season pass program that functioned more
like a regional pass, extendeding its reach
Season passes played an important role beyond core markets.
22Betting Big on the DreamWorks Destination attraction,
where guests can meet and interact with
Intellectual Property DreamWorks characters. Universal Studios
Hollywood opened the Thea-awarded
The dependence on Intellectual Property Secret Life of Pets dark ride, which was
(IP) within the industry is expanding. Long ready in 2020 but held until more favorable
a staple in major park attractions, IP is operating conditions. That park saw a
emerging in other forms of entertainment 323% increase over 2020.
like family entertainment centers,
waterparks, cafes, and hotels. Following
its successful 2019 debut of the Star Unexpected COVID
Wars: Galaxy's Edge themed area, Disney
launched the Avengers Campus at Side-effects
California Adventure in 2021, with planned
campuses opening in Paris (2022) and Since 2020, parks have had to think quick
Hong Kong (2023). and make serious adjustments to their
operations to safely acommodate visitors,
IP is becoming increasingly important Parks had to adapt to find operational
in the way we connect with and create efficiencies. Technologies like touchless
experiences at theme parks. Consumers payment and digital queueing were
have strong connections with IP that introduced to help comply with COVID
transcend continents. Super Nintendo protocols but they also provided better
World opened at Universal Studios experiences for guests and tended to
Japan in 2021 to rave reviews and will be increase per capita spending. Though parks
replicated at its Hollywood and future Epic were already heading in this direction, the
Universe parks. The park also opened pandemic accelerated the trend.
Secret Life of Pets: Off the Leash, Universal Studios Hollywood
© Universal Parks & Resorts
23Fantasilandia, Santiago, Chile
© Fantasilandia
Dynamic pricing and advance reservation Just before the pandemic, Six Flags
systems were a way for parks to regulate announced a transformation plan to
attendance in their limited capacities, but modernize its guest experience and re-
have also proven to increase profitability. invigorate growth, but it has since used
Consumers have become accustomed the time to assess some of its previous
to advanced ticketing systems during the products and strategies, such as pricing
pandemic. and membership programs, finding
that discounted ticketing was great
Labor availability and cost continued to for attendance but attracted too many
be an issue for operators in 2021. Many teenagers with limited in-park spending
parks enhanced their recruitment offerings potential. In addition to spending $122
or turned to technology. Kings Dominion million on new projects and attractions in
adjusted their operating schedule to 2022, the operator is now making changes
account for the reduced workforce, while to operations and products, hoping that a
SeaWorld implemented automation where "customer-obsessed" culture will improve
possible to reduce the need for workers. its competitive position.
Parks took this time to evaluate how to
improve the guest experiences and make Hey, big spender
strategic investments in order to maintain
or enhance their market position. Sea World Despite lower attendance levels relative
launched new iOS and Android apps in to 2019, reported revenues continue to
2021 for each of its parks, but unlike other rival and in some cases surpass equivalent
operators, SeaWorld chose to delay nearly quarters from 2019. Financial reports
all their capital investments for 2020 and indicated dramatic increases in per
2021 until 2022. The decision has paid off capita spending at 19 of the top 20 North
in the longer term as the chain has seen American parks. The increase was in part
strong attendance gains for 2022. due to pent-up demand from park closures
during the pandemic, increased savings
from less travel and entertainment costs
24during lockdown, and inflation. will allow parks to invest in new attractions
and experiences that keep visitors coming
But the parks have also figured out how back. Whether increased spending
to increase revenues: they adjusted their represents a lasting evolution in consumer
pricing, promoted advance ticket sales, behavior or if it was just a side-effect of
and offered new and elevated merchandise recovering from a pandemic may not matter,
and food options. In Q4, Walt Disney because these parks have weathered the
World debuted Genie+, an automated app perfect storm, and in the process have
that provides personalized itineraries for become really savvy at giving guests what
guests, effectively replacing the resort’s they want.
free FastPass program with a tiered system
that offers a base level of complimentary
services and paid premium access for North America Theme
additional benefits.
Parks
This trend is probably the most significant
from an operational standpoint. Increased There were a few big anniversaries in 2021.
spending will generate revenue growth that Disney began celebrating the Walt Disney
World Resort’s 50th anniversary in October
of 2021 with the debut of Remy’s Ratatouille
Adventure dark ride in the France pavilion
at Epcot. New evening spectaculars,
Financial reports indicated Disney Enchantment at Magic Kingdom
and Harmonious at Epcot, also opened
dramatic increases in per to celebrate the milestone. Cedar Point
capita spending at 19 of the reached 150 years in 2020, but its major
top 20 North American celebrations were postponed to 2021.
Additionally, Knott's Berry Farm celebrated
parks. its 100th anniversary in 2021.
Legoland New York is the most significant
theme park to debut in 2021. Although it is
Legoland's first US park opening in 20 years,
attention surrounding its opening seems
to have been overshadowed by COVID-19
media coverage and other world events.
SeaWorld redeveloped its Aquatica San
Diego property into Sesame Place San
Diego, which opened in 2022. Universal's
debut of the high-speed Jurassic Park-
themed Velocicoaster at Islands of
Adventure in Orlando helped to boost
attendance at that park ahead of Universal
Studios Florida. Parks in development
include Universal's Epic Universe in Orlando,
set to open in 2025.
Reef Plunge at Aquatica,
Orlando, Florida
© SeaWorld Entertainment
25US, in part because there is not a dominating
Latin America Theme group of large operators in the region.
Parks A notable exception includes Mexico-based
operator Grupo Xcaret, which is set to open
Two of Latin Americas top 10 theme parks Xibalbá Park in 2022. This new park will join a
were permanently closed in 2021. La Feria growing ecosystem of seven existing parks
de Chapultapec in Mexico City closed in along the Riviera Maya, the flagship of which
2019 and is being redeveloped as Parque is Xcaret Park, the third-ranked theme park in
Urbano Aztlan, a new amusement park and Latin America. Grupo Xcaret's properties are
public space that offers free admission, part theme park, part water park, and part
although some attractions will require nature park - a concept that they continue
visitor payment. The other park is Parque to expand with significant investments. The
Plaza Sesamo in Monterrey, which has been operator opened two new luxury adults-only
rebranded as Parque Fiesta Aventuras. hotels in 2021, part of its plan to expand to
5,400 rooms in seven years.
Six Flags Mexico City remains a top park
in the region after debuting Crazanity, the Major investments in hotels and parks
world’s largest pendulum ride, reaching are also being developed across the
a record height of 50 meters and speeds Caribbean. In the Bahamas, Baha Bay, a
of 120kph. Beto Carreo World, which has 15-acre beachfront waterpark t attached to
held the title of largest theme park in Latin the all-incusive Baha Mar Resort, opened in
America, achieved another superlative in 2021. In the Dominican Republic, work began
2021—its estimated attendance of 1.90 on El Dorado Park , which is being billed as
million is the highest amongst the top 10 the largest water park compound in the
theme parks in the region. Caribbean.
Water Parks
In general, individual water parks did
10.7m
Top 20 water parks in
better than theme parks because their North America attendance 2021
shorter seasons more closely aligned
3.8m
with increased vaccine availability, easing
of COVID restrictions, and pre-Omicron
optimism. Top 20 water parks in
North America attendance 2020
In the US, the top two waterparks are at
Disney World Resort. Disney made the
strategic decision to close one during the
7.0m
pandemic years and operate the other to
cut costs. The #1 park in 2019, Typhoon
Lagoon was closed for all of 2020 and 2021. Top 10 water parks in
At the start of 2022, Blizzard Beach closed Latin America attendance 2021
and Typhoon Lagoon reopened.
In Latin America, water parks compete more 4.0m
evenly with theme parks than they do in the Top 10 water parks in
Latin America attendance 2020
26Typhoon Texas, Katy, TX
© Pyek Group
Beach Park, Aquiraz, Brazil
© Beach Park
27Top 20
Amusement/Theme Parks
North America
.6m ONTARIO, CANADA
1 PARK
13
20 15
MIDWEST U.S.
3 PARKS
8.8m
18
17 5.9m NORTHEAST U.S.
2 PARKS
19
CALIFORNIA, U.S. 16
12
6 PARKS 14
2 10 1
11 28.6m 7
60.6m
FLORIDA, U.S.
8 PARKS
3
9
8
6
4
5
2021 attendance trends
Key
were largely due to agency Circles represent size of
100%
by number. Shading indicates
attendance change at the ranked
in place for the 2021 report. n/a - undefined park versus all other ranked parks.
change
28 © 2020
2021 TEA / AECOMATTENDANCE
ATTENDANCE
ATTENDANCE
% CHANGE
2019 RANK
2020-2021
LOCATION
PARK
2021
2020
2019
MAGIC KINGDOM THEME PARK AT WALT DISNEY WORLD RESORT,
1 LAKE BUENA VISTA, FL, U.S.
83% 12,691,000 6,941,000 20,963,000
2 DISNEYLAND PARK AT DISNEYLAND RESORT, ANAHEIM, CA, U.S. 133% 8,573,000 3,674,000 18,666,000
DISNEY'S ANIMAL KINGDOM AT WALT DISNEY WORLD, LAKE
3 73% 7,194,000 4,166,000 13,888,000
BUENA VISTA, FL, U.S.
4 EPCOT AT WALT DISNEY WORLD, LAKE BUENA VISTA, FL, U.S. 92% 7,752,000 4,044,000 12,444,000
DISNEY'S HOLLYWOOD STUDIOS AT WALT DISNEY WORLD,
5 LAKE BUENA VISTA, FL, U.S.
134% 8,589,000 3,675,000 11,483,000
6 UNIVERSAL STUDIOS FLORIDA AT UNIVERSAL ORLANDO, FL, U.S. 119% 8,987,000 4,096,000 10,922,000
UNIVERSAL'S ISLANDS OF ADVENTURE AT UNIVERSAL
7 127% 9,077,000 4,005,000 10,375,000
ORLANDO, FL, U.S.
DISNEY CALIFORNIA ADVENTURE PARK AT DISNEYLAND
8 159% 4,977,000 1,919,000 9,861,000
RESORT, ANAHEIM, CA, U.S.
9 UNIVERSAL STUDIOS HOLLYWOOD, UNIVERSAL CITY, CA, U.S. 324% 5,505,000 1,299,000 9,147,000
10 SEAWORLD ORLANDO, ORLANDO, FL U.S. 91% 3,051,000 1,598,000 4,640,000
11 KNOTT'S BERRY FARM, BUENA PARK, CA U.S. 354% 3,681,000 811,000 4,238,000
12 BUSCH GARDENS TAMPA BAY, TAMPA, FL U.S. 149% 3,210,000 1,288,000 4,180,000
13 CANADA'S WONDERLAND, MAPLE, ONTARIO, CANADA - 587,000 - 3,950,000
14 SEAWORLD SAN DIEGO, SAN DIEGO, CA, U.S. 146% 2,800,000 1,139,000 3,731,000
15 CEDAR POINT, SANDUSKY, OH, U.S. 187% 3,327,000 1,020,000 3,610,000
16 SIX FLAGS MAGIC MOUNTAIN, VALENCIA, CA, U.S. 344% 3,047,000 686,000 3,521,000
17 KINGS ISLAND, KINGS ISLAND, OH, U.S. 96% 3,181,000 1,626,000 3,485,000
18 SIX FLAGS GREAT ADVENTURE, JACKSON, NJ, U.S. 387% 2,913,000 598,000 3,451,000
19 HERSHEYPARK, HERSHEY, PA, U.S. 75% 3,012,000 1,717,000 3,384,000
20 SIX FLAGS GREAT AMERICA, GURNEE, IL, U.S. - 2,675,000 - 3,169,000
TOP 20 TOTAL ATTENDANCE 2021 136% 104,427,000 44,302,000 159,108,000
TOP 20 TOTAL ATTENDANCE AS% OF 2019 (PRE-PANDEMIC) 66%
© 2021 TEA / AECOM
136% 104.4m 44.3m
Top 20 amusement/theme Top 20 amusement/theme Top 20 amusement/theme
parks North America parks North America parks North America
attendance change attendance 2021 attendance 2020
2020–21
2021 TEA / AECOM
© 2020 29Top 10
Amusement/Theme Parks
Latin America
3
1.1m MEXICO
1 2 PARKS
9 1.1m COLOMBIA
7 2 PARKS
GUATEMALA
1 PARK .4m
4
BRAZIL
1 PARK
1.9m
1 PARK
CHILE
.6m 2
8
.4m ARGENTINA
1 PARK
10
2021 attendance trends
Key
were largely due to agency Circles represent size of
100%
by number. Shading indicates
attendance change at the ranked
in place for the 2021 report. n/a - undefined park versus all other ranked parks.
change
30 © 2020
2021 TEA / AECOMATTENDANCE
ATTENDANCE
ATTENDANCE
% CHANGE
2019 RANK
2020-2021
LOCATION
PARK
2021
2020
2019
1 SIX FLAGS MEXICO, MEXICO CITY, MEXICO 60% 1,125,000 701,000 2,803,000
2 BETO CARRERO WORLD, SANTA CATARINA, BRAZIL 51% 1,895,000 1,252,000 2,241,000
3 PARQUE XCARET, CANCUN, MEXICO 50% 1,104,000 736,000 1,960,000
4 MUNDO PETAPA, GUATEMALA CITY, GUATEMALA 50% 402,000 268,000 1,330,000
5 LA FERIA DE CHAPULTEPEC, MEXICO CITY, MEXICO - - - 1,306,000
6 PLAZA DE SESAMO, MONTERREY, MEXICO - - - 1,173,000
7 PARQUE MUNDO AVENTURA, BOGOTÁ, COLOMBIA 83% 631,000 344,000 1,151,000
8 FANTASIALANDIA, SANTIAGO, CHILE 43% 615,000 430,000 1,100,000
9 THEME PARQUE NACIONAL DEL CAFÉ, QUINDIO, COLOMBIA 50% 482,000 321,000 1,043,000
10 PARQUE DE LA COSTA, BUENOS AIRES, ARGENTINA 50% 395,000 263,000 968,000
TOP 10 TOTAL ATTENDANCE 2021 54% 6,649,000 4,315,000 15,075,000
TOP 10 TOTAL ATTENDANCE AS % OF 2019 (PRE-PANDEMIC) 44%
© 2021 TEA / AECOM
54% 6.6m 4.3m
Top 10 amusement/theme Top 10 amusement/theme parks Top 10 amusement/theme parks
parks Latin America attendance Latin America attendance 2021 Latin America attendance 2020
change 2020-21
2021 TEA / AECOM
© 2020 31Top 20
Water Parks
North America
.7m 13 NORTHEAST U.S.
2 PARKS
18
MIDWEST U.S.
2 PARK 20
.8m 16
1.3m
19 6 SOUTHERN U.S.
TEXAS, U.S. 15 2 PARKS
5 PARKS
14
5 12
11 2.9m
7
2
9
8
4.6m FLORIDA, U.S.
4 PARKS
4
3
2021 attendance trends
Key
were largely due to agency Circles represent size of
100%
by number. Shading indicates
attendance change at the ranked
in place for the 2021 report. n/a - undefined park versus all other ranked parks.
change
32 © 2020
2021 TEA / AECOMATTENDANCE
ATTENDANCE
ATTENDANCE
% CHANGE
2019 RANK
2020-2021
LOCATION
PARK
2021
2020
2019
DISNEY'S TYPHOON LAGOON WATER PARK AT WALT DISNEY WORLD
1 RESORT, ORLANDO, FL, U.S.
- - - 2,248,000
2 DISNEY'S BLIZZARD BEACH WATER PARK AT WALT DISNEY WORLD
280% 1,201,000 316,000 1,983,000
RESORT, ORLANDO, FL, U.S.
3 UNIVERSAL'S VOLCANO BAY, ORLANDO, FL, U.S. 207% 1,691,000 551,000 1,811,000
4 AQUATICA, ORLANDO, FL, U.S. 117% 1,147,000 528,000 1,533,000
5 SCHLITTERBAHN, NEW BRAUNFELS, TX, U.S. 97% 888,000 451,000 996,000
6 WATER COUNTRY USA, WILLIAMSBURG, VA, U.S. - 700,000 - 736,000
7 ADVENTURE ISLAND, TAMPA, FL, U.S. 374% 593,000 125,000 656,000
8 AQUATICA SAN ANTONIO, SAN ANTONIO, TX, U.S. 123% 586,000 263,000 651,000
9 SCHLITTERBAHN, GALVESTON, TX, U.S. 19% 402,000 337,000 567,000
10 SPLISH SPLASH, CALVERTON NY, U.S. - - - 542,000
11 SIX FLAGS-HURRICANE HARBOR, ARLINGTON, TX, U.S. 60% 377,000 235,000 538,000
12 SIX FLAGS WHITE WATER ATLANTA, MARIETTA, GA, U.S. 55% 368,000 238,000 526,000
13 SIX FLAGS HURRICANE HARBOR, JACKSON, NJ, U.S. 427% 448,000 85,000 482,000
14 TYPHOON TEXAS, KATY, TX, U.S. 67% 340,000 203,000 478,000
15 SIX FLAGS HURRICANE HARBOR SPLASHTOWN, SPRING, TX, U.S. - 333,000 - 475,000
16 ZOOMBEZI BAY, POWELL, OH, U.S. 112% 373,000 176,000 466,000
17 SIX FLAGS HURRICANE HARBOR PHOENIX, GLENDALE, AZ, U.S. - 309,000 - 441,000
18 CAMELBEACH, TANNERSVILLE, PA, U.S. 49% 225,000 151,000 439,000
19 DOLLYWOOD'S SPLASH COUNTRY, PIGEON FORGE, TN, U.S. 49% 281,000 188,000 433,000
20 CEDAR POINT SHORES, SANDUSKY, OH, U.S. - 402,000 - 424,000
TOP 20 TOTAL ATTENDANCE 2021 177% 10,664,000 3,847,000 16,425,000
TOP 20 ATTENDANCE AS % OF 2019 (PRE-PANDEMIC) 70%
177% 10.7m 3.8m
Top 20 water parks North Top 20 water parks North Top 20 water parks North
America attendance change America attendance 2021 America attendance 2020
2020-21
2021 TEA / AECOM
© 2020 33Top 10
Water Parks
Latin America MEXICO
1 PARK
.4m
10
1.3m
BAHAMAS
1 PARK
2
GUATEMALA
1 PARK .6m
4
.6m COLOMBIA
1 PARK
6
BRAZIL
6 PARKS
9
8 1
7 4.1m
5
3
2021 attendance trends
Key
were largely due to agency Circles represent size of
100%
by number. Shading indicates
attendance change at the ranked
in place for the 2021 report. n/a - undefined park versus all other ranked parks.
change
34 © 2020
2021 TEA / AECOMATTENDANCE
ATTENDANCE
ATTENDANCE
% CHANGE
2019 RANK
2020-2021
LOCATION
PARK
2021
2020
2019
1 THERMAS DOS LARANJAIS, OLIMPIA, BRAZIL 28% 1,179,000 922,500 1,845,000
2 BAHAMAS AQUAVENTURE WATER PARK, PARADISE ISLAND 157% 1,269,000 494,000 1,813,000
(NASSAU, NEW PROVIDENCE), BAHAMAS
3 HOT PARK RIO QUENTE, CALDAS NOVAS, BRAZIL 27% 933,000 734,500 1,469,000
PARQUE ACUATICO XOCOMIL, SAN MARTÍN ZAPOTITLÁN, RETALHULEU,
4 417% 626,000 121,000 894,000
GUATEMALA
5 BEACH PARK, AQUIRAZ, BRAZIL 60% 500,000 312,000 890,000
6 PISCILAGO, GIRARDOT (BOGOTA), COLOMBIA 98% 609,000 307,000 876,000
7 MAGIC CITY WATER PARK, SUZANO, BRAZIL 32% 467,000 355,000 681,000
8 THERMAS WATER PARK, SÃO PEDRO, BRAZIL 43% 452,000 315,000 641,000
9 HOT BEACH, OLYMPIA, BRAZIL 144% 594,000 243,200 608,000
10 PARQUE ACUATICO EL ROLLO, MORELOS, MEXICO 75% 368,000 210,000 525,000
TOP 10 TOTAL ATTENDANCE 2021 74% 6,997,000 4,014,200 10,242,000
TOP 10 TOTAL ATTENDANCE AS % OF 2019 (PRE-PANDEMIC) 68%
© 2021 TEA / AECOM
74.0% 7.0m 4.0m
Top 10 water parks Top 10 water parks Top 10 water parks
Latin America attendance Latin America attendance Latin America attendance
change 2020–21 2021 2020
2021TEA / AECOM
© 2020 35Asia-Pacific
Industry recovery from the pandemic in the APAC
region was uneven, compared to other parts of the
world. In 2021 governments across the region responded
differently to new variants of COVID-19. Some countries
alternated between opening and closing parks.
Others were able to operate nearly the whole year - although with restricted
daily attendance. Shanghai Disneyland, for example, only closed for two days in
2021 but had strict daily capacity limits in place most of the year.
Generally, when restrictions were lifted people returned to attractions. If the
timing coincided with holidays or vacation periods, attractions benefited even
more. International and regional travel restrictions continued to impact the pool
of tourists any given park could attract. Attractions that typically source a more
local audience were able to do better than those that rely on visitors from afar.
Around the region, attendance was anywhere from 40%-80%, averaging 50%,
of 2019 levels.
Looking ahead, it’s not certain when a return to normal travel patterns will
resume, particularly in China. In 2022 Shanghai was put in a months-long
lockdown as China doubled down on its zero-COVID policy. As of this writing,
parks and attractions around the region continue to be affected by local
government policies and regional travel restrictions limiting the flow of tourists.
The outlook is more optimistic in Southeast Asia, where countries are aligning
their COVID policies more closely with Europe and North America.
Beth Chang Chris Yoshii
Executive Director – Vice President – Economics,
Economics, Asia‑Pacific Asia-Pacific
36Mickey and Friends celebrate the
20th Anniversary of Tokyo DisneySea
© Disney
37Transformers Metrobase - Decepticoaster
© Universal Parks & resorts.
Asia's theme parks and water parks
The late September 2021 opening of
China Universal Studios Beijing (USB) was
highly anticipated, marking the second
China’s combined attendance numbers major western theme park company to
were about 50 to 55% of pre-pandemic open a resort in mainland China. The
levels, roughly equivalent to the size of market responded positively. Notably,
China’s market share back in 2014-2015. park guests enjoyed interactions with
This is an improvement from 2020 and Megatron, a TRANSFORMERS character
highlights just how rapidly the Chinese well-suited to Beijing’s style of humor. To
attractions market grew in the years leading control the pandemic and ensure a safe
up to the pandemic. winter Olympics, the Beijing government
discouraged domestic tourism to Beijing,
The figures, though a move in the right which negatively impacted USB. The park is
direction, don’t necessarily equate poised to increase its numbers significantly
to a healthy financial recovery. Local once travel restrictions are fully lifted.
governments in China, like some other
countries, offered subsidies to parks that Though not in the ranking charts, the
incentivized deep discounting of tickets. pandemic appears to have initiated one
These subsidies helped artificially boost of the first merger/acquisitions in China’s
attendance in the short term. rapidly growing (though still young) theme
park industry. In December 2021, Haichang
38Group sold four existing parks and one park them. They closed three of their legacy
under development to North Asia private properties and opened four new parks using
equity group MBK Partners. Haichang will this model in 2021, bringing their combined
continue to manage the sold parks for attendance figures to 91% of pre-pandemic
MBK and retains ownership of one park in a levels. This asset light model is expected to
new asset light business model seemingly become commonplace in the future.
favored by other operators, such as
Fantawild.
Japan
OCT Group posted an 11% increase over
2020, approaching 97% of pre-pandemic Disney’s two parks in Japan were subject
levels. The boost came from the addition of to strict attendance limits for most of 2021.
nine new mid-sized properties combined Attendance caps varied throughout the
with the company’s practice of extensive year, being as low as 5,000 guests per park
promotions and complimentary admissions.
Fantawild has continually been expanding
and upgrading their theme entertainment
parks and offerings. Since 2017 Fantawild China’s combined
has focused its efforts on building new
parks for local governments that own the attendance numbers were
properties and pay Fantawild to operate about 50 to 55% of pre-
pandemic levels.
Shanghai Disneyland, Shanghai, China
© Disney
OCT's 5,000-square-meter immersive attraction
based on CCTV's TV show "National Treasure", Jinan
China
39per day at some points. Tokyo DisneySea’s the new land, a free timed entry system
20th anniversary celebration buoyed was introduced. With limits on park entry
attendance significantly by the end of the imposed, the success of the new land has
year. Though only at 40% of pre-pandemic not yet reflected on the attendance number.
levels, guests are eager to return to the Riding on the success of Super Nintendo
parks as attendance caps are lifted. The World, the park is in the process of adding
largest expansion ever for Tokyo DisneySea the world’s first Donkey Kong-themed area,
is well underway. This new land, Fantasy set to open in 2024. The new section will
Springs, will feature Frozen Port, Alice in increase Super Nintendo World by another
Wonderland, Beauty & the Beast, and more. 70%. Additionally, Universal Studios Osaka
The expansion is an indication of the on- maintains a very vibrant and popular annual
going confidence of the Japanese market pass program with local youth making the
as well as the Asian regional destination park a top choice for social outings with
market. friends.
Universal Studios Osaka opened Super
Nintendo World in March, 2021 to great Hong Kong
fanfare and success. This major investment
received very positive reviews and is Ocean Park’s long-awaited indoor/outdoor
expected to continue to be a major draw waterpark opened in September 2021,
for the park, as the gamification elements transforming the property into a multi-gate
incorporated into the land help drive resort. With the waterpark open, Ocean Park
repeat visitation. Due to the popularity of turned its attention to the original theme
Fantawild opened Glorious Orient in mid 2021, showcasing the
country's modern history, Ganzhou China
© Fantawild
40Universal Studios Japan opened Super Nintendo
World in March 2021, Osaka Japan
© Universal Studios
park, initiating a bidding process in 2021 for opened their completely redeveloped
private investors to take over areas of the Castle of Magical Dreams in 2021 and is
property, eventually transforming the lower building a new Frozen-themed land to open
park area into a commercial zone anchored soon. More Marvel theme attractions are
by retail, dining, and entertainment. planned in the future.
Hong Kong Disneyland, deprived of
mainland and international visitors, set Southeast Asia
records for season pass sales as the
park focused on local residents. The park Southeast Asia was dramatically impacted
achieved a nearly 40% penetration rate in by COVID in 2021 which resulted in
the local market, a rather impressive feat, movement restrictions and lockdowns
given that government COVID regulations in many countries. Theme park visitation
there were more strict than any of Disney’s was generally quite muted in the region.
other properties around the world. The Most Southeast Asia countries have
resort also continued along its multi-year now changed their policies and theme
expansion process. Hong Kong Disneyland park visitation is expected to rebound
significantly in 2022.
41Regional Theme Park
Pipeline
Hong Kong Disneyland
The regional pipeline for new investments achieved a nearly 40%
in theme parks and theme park lands
remains strong although delays in opening
penetration rate in the
dates have become common. Genting local market, a rather
SkyWorld opened in February 2022 while impressive feat, given
Legoland Korea opened in May 2022. New
construction is underway for major new
that government COVID
lands at Universal Studios Singapore, Hong regulations there were
Kong Disneyland, Shanghai Disney Resort, more strict than any of
and Tokyo DisneySea, among others.
Legoland has announced three new theme Disney’s other properties
park resorts in China in Shenzhen, Shanghai around the world.
and Chengdu.
In contrast, theme park projects by Chinese 50-55%
real estate developers have largely been China’s combined attendance
suspended as financial troubles limit new numbers were about 50 to 55% of
construction projects.
pre-pandemic levels
Follow your Dreams, a castle stage show launched in 2021 at
Hong Kong Disneyland to celebrate the newly opened Castle of
Magical Dreams.
© Disney
42Water parks In Korea, water park attendance was mixed
with some showing a rebound in visitation
Water parks in the region were subject and others a decline.
to many of the same COVID restrictions
as theme parks. As governments relaxed Somewhat of an outlier, Malaysia water
policies, demand spiked. Countries that kept parks saw guests returning in larger groups.
restrictions in place negatively impacted Unlike elsewhere in the region, groups of 10-
water parks. Several parks in China, Korea 20 people began using the parks for family
and Indonesia saw attendance levels reunions, further increasing demand for the
plummet further from 2020 levels as COVID reopened water park market.
variants affected their regions.
Interestingly, how water parks are utilized
In contrast, Atlantis Aquaventure Sanya in the region may be shifting as well.
actually saw an attendance benefit from Throughout Asia water parks are often
COVID. With Chinese nationals unable to used for couple outings: a dating excursion
leave the country, many of China’s wealthy rather than a family getaway. Water parks
traveled to Hainan Island for recreation are responding to this, creating evening
and duty-free luxury shopping. However, events that feature shows and live music
renewed lockdown restrictions in China guests can enjoy while relaxing in the water.
during 2022 will impact this trend going During the hot summer months, it is not
forward. uncommon for peak attendance to be at
6pm in the evening. Expanding offerings into
the evenings with separate tickets boosts
attendance and revenue.
Popular indoor waterparks had to end the 2021 season early in
respond to COVID restrictions.
© Poseidon Beach Water World, Harbin China
43Regional Waterpark 11.9m
Pipeline Top 20 water parks in
Asia-Pacific attendance 2021
Waterparks remain popular for development
in Asia given their smaller land area and lower
investment costs. Many pipeline projects 21.6m
have been delayed and are awaiting improved Top 20 water parks in
economic conditions to move forward. Asia-Pacific attendance 2019
Nonetheless, trends indicate a fast recovery
of this market.
Poseidon Beach Water Park, Harbin, China
© Poseidon Beach Water Park
44Elaborate night-time performance at Aquaventure Atlantis,
Sanya, Hainan
© Aquaventure Atlantis
45Top 20
Amusement/Theme Parks
Asia-Pacific
7
6.2m 6 SOUTH KOREA
2 PARKS
NORTHERN CHINA
1 PARK
4.9m
11 JAPAN
WESTERN CHINA 4 PARKS
1 PARK
2.9m 8
1
21.2m
18
SOUTHERN CHINA
4 PARKS 16
15
17m 4 3
2
12
20
10 4.2m 9 19
19.3m
5 EASTERN CHINA
5 PARKS
HONG KONG
2 PARKS 17
14
1.2m
13 SINGAPORE
1 PARK
2021 attendance declines
Key
were largely due to agency Circles represent size of
100%
by number. Shading indicates
attendance change at the ranked
in place for the 2021 report. n/a - undefined park versus all other ranked parks.
change
46 © 2020
2021 TEA / AECOMATTENDANCE
ATTENDANCE
ATTENDANCE
(2020-2021)
% CHANGE
2019 RANK
LOCATION
PARK
2021
2020
2019
1 TOKYO DISNEYLAND AT TOKYO DISNEY RESORT, TOKYO, JAPAN 51% 6,300,000 4,160,000 17,910,000
2 TOKYO DISNEYSEA AT TOKYO DISNEY RESORT, TOKYO, JAPAN 71% 5,800,000 3,400,000 14,650,000
3 UNIVERSAL STUDIOS JAPAN, OSAKA, JAPAN 12% 5,500,000 4,901,000 14,500,000
4 CHIMELONG OCEAN KINGDOM, HENGQIN, CHINA 55% 7,452,000 4,797,000 11,736,000
5 SHANGHAI DISNEYLAND AT SHANGHAI DISNEY RESORT,
54% 8,480,000 5,500,000 11,210,000
SHANGHAI, CHINA
6 EVERLAND, SEOUL, SOUTH KOREA 34% 3,710,000 2,760,000 6,606,000
7 LOTTE WORLD, SEOUL, SOUTH KOREA 58% 2,460,000 1,560,000 5,953,000
8 NAGASHIMA SPA LAND, KUWANA, JAPAN 50% 3,600,000 2,400,000 5,950,000
9 OCEAN PARK, HONG KONG SAR -36% 1,400,000 2,200,000 5,700,000
10 HONG KONG DISNEYLAND, HONG KONG SAR 65% 2,800,000 1,700,000 5,695,000
11 OCT HAPPY VALLEY, BEIJING, CHINA 25% 4,930,000 3,950,000 5,160,000
12 CHIMELONG PARADISE, GUANGZHOU, CHINA 45% 3,890,000 2,681,000 4,905,000
13 UNIVERSAL STUDIOS SINGAPORE, SINGAPORE 9% 1,200,000 1,098,000 4,500,000
14 CHINA DINOSAUR PARK, CHANGZHOU, CHINA 5% 2,500,000 2,375,000 4,434,000
15 OCT WINDOW OF THE WORLD, SHENZHEN, CHINA 27% 2,400,000 1,890,000 3,990,000
16 OCT HAPPY VALLEY, SHENZHEN, CHINA 6% 3,310,000 3,120,000 3,980,000
17 ZHENGZHOU FANTAWILD ADVENTURE, ZHENGZHOU, CHINA -20% 2,752,000 3,421,000 3,840,000
18 OCT HAPPY VALLEY, CHENGDU, CHINA 12% 2,940,000 2,620,000 3,580,000
19 NINGBO FANTAWILD ORIENTAL HERITAGE, NINGBO, CHINA 2% 2,308,000 2,257,000 3,575,000
20 OCT HAPPY VALLEY, SHANGHAI, CHINA 21% 3,300,000 2,730,000 3,390,000
TOP 20 TOTAL ATTENDANCE 2021 29% 77,032,000 59,520,000 141,264,000
TOP 20 TOTAL ATTENDANCE AS % OF 2019 (PRE-PANDEMIC) 55%
© 2021 TEA / AECOM
29% 77.0m 59.5m
Top 20 amusement/theme parks Top 20 amusement/theme parks Top 20 amusement/theme parks
attendance change Asia-Pacific Asia-Pacific attendance 2021 Asia-Pacific attendance 2020
2020-21
2021TEA / AECOM
© 2020 47Top 20
Water Parks
Asia-Pacific
19
3
1.1m SOUTH KOREA
4 PARKS
17 8
17
15
13 1
CHINA
9 PARKS 11 8.0m 0.7m JAPAN
9
2 1 PARK
14
5 4
0.3m SINGAPORE
1 PARK
20
MALAYSIA
9 1.7m 5
2 PARKS
1m
16 0.3m 12
7
AUSTRALIA
1 PARK
INDONESIA
2 PARKS
2021 attendance trends
Key
were largely due to agency Circles represent size of
100%
by number. Shading indicates
attendance change at the ranked
in place for the 2021 report. n/a - undefined park versus all other ranked parks.
change
48 © 2020
2021 TEA / AECOMATTENDANCE
ATTENDANCE
ATTENDANCE
(2020-2021)
% CHANGE
2019 RANK
LOCATION
PARK
2021
2020
2019
1 CHIMELONG WATER PARK, GUANGZHOU, CHINA 47% 2,230,000 1,512,000 3,014,000
2 WUHU FANTAWILD WATER PARK, WUHU, CHINA -44% 431,000 770,800 1,348,000
3 CARIBBEAN BAY, SEOUL, SOUTH KOREA 32% 222,000 168,000 1,333,000
4 PLAYA MAYA WATER PARK, WUHAN, CHINA -22% 730,000 930,000 1,210,000
5 AQUAVENTURE ATLANTIS, SANYA, CHINA 0% 1,200,000 1,200,000 1,200,000
SUNWAY LAGOON, KUALA LUMPUR, MALAYSIA 0% 600,000 600,000 1,200,000
7 WET 'N' WILD GOLD COAST, GOLD COAST, AUSTRALIA 2% 970,000 952,000 1,120,000
8 OCEAN WORLD, HONGCHEON, SOUTH KOREA -36% 115,000 180,000 1,071,000
9 POSEIDON BEACH WATER WORLD, HARBIN, CHINA 94% 582,000 299,600 916,700
10 SUNWAY LOST WORLD OF TAMBUN, PERAK, MALAYSIA 0% 600,000 600,000 1,000,000
11 PLAYA MAYA WATER PARK, SHANGHAI, CHINA 26% 1,080,000 860,000 970,000
12 ATLANTIS WATER ADVENTURE, JAKARTA, INDONESIA -82% 30,000 220,000 910,000
13 ZHENGZHOU FANTAWILD WATER PARK, ZHENGZHOU, CHINA -29% 443,000 622,300 905,000
14 SUMMERLAND, TOKYO, JAPAN 43% 650,000 454,000 868,000
15 XIAMEN FANTAWILD WATERPARK, XIAMEN, CHINA 24% 548,000 442,000 832,000
THE JUNGLE WATER ADVENTURE, BOGOR,
16 34% 268,000 200,000 785,000
WEST JAVA, INDONESIA
17 PLAYA MAYA WATER PARK, TIANJIN, CHINA 33% 730,000 550,000 750,000
WOONGJIN PLAYDOCI WATERDOCI, BUCHEON, SOUTH KOREA -36% 93,000 146,000 750,000
19 LOTTE WATER PARK, GIMHAE, SOUTH KOREA -41% 78,000 132,800 740,000
20 ADVENTURE COVE WATER PARK, SINGAPORE -10% 330,000 300,000 710,000
TOP 20 TOTAL ATTENDANCE 2021 8% 11,930,000 11,139,500 21,632,700
TOP 20 TOTAL ATTENDANCE AS % OF 2019 (PRE-PANDEMIC) 55%
© 2021 TEA / AECOM
8% 11.9m 11.1m
Top 20 water parks Asia‑Pacific Top 20 water parks Top 20 water parks
attendance change 2020–21 Asia‑Pacific attendance 2021 Asia‑Pacific attendance 2020
2021 TEA / AECOM
© 2020 49EMEA
The roots of recovery
The seasonal nature of most European attractions
allowed many EMEA parks to enjoy nearly a full season of
operation in 2021. Most closure restrictions were lifted
in Q2, meaning many operators experienced only a slight
delay in opening their gates for the busy summer season.
With Omicron not causing trouble until the end of the year when most parks were
closed, timing was ideal for attractions in the region.Travel restrictions still had an
impact on park operations, so larger destination resorts, mostly on the European
continent, struggled to attract a steady stream of tourists. Domestic parks and
resorts, notably Merlin’s UK portfolio, recovered quickly - some even registering
higher revenues than in 2019.
Jodie Lock
Associate Director – Economics,
EMEA
50You can also read


