GLOBAL MARKET OUTLOOK - @JEFFREYKLEINTOP
←
→
Page content transcription
If your browser does not render page correctly, please read the page content below
Global
Market
Outlook
@JeffreyKleintop
Jeffrey Kleintop, CFA
Chief Global Investment Strategist
Charles Schwab & Co., Inc.
Recession
Watch

Recession Watch
Percent of US Treasury yield curves inverted
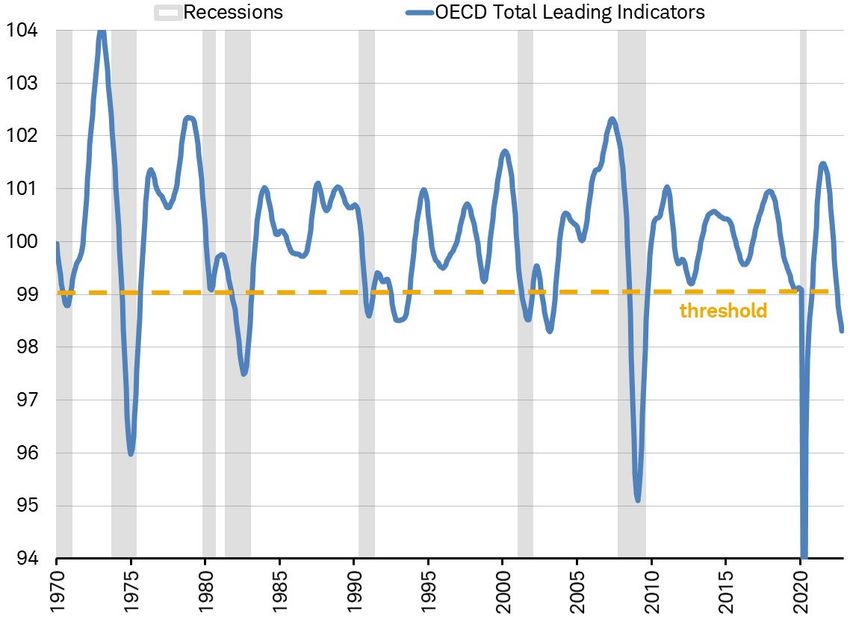
Recession Watch
Global leading indicators point to global recession

         Source: Charles Schwab, Organization for Economic Cooperation and Development, Bloomberg data as of 2/3/2023.
The Three Bears
Bull and bear market trends over the past 72 years show the other three bear periods were in the 1970s.

                                                                                                                                                  Stocks
                                                                                                                                                  S&P 500 until 1970 then MSCI World Index
                                                                                                                                                  In general, a bear market is a decline of 20% or more.

                                                                                                                                                  Bonds
                                                                                                                                                  Bloomberg US Intermediate-Term Government Index Yield to Worst
                                                                                                                                                  In general, a bear market is a sharp or steady rise in yields.

                                                                                                                                                  Real Cash
                                                                                                                                                  3 Month US Treasury Yield less CPI year-over-year % change
                                                                                                                                                  In general, a bear market is when the T-bill yields less than inflation.
 Source: Charles Schwab, Bloomberg data as of 1/11/2023.                                                                                                           Past performance is no guarantee of future results.
 The S&P 500 includes 500 leading US companies and captures approximately 80% coverage of available market capitalization.
 The MSCI World Index captures large and mid-cap representation across 23 Developed Markets countries. With 1,539 constituents, the index covers approximately 85% of the free float-adjusted market capitalization in each country.
 The Bloomberg US Aggregate Bond Index measures the investment grade, US dollar-denominated, fixed-rate taxable bond market and includes Treasuries, government-related and corporate securities, MBS,ABS and CMBS.
 Stock market represented on log scale indexed to 100 on Dec 31, 1969.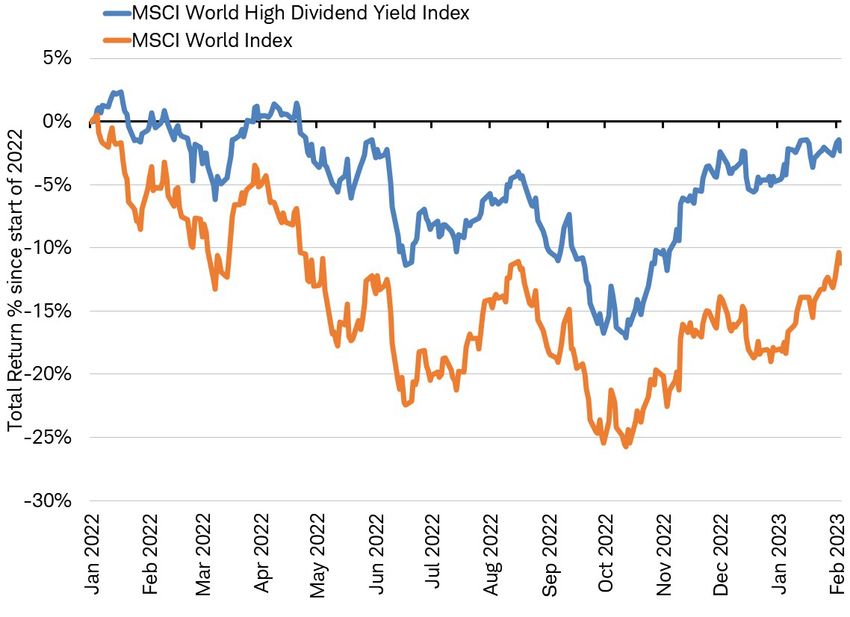
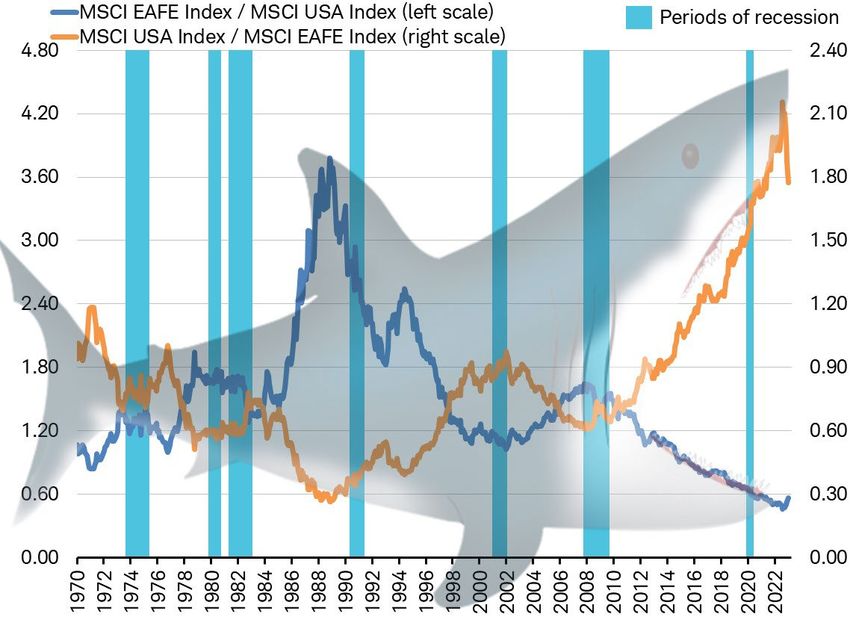
Shark Attack: US and International
    Ratio

                                                                                                                                    Ratio
            Source: Charles Schwab & Co., Inc, Bloomberg data as of 1/19/2023. Past performance is no guarantee of future results
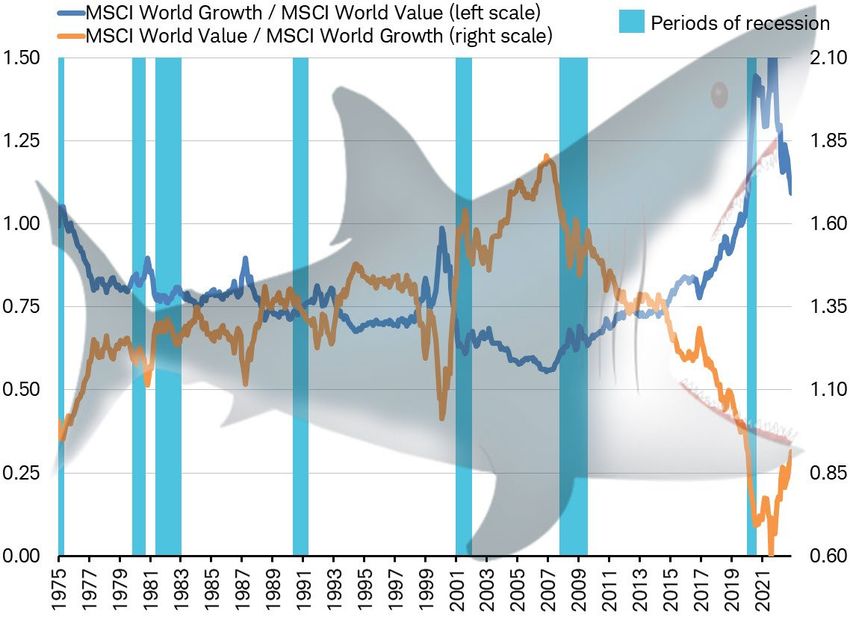
Shark Attack: Growth and Value
    Ratio

                                                                                                                                    Ratio
            Source: Charles Schwab & Co., Inc, Bloomberg data as of 1/11/2023. Past performance is no guarantee of future results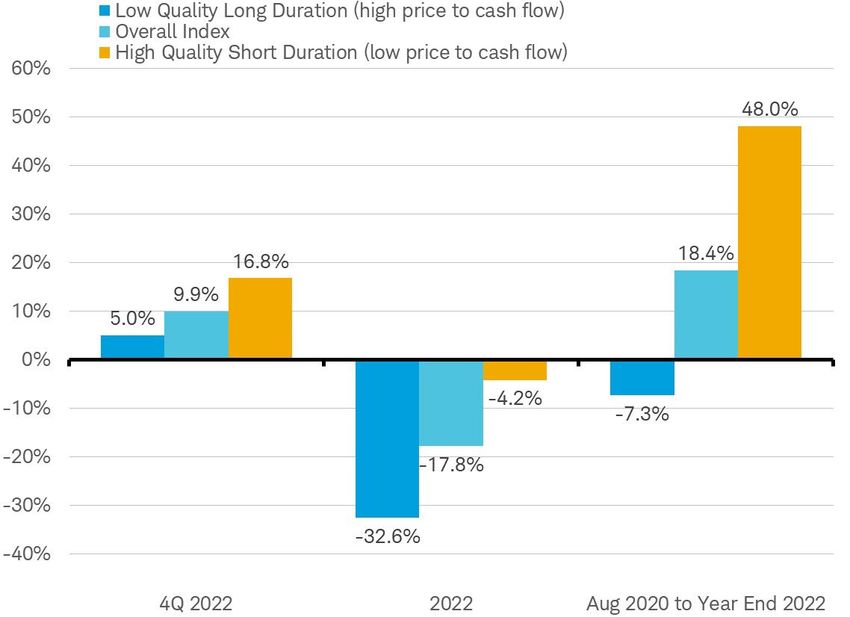
Inflation
Watch

Inflation

                   Energy                                                  Goods        Services
                     8% of CPI                                             35% of CPI    57% of CPI

       Source: Charles Schwab & Co., Inc, Bloomberg data as of 1/12/2023
Inflation
Services -> Housing
*Finland has plans to implement home prices into its CPI calculation. Germany, and the Netherlands are expected to implement owner equivalent rent into their CPI calculation by 2023. Grey bars delineate grouping boundaries.
12 Source: Charles Schwab, various governmental sources, data as of 9/10/22.Rate Hikes
Rate
Hikes
Peaked?
14From Hikes to Cuts
Market expectations for policy rates in 2023
Source: Charles Schwab & Co., Inc., Macrobond data as of 2/3/2023. Forecasts contained herein are for illustrative purposes only, may be based upon proprietary research
15 and are developed through analysis of historical public data2023 Risk: China’s Reopening
China’s economy has seen a zero-COVID drag
     Rebound ready in retail?

                                                                                                               Average
            Source: Charles Schwab, National Bureau of Statistics for China, Bloomberg data as of 1/11/2023.
18
China’s reopening re-flation?
A surge in domestic demand could export inflation to the rest of the world
20Investing Ideas
Ideas
     Short Duration Stocks

              Source: Charles Schwab, Bloomberg data as of 1/11/2023.                                           Past performance is no guarantee of future returns.
23            Long Duration(High price to cash flow) is the top 20% of stocks ranked by price to cash flow of the MSCI World Index. Short Duration (Low price to cash flow) is the
              bottom 20% of stocks ranked by price to cash flow in MSCI World Index. MSCI World Index total return performance measured in US dollars through 1/11/2023
Ideas
High Dividend Paying Stocks
Source: Charles Schwab, Bloomberg data as of 2/3/2023. Past performance is no guarantee of future returns.
MSCI World High Dividend Yield & the MSCI World Index Total Return measured in US dollars.
24Takeaways Consider International – “Shark attacks” may favor international stocks. Short Duration & High Dividends- Stocks with more immediate cash flows, rather than cash flows in the distant future, have outperformed since rates bottomed in 2020. Stocks paying higher than average dividends have outperformed during recessionary bear markets. Housing is key- Global Rate hikes may be nearing a peak but watching housing inflation will be critical to how high and for how long central banks may need to raise interest rates. China is a risk- China’s reopening may be like most other countries’ reopening experiences, with growth accelerating and inflation picking up. If so, it may come at just the point that central banks were planning on pausing their rate hikes.
Thank you

@JeffreyKleintop
Important information
The information provided here is for general informational purposes only and should not be considered an individualized
recommendation or personalized investment advice. The investment strategies mentioned here may not be suitable for everyone.
Each investor needs to review an investment strategy for his or her own particular situation before making any investment decision.
Any individual securities discussed are not personal recommendations for any particular investor or client and do not take into
account individual circumstances, financial situation, investment or other objectives or needs.
All expressions of opinion are subject to change without notice in reaction to shifting market, economic or political conditions. Data
contained herein from third party providers is obtained from what are considered reliable sources. However, its accuracy,
completeness or reliability cannot be guaranteed.
The policy analysis provided by Charles Schwab & Co, does not constitute and should not be interpreted as an endorsement of any
political party
Forecasts contained herein are for illustrative purposes only, may be based upon proprietary research and are developed through
analysis of historical public data.
Please note that this content was created as of the specific date indicated and reflects the author’s views as of that date. It will be
kept solely for historical purposes, and the author’s opinions may change, without notice, in reaction to shifting economic, business,
and other conditions. Supporting documentation for any claims or statistical information is available upon request
The Schwab Center for Financial Research is a division of Charles Schwab & Co., Inc.

@2022 Charles Schwab & Co., Inc. All rights reserved. Member SIPC (0223-37FD)
Disclosures/Definitions
Past performance is no guarantee of future results and the opinions presented cannot be viewed as an indicator of future
performance.
Performance may be affected by risks associated with non-diversification, including investments in specific countries or sectors.
Additional risks may also include, but are not limited to, investments in foreign securities, especially emerging markets, real estate
investment trusts (REITs), fixed income, small capitalization securities and commodities. Each individual investor should consider
these risks carefully before investing in a particular security or strategy
Indexes are unmanaged, do not incur fees or expenses and cannot be invested in directly.
Diversification and rebalancing strategies do not ensure a profit and do not protect against losses in declining markets. Rebalancing
may cause investors to incur transaction costs and, when rebalancing a non-retirement account, taxable events may be created that
may affect your tax liability
Investing involves risk including loss of principal.
International investments involve additional risks, which include differences in financial accounting standards, currency fluctuations,
geopolitical risk, foreign taxes and regulations, and the potential for illiquid markets. Investing in emerging markets may accentuate
these risks.
There are the risks associated with investing in dividend paying stocks, including but not limited to the risk that stocks may reduce or
stop paying dividends.
Commodity-related products carry a high level of risk and are not suitable for all investors. Commodity-related products may be
extremely volatile, illiquid and can be significantly affected by underlying commodity prices, world events, import controls, worldwide
competition, government regulations, and economic conditions.
Bloomberg Index Services Limited. BLOOMBERG® is a trademark and service mark of Bloomberg Finance L.P. and its affiliates
(collectively “Bloomberg”). Bloomberg or Bloomberg’s licensors own all proprietary rights in the Bloomberg Indices. Neither
Bloomberg nor Bloomberg’s licensors approves or endorses this material or guarantees the accuracy or completeness of any
information herein, or makes any warranty, express or implied, as to the results to be obtained therefrom and, to the
maximum extent allowed by law, neither shall have any liability or responsibility for injury or damages arising in connection
therewith.

@2022 Charles Schwab & Co., Inc. All rights reserved. Member SIPC (0223-37FD)
Definitions
 MSCI EAFE Index measures the performance of the large- and mid-cap equity market across 21 developed markets around the
 world, excluding the US and Canada. It is a free float-adjusted market-capitalization weighted index.

 The MSCI World Index measures the performance of the large- and mid-cap equity market across 23 Developed Markets (DM)
 countries, covering approximately 85% of the free float-adjusted market capitalization in each country.

 MSCI World Growth Index captures large and mid cap securities exhibiting overall growth style characteristics across 23 Developed
 Markets (DM) countries. The growth investment style characteristics for index construction are defined using five variables: long-
 term forward EPS growth rate, short-term forward EPS growth rate, current internal growth rate and long-term historical EPS growth
 trend and long-term historical sales per share growth trend.

 MSCI World Value Index captures large and mid cap securities exhibiting overall value style characteristics across 23 Developed
 Markets (DM) countries. The value investment style characteristics for index construction are defined using three variables: book
 value to price, 12-month forward earnings to price and dividend yield.

 The MSCI World High Dividend Yield Index is based on the MSCI World Index, its parent index, and is designed to reflect the
 performance of equities in the parent index (excluding REITs) with higher dividend income and quality characteristics than average
 dividend yields that are both sustainable and persistent.

 @2022 Charles Schwab & Co., Inc. All rights reserved. Member SIPC (0223-37FD)
Definitions
 MSCI USA Index is designed to measure the performance of the large and mid cap segments of the US market, covering
 approximately 85% of the free float-adjusted market capitalization in the US.

 The MSCI China Index captures large and mid cap representation across China A shares, H shares, B shares, Red chips, P chips
 and foreign listings (e.g. ADRs), capturing about 85% of this China equity universe.

 MSCI Emerging Markets Index captures large and mid cap representation across 27 Emerging Markets (EM) countries, covering
 approximately 85% of the free float-adjusted market capitalization in each country.

 S&P 500 Index measures the performance of 500 leading publicly traded U.S. companies from a broad range of industries. It is a
 float-adjusted market-capitalization weighted index.

 S&P GS Commodity Index (GSCI) is a composite index of commodity sector returns representing an unleveraged, long-only
 investment in commodity futures that is broadly diversified across the spectrum of commodities.

 Bloomberg U.S. Intermediate-Term Government Index measures the performance of the U.S. Treasury and U.S. agency debentures
 with maturities of 1-10 years.

 @2022 Charles Schwab & Co., Inc. All rights reserved. Member SIPC (0223-37FD)
Definitions
 Correlation is a statistic that measures the degree to which two datasets move in relation to each other, and range in value between -1.0
 (perfectly opposite movements) to +1.0 (perfectly in sync movements). A value of 0 is defined as being uncorrelated (no association). It is not a
 measure of causality.

 Yield to worst is a measure of the lowest possible yield that can be received on a bond within the terms of its contract sans default, often
 referenced when a bond has provisions that would allow the issuer to pay in full prior to maturity.

 The Consumer Price Index (CPI) measures the monthly change in prices paid by consumers for a weighted basket of goods and services, as a
 measure of price inflation.

 The OCED Total Composite Leading Indicator (CLI) is designed to provide early signals of turning points in business cycles showing fluctuation of
 the economic activity around its long-term potential level for all OECD member countries. CLIs show short-term economic movements in
 qualitative rather than quantitative terms.

 The Global Purchasing Managers' Index™ or the Global PMI™ is a survey-based economic indicator designed to provide a timely insight into
 changing business conditions derived from responses to monthly questionnaires sent to companies in manufacturing and services sectors in over
 40 countries, totaling around 28,000 companies and accounting for 89% of global gross domestic product (GDP).

 @2022 Charles Schwab & Co., Inc. All rights reserved. Member SIPC (0223-37FD)
You can also read