Global population genetic structure and demographic trajectories of the black soldier fly, Hermetia illucens
←
→
Page content transcription
If your browser does not render page correctly, please read the page content below
Kaya et al. BMC Biology      (2021) 19:94
https://doi.org/10.1186/s12915-021-01029-w

 RESEARCH ARTICLE                                                                                                                                   Open Access

Global population genetic structure and
demographic trajectories of the black
soldier fly, Hermetia illucens
Cengiz Kaya1,2, Tomas N. Generalovic3, Gunilla Ståhls4, Martin Hauser5, Ana C. Samayoa6, Carlos G. Nunes-Silva7,
Heather Roxburgh8, Jens Wohlfahrt1, Ebenezer A. Ewusie9, Marc Kenis10, Yupa Hanboonsong11, Jesus Orozco12,
Nancy Carrejo13, Satoshi Nakamura14, Laura Gasco15, Santos Rojo16, Chrysantus M. Tanga17, Rudolf Meier18,
Clint Rhode19, Christine J. Picard20, Chris D. Jiggins3, Florian Leiber1, Jeffery K. Tomberlin21, Martin Hasselmann22,
Wolf U. Blanckenhorn2, Martin Kapun2,23 and Christoph Sandrock1*

  Abstract
  Background: The black soldier fly (Hermetia illucens) is the most promising insect candidate for nutrient-recycling
  through bioconversion of organic waste into biomass, thereby improving sustainability of protein supplies for
  animal feed and facilitating transition to a circular economy. Contrary to conventional livestock, genetic resources of
  farmed insects remain poorly characterised. We present the first comprehensive population genetic characterisation
  of H. illucens. Based on 15 novel microsatellite markers, we genotyped and analysed 2862 individuals from 150 wild
  and captive populations originating from 57 countries on seven subcontinents.
  Results: We identified 16 well-distinguished genetic clusters indicating substantial global population structure. The
  data revealed genetic hotspots in central South America and successive northwards range expansions within the
  indigenous ranges of the Americas. Colonisations and naturalisations of largely unique genetic profiles occurred on
  all non-native continents, either preceded by demographically independent founder events from various single
  sources or involving admixture scenarios. A decisive primarily admixed Polynesian bridgehead population serially
  colonised the entire Australasian region and its secondarily admixed descendants successively mediated invasions
  into Africa and Europe. Conversely, captive populations from several continents traced back to a single North
  American origin and exhibit considerably reduced genetic diversity, although some farmed strains carry distinct
  genetic signatures. We highlight genetic footprints characteristic of progressing domestication due to increasing
  socio-economic importance of H. illucens, and ongoing introgression between domesticated strains globally traded
  for large-scale farming and wild populations in some regions.
  (Continued on next page)

* Correspondence: christoph.sandrock@fibl.org
1
 Department of Livestock Sciences, Research Institute of Organic Agriculture
(FiBL), Frick, Switzerland
Full list of author information is available at the end of the article

                                        © The Author(s). 2021 Open Access This article is licensed under a Creative Commons Attribution 4.0 International License,
                                        which permits use, sharing, adaptation, distribution and reproduction in any medium or format, as long as you give
                                        appropriate credit to the original author(s) and the source, provide a link to the Creative Commons licence, and indicate if
                                        changes were made. The images or other third party material in this article are included in the article's Creative Commons
                                        licence, unless indicated otherwise in a credit line to the material. If material is not included in the article's Creative Commons
                                        licence and your intended use is not permitted by statutory regulation or exceeds the permitted use, you will need to obtain
                                        permission directly from the copyright holder. To view a copy of this licence, visit http://creativecommons.org/licenses/by/4.0/.
                                        The Creative Commons Public Domain Dedication waiver (http://creativecommons.org/publicdomain/zero/1.0/) applies to the
                                        data made available in this article, unless otherwise stated in a credit line to the data.
Kaya et al. BMC Biology    (2021) 19:94                                                                        Page 2 of 22

 (Continued from previous page)
 Conclusions: We document the dynamic population genetic history of a cosmopolitan dipteran of South American
 origin shaped by striking geographic patterns. These reflect both ancient dispersal routes, and stochastic and
 heterogeneous anthropogenic introductions during the last century leading to pronounced diversification of
 worldwide structure of H. illucens. Upon the recent advent of its agronomic commercialisation, however, current
 human-mediated translocations of the black soldier fly largely involve genetically highly uniform domesticated
 strains, which meanwhile threaten the genetic integrity of differentiated unique local resources through
 introgression. Our in-depth reconstruction of the contemporary and historical demographic trajectories of H. illucens
 emphasises benchmarking potential for applied future research on this emerging model of the prospering insect-
 livestock sector.
 Keywords: Allelic richness, Approximate Bayesian computation, Diptera, Founder effect, Genetic differentiation,
 Genetic drift, Invasive species, Isolation by distance, Serial introductions, Stratiomyidae

Background                                                    Phenotypic performance variation among BSF popula-
Insects are considered one of the most promising agri-        tions has only been addressed by Zhou et al. [33], al-
cultural resources to address the socio-economic chal-        though genetic distances between the studied
lenges of a continuously growing human population due         populations were not reported. Recent evidence suggests
to their dual sustainability advantage [1–3]. On the one      variation among global studies for any given life-history
hand, increasing amounts of organic waste from agricul-       trait, such as larval performance or body composition
tural food chains, livestock production, and households       profiles, could be the result of underlying genetic differ-
cause severe ecological footprints [4–6]. On the other        ences between populations [34]. However, a comprehen-
hand, conventional protein supplies for livestock and         sive analysis of nuclear genetic variation within and
aquaculture feed are becoming increasingly unsustain-         among worldwide BSF populations, which is urgently
able due to land and water competition with primary           needed to understand global population structure and
food production, thereby reinforcing global environmen-       its phenotypic correlates, is lacking. In order to assist an-
tal impacts and destabilisation of ecosystems [7–9].          ticipated efforts for advanced BSF breeding based on the
Substituting soybean- and fishmeal-based protein com-         recently published genomic resources [35, 36], it is im-
ponents in animal feed with insect biomass, produced          perative to generate a comprehensive inventory of the
from efficient bioconversion of agricultural waste, pro-      global population genetic architecture and geographic
vides a mitigation strategy and facilitates sustainable       structure of BSF and decipher its evolutionary history.
nutrient-recycling [10–13].                                      In this context, historic documentation of organism
  The black soldier fly (BSF), Hermetia illucens (L. 1758;    distributions represents a crucial basis. The BSF is con-
Diptera: Stratiomyidae), is a particularly promising can-     sidered cosmopolitan across tropical, subtropical and
didate and considered the ‘crown jewel’ of the fast-          temperate regions [37–39], and is therefore the most
growing insect-farming industry [14]. BSF larvae are          widely distributed stratiomyid in the world. It is pur-
voracious feeders of a broad variety of organic matter of     ported to be indigenous to the Americas, where BSF
both plant and animal origin [15–18]. Remarkable feed-        now occur from Argentina to Canada [38–40]. A more
ing efficiencies and the ability to upcycle nutrient-poor     explicit origin of the species within South America and a
substrates into protein-rich insect biomass are prime         potentially more recent colonisation of North America
characteristics of commercial interest [19–21]. Given         have remained speculative [39]. Beyond the Americas,
their valuable nutrient profiles [22, 23], BSF larvae are     earliest documentations from Australasia date back to
highly suited for partially replacing soybean and fishmeal    1930 on Hawaii [41], and then during the 1930s and
in diets for poultry [24, 25], swine [26, 27] and aquacul-    1950s across other Pacific islands, eastern Australia,
ture species [28, 29]. Moreover, their high-fat contents      Southeast Asia, and New Zealand ([37–40] and refer-
could serve as a source for biodiesel [30, 31]. Accord-       ences therein). The oldest African records date back to
ingly, academic research interests in this insect have rap-   1914 (South Africa) and 1945 (Liberia) [42], whereas
idly increased, which has resulted in more than a             documentation in other African countries has been ac-
thousand scientific publications over the last 5 years,       cumulating only since the late 1950s [38, 42]. In Europe,
paralleled by the advent of an insect ‘mini-livestock’ pro-   BSF was first reported from Malta in 1926 [39], since
duction industry across the globe.                            the 1950s from France, Italy, and Spain, and only since
  In contrast to conventional livestock, genetic resources    the late 1980s from temperate European regions ([38–
of farmed insects remain poorly characterised [32].           40, 42] and references therein). Augmented academic
Kaya et al. BMC Biology   (2021) 19:94                                                                          Page 3 of 22

and economic interest arose only recently, however,            Bayesian Computation (ABC). These complementary
largely building upon the pioneering research carried          analyses allowed the following questions to be addressed:
out in the USA during the 1990s [43, 44]. Due to the           (1) Can genetic hotspots reveal the geographic origin of
ubiquitous distribution of one BSF strain that was ori-        the species? (2) Do population genetic patterns allow the
ginally used in the USA (J.K. Tomberlin, personal com-         reconstruction of native range expansions and the demo-
munication), captive populations used for farming and          graphic trajectories of historic dispersal routes into non-
research across continents most likely build on a narrow       native areas? and (3) To what extent do population gen-
genetic basis.                                                 etic characteristics of indigenous and naturalised wild
  Contrary to ancient natural dispersal and presumably         populations differ from captive populations in modern
highly stochastic, unintended anthropogenic introduc-          mass production facilities in various regions worldwide?
tions of BSF into non-native areas that occurred in re-        We moreover hypothesise that more than two decades
cent history, the presently increased global farming           of captive breeding and common global trade of a well-
activity is likely to result in more extensive transloca-      described North American BSF laboratory population
tions of genetically uniform captive populations, possibly     has left a detectable genetic footprint accompanying do-
reinforcing one-directional admixture worldwide. A re-         mestication. Based on that conjecture, we further aimed
cent investigation of the global phylogeography of BSF         to investigate possible human-mediated impacts of do-
based on mitochondrial COI marker sequences [45] de-           mesticated BSF strains increasingly used for farming on
tected substantial global sequence divergence of up to         present biogeographic population genetic patterns of this
4.9%, and concluded that puzzling haplotype prevalence         cosmopolitan insect, with special emphasis on the direc-
in various regions of the world could reflect recurrent        tion and the extent of local genetic introgression.
recent introductions of widely farmed BSF strains of
shared ancestry across continents. However, the single-
locus maternally inherited COI mitochondrial marker is         Results
comparatively evolutionary conserved, which impedes            Genetic markers and sample characteristics
resolution at the population level and does not allow dis-     All 2862 individuals represented unique multilocus ge-
tinguishing selection from demographic signals [46].           notypes (MLGs; Table S1, Additional file 1), indicating
Hence, there is an urgent need for adequate nuclear gen-       that the markers developed (Table S2, Additional file 2)
etic markers that are readily applicable and with high         provide a robust and informative tool for BSF population
resolution for documenting the amount and distribution         genetics (Figure S1, Additional file 2). The mean number
of nuclear genetic diversity worldwide, allocating sam-        of alleles per locus was 24.5 (± 8.3), and locus-specific
ples to distinct genetic clusters and inferring the evolu-     characteristics are summarised in Table 1. On average,
tionary forces that have shaped the natural distribution       populations comprised 19.1 individuals (ranging between
and global population structure of BSF. Considering pu-        5 and 50) that harboured 61.73 ± 15.47 alleles across loci
tatively ongoing influences of captive populations on          and, when rarefied to five diploid individuals, exhibited a
local wild populations via intraspecific hybridisation, a      mean allelic richness of 3.04 ± 0.49 per locus (Table S3,
thorough survey to identify distinct genetic resources         Additional file 2). Locus-specific deviations from Hardy-
and their relationships is pivotal. This could set the stage   Weinberg equilibrium (HWE) within populations were
for uncovering genetic adaptations across native and           detected at low levels (Table 1) and summed up to
newly colonised geographic regions within an evolution-        merely 3.5% of all comparisons across 150 populations
ary ecology framework of a highly invasive species,            (Figure S2, Additional file 2). Significant homozygote ex-
which would moreover facilitate the future identification      cess across loci within populations was detected for 54
of genetic correlations to performance trait variation         populations (Table S3, Additional file 2). Indications for
useful for the mass production of optimised strains.           null alleles were significant for the majority of loci; how-
  This study aimed to ascertain the global population          ever, the absence of null allele homozygotes throughout
genetic structure and elucidate the contemporary demo-         the entire data set suggests potential null alleles rarely
graphic history of H. illucens. A comprehensive sample         segregate at substantial frequencies. Of 15,750 tests for
of 2862 individuals from 150 wild and captive popula-          linkage disequilibrium (LD) among locus pairs across
tions collected in 57 countries on seven subcontinents         populations, 113 were significant, indicating independent
were genotyped based on 15 newly developed poly-               marker segregation. A BLAST search against the H. illu-
morphic microsatellites. We used this large-scale dataset      cens chromosomal assembly GCA_905115235.1 [36]
for population genetics analyses to characterise genetic       confirmed reasonable coverage of the genome by the
diversity and to identify distinct genetic clusters of BSF     novel markers: five chromosomes (all but the smaller
worldwide. We further applied coalescence-based simu-          chromosomes 6 and 7) are covered, and multiple loci
lations for demographic inference with Approximate             (up to five) reside on chromosomes 2, 3 and 4, with
Kaya et al. BMC Biology           (2021) 19:94                                                                                       Page 4 of 22

Table 1 Microsatellite-specific characteristics across 150 black                    of global population structure: the first axis separates a
soldier fly populations                                                             majority of closely related captive populations of broad
Locus     NA     FST      FIS         HO      HE       HWEDev       AR      AU      geographic origin from all the rest (Fig. 2a), while the
Hi_1-1    29     0.235    0.084       0.599   0.648    4            3.664   0.035   second and third axes centre this captive group and
Hi_1-2    36     0.235    0.032       0.607   0.621    3            3.595   0.194   highlight geographic structure largely independent of
                                                                                    population provenance (Fig. 2b). We further quantified
Hi_1-3    31     0.214    0.043       0.434   0.449    3            2.423   0.194
                                                                                    pairwise population genetic differentiation ranging from
Hi_1-4    30     0.168    0.086       0.537   0.587    7            3.078   0.367
                                                                                    FST = 0 to 0.626 (> 99% of the 11,175 pairwise tests were
Hi_1-5    17     0.248    0.125       0.501   0.570    5            2.988   0.059   significant; p < 0.0001) to document substantial global
Hi_2-1    12     0.293    − 0.018     0.395   0.382    0            2.346   0.083   genetic structure with an overall FST = 0.239 (Figure S5,
Hi_2-2    25     0.202    0.080       0.644   0.690    8            3.840   0.200   Additional file 2). A combined view of ML-inferred clus-
Hi_2-3    19     0.290    0.109       0.550   0.607    4            3.193   0.000   ter assignments mapped on a neighbour-joining tree
                                                                                    constructed from population pairwise Cavalli-Sforza
Hi_2-4    31     0.246    0.082       0.584   0.631    3            3.494   0.000
                                                                                    chord distances (DCH) is shown in Fig. 3.
Hi_2-5    8      0.259    − 0.026     0.414   0.403    2            2.219   0.125
                                                                                       The complex overall population structure captured by
Hi_3-1    30     0.279    0.118       0.333   0.369    3            2.328   0.167   the complementary approaches (Figs. 1, 2 and 3) is me-
Hi_3-2    28     0.211    0.070       0.599   0.643    6            3.475   0.107   diated by overarching factors of geographic distribution
Hi_3-3    24     0.179    0.118       0.570   0.647    13           3.553   0.083   and population provenance. To further disentangle their
Hi_3-4    32     0.298    0.176       0.474   0.566    11           3.141   0.063   relative influences, we progressively partitioned the data-
                                                                                    set according to subcontinental origin and provenance
Hi_3-5    16     0.248    0.130       0.538   0.607    7            3.191   0.000
                                                                                    and applied linear mixed effect models on rarefied allelic
overall   368    0.239    0.085       0.519   0.561    79           3.102   0.122
                                                                                    richness (AR), analysis of molecular variance (AMOVA;
NA number of alleles, FST fixation index, FIS inbreeding coefficient, HO/HE
observed and expected heterozygosity, HWEDev number of significant
                                                                                    Table S7, Additional file 2), and isolation by distance
deviations from Hardy-Weinberg equilibrium across all 150 populations, AR           (IBD) based on Mantel tests.
mean allelic richness per population (rarefied to five diploid individuals), AU        On a global scale, AR of wild populations was signifi-
proportion of unique alleles (detected only once). Significant F-statistics are
highlighted in bold                                                                 cantly higher than for captive samples (p < 0.001; Table
                                                                                    S8, Additional file 2). Separate AMOVAs of wild and
average pairwise distances of 45.5, 32.7 and 54.0 Mbp,                              captive populations across geographic regions indicated
respectively, between them.                                                         that captive populations are more structured across sub-
                                                                                    continents than wild populations. Conversely, wild pop-
Pronounced population structure is shaped by                                        ulations exhibited more pronounced structure between
geographic origin and wild versus captive provenance                                populations within subcontinents, with less variation be-
We characterised general patterns of population differ-                             tween individuals within populations (Table 3a). Glo-
entiation and applied complementary approaches to                                   bally, IBD was slightly stronger for captive populations
identify key factors shaping BSF global population gen-                             (r = 0.339 vs. r = 0.317; Table S9, Additional file 2). A
etic structure. Maximum-likelihood (ML)-based cluster                               breakdown of these associations for both (pooled) prove-
analyses and model selection using KIC goodness-of-fit                              nances (r = 0.214) clearly indicates genetic mismatches
statistics supported K = 16 as the optimal number of dis-                           of wild and captive populations in some regions, as also
tinct genetic clusters, whose global structure, derived                             reflected by the FCA (Fig. 2) and genetic distance net-
from discriminant analysis of principal components                                  works (Fig. 3, Figure S5, Additional file 2). We then eval-
(DAPC), is shown in Fig. 1a,b (see also Figure S3 A-D,                              uated whether captive provenance aligns or contrasts
Additional file 2). Minimal gene flow between clusters                              with the geographic population structure of wild popula-
across the majority of populations is supported by corre-                           tions within subcontinents. On all subcontinents, apart
sponding admixture analysis of individual MLGs (Fig. 1c).                           from the Americas, IBD across wild and captive popula-
Characteristics of the populations allocated to the 16                              tions was lower compared to only wild populations
distinct clusters (Table 2) revealed that genetic cluster-                          (Table S9, Additional file 2): while IBD differed only
ing largely reflects geography and provenance (i.e. wild                            slightly in Africa (r = 0.411 vs. r = 0.497), the difference
vs. captive origin) within but also across regions, includ-                         was much stronger across Australasia (r = 0.236 vs. r =
ing specific breeding-mediated signatures of some                                   0.413), and substantial in Europe (r = 0.019 vs. r =
farmed BSF strains (see also Tables S3-S6, Additional                               0.389).
file 2). Factorial correspondence analysis (FCA) account-                              To infer provenance-mediated structure within each
ing for subcontinental origin (see “Methods”) and prov-                             subcontinent, we performed separate AMOVAs
enance at the whole population level (complementary to                              (Table 3b) and assessed the effects of provenance nested
MLG cluster assignment) stressed these two key drivers                              within subcontinents on AR (Table S8, Additional file 2).
Kaya et al. BMC Biology (2021) 19:94 Page 5 of 22 Fig. 1. Global population genetic patterns of Hermetia illucens. Discriminant analysis of principal components depicting all 2862 multilocus genotypes assigned to 16 distinct genetic clusters, independent of the original populations sampled (see also Table 2, Table S6, Additional file 1). a Axes 1 and 2 and b axes 2 and 3. Dots show individuals and numbered labels denote cluster means, both arbitrarily coloured as per the key below panel b. c Posterior probabilities of membership to inferred genetic clusters (K=16) for all individuals (stacked bar plots) arranged as vertical bands within their original populations (Table S3, Additional file 2), indicating admixture proportions with cluster colours as defined in panels a and b. Populations are framed by grey boxes whose widths reflect the number of individuals displayed. The bottom part of panel c shows population grouping according to subcontinental origins using colours that differ from those used for genetic clusters. Population groups labelled with roman numbers refer to major geographic regions and provenances: I: entire Africa—captive; II: west—wild; III: central-east—wild; IV: south-east—wild; V: entire Asia—captive; VI: south-east continental—wild; VII: south-east insular—wild; VIII: west—wild & captive; IX: east—captive; X: southern Polynesia—wild & captive; XI: northern Polynesia—captive; XII: north—wild; XIII: central regions—wild & captive; XIV: south—wild; XV: Caribbean—wild; XVI: entire Europe—captive; XVII: west/central—wild; XVIII: south—wild; XIX: south-east—wild; XX: entire North America—captive; XXI: west—wild; XXII: south-east—wild; XXIII: north-west—wild & captive; XXIV: central-east—wild & captive. We neither found structure (Table 3b) nor significant exclusively derive from local wild gene pools and that differences in diversity (Table S8, Additional file 2) be- there is frequent gene flow between provenances and tween captive and wild populations in South and Central hence limited genetic signatures of fly farming practices America and Australia, respectively. This suggests that on local captive populations (Fig. 3, Figure S5, Add- in these geographic regions captive populations itional file 2). Conversely, pronounced structure with
Kaya et al. BMC Biology          (2021) 19:94                                                                                                         Page 6 of 22

Table 2 Characteristics of black soldier fly populations assigned to distinct genetic clusters
Cluster (K =     No.        Geographic origin, provenance status, indicated admixture and traceable breeding history
16)              Pops
1                25         Captive North American populations plus recent introductions thereof in Europe and Africa (exclusively captive)
2                15         Captive European and African populations (derived from captive North American populations introduced around 2005) plus
                            introgressed wild African populations
3                7          Captive European populations (recent breeding programme: captive North American origin)
4                3          Captive Asian populations (recent breeding programme: captive North American origin introgressed by wild Asian
                            populations)
5                14         Captive and wild Asian and captive European populations (hybrids between wild Asian and captive North American
                            populations)
6                15         Wild and captive Asian populations plus admixed captive Australian-Polynesian populations
7                4          Wild and captive Australian populations (west)
8                4          Captive Australian populations (east)
9                3          Wild and captive Australian-Polynesian and wild Central American (Caribbean) populations
10               5          Wild European populations (west)
11               10         Wild African populations (south-east)
12               8          Wild and captive South American populations (central-east)
13               7          Wild African populations (west)
14               8          Wild and captive South American (north-west) and wild Central American (south) plus wild European (south-east)
                            populations
15               12         Wild and captive Central America (central regions) and wild European (south) populations
16               10         Wild North American (west, south-east), wild Central American (north), wild and captive African (central-east) populations
                            plus admixed wild European (south-east), captive Asian and captive Australian-Polynesian populations
Numbers of populations assigned to each of the 16 clusters (Fig. 1) based on the majority of individuals, including the influence of admixture (if detected),
relevant information on geographic origin, occurrence in the wild and/or captivity (provenance), and breeding history if traceable (see Fig. 3, Table S4, Additional
file 2). For genetic diversity and pairwise differentiation of inferred genetic clusters, independent of sampling populations, see Table S6, Additional file 2

    Fig. 2. Factorial correspondence analysis (FCA) of 150 Hermetia illucens populations. Population ‘barycentres’ labelled according to provenance
    status and subcontinent of origin are projected in multidimensional space based on FCA axes 1 and 2 (panel a) and axes 2 and 3 (panel b),
    which together explain 22.2% of the total variance. Individual-based multivariate ordination according to population provenance nested within
    subcontinent is shown as a complementary analysis in Figure S4, Additional file 2.
Kaya et al. BMC Biology (2021) 19:94 Page 7 of 22 Fig. 3. (See legend on next page.)
Kaya et al. BMC Biology         (2021) 19:94                                                                                                         Page 8 of 22

     (See figure on previous page.)
     Fig. 3. Dendrogram of Cavalli-Sforza and Edwards chord distances of 150 Hermetia illucens populations. Population cluster allocations (based on
     the majority of assigned individuals) are gradient-highlighted in the background according to Fig. 1. For some highly admixed populations, the
     second-most abundant clusters are indicated in a separate column. Labels at the branch-tips represent population provenances and
     subcontinental origins as defined in Fig. 2. Additional information on major geographic regions of origin is specified for wild populations and
     selected strains (see Table 2)

respect to provenance observed in Europe, North Amer-                               Australia and Asian captive populations assigned to clus-
ica and Africa and to a lesser extent Asia (Table 3b) sug-                          ter 6 (Figs. 1 and 3, Figure S5, Additional file 2). An
gests that BSF strains used for farming in these regions                            overview of the patterns detailed below is provided in
were mostly derived from a common genetically distinct                              Fig. 4, which highlights global cluster occurrences ac-
and exclusively captive origin rather than local wild pop-                          cording to geography and provenance as well as putative
ulations (Figs. 2 and 3, Figure S5, Additional file 2). In                          range expansions and anthropogenic introductions.
Africa and Asia, it appears that both local wild popula-
tions and recently introduced strains are used for farm-
ing, with occasional admixture between them (Fig. 1,                                Americas
Table 2). For instance, two genetically distinct clades                             Wild populations from North, Central and South Amer-
across Asian BSF farms (only one of which matches re-                               ica exhibited higher AR than wild populations from other
gional wild populations; Fig. 3, Figure S5, Additional                              continents (p < 0.01; Table S8, Additional file 2) but did
file 2) reflect an intermediate variance structure accord-                          not significantly differ from each other, albeit wild popu-
ing to provenance within Asia (Table 3b). While North                               lations from North America harboured substantially
American wild populations harboured significantly more                              fewer alleles (Table S5, Additional file 2). Considering
alleles than captive strains, the reverse was found in Asia                         both provenances, South American populations har-
(p < 0.001; Tables S5 and S8, Additional file 2).                                   boured the most private alleles and the highest allelic di-
                                                                                    versity worldwide, with twelve of 150 samples (7% of all
                                                                                    individuals) comprising one third of the globally occur-
Population genetic characteristics and colonisation                                 ring population-private alleles and 65% of the overall al-
patterns of wild BSF on different subcontinents                                     lelic variation (Tables S3 and S5, Additional file 2).
To better understand the demographic history of world-                              Cluster analysis placed central-eastern South American
wide BSF populations, we investigated geographic char-                              populations in the most diverse cluster 12, while north-
acteristics of their population structure and relationships                         western South American populations group with the
between wild populations within and across subconti-                                southern-most Central America populations in the sep-
nents. We considered captive populations as biogeogra-                              arate cluster 14 (Figs. 3 and 4, Table S6, Additional
phically informative whenever they appeared to be wild-                             file 2). Central American populations north of Costa
derived from local native or naturalised populations: i.e.                          Rica form the well differentiated cluster 15, which is dis-
captive populations from South and Central America,                                 placed in northern Mexico by the less diverse cluster 16
Table 3 Analyses of molecular variance according to successive hierarchical grouping
a)                                                    Proportion of variance (%)
       Source of variance                             Wild                          Captive                       Combined provenances
       Between subcontinents                          7.41                          10.18                         7.79
       Between populations within subcontinents       17.16                         13.10                         17.07
       Between individuals within populations         5.12                          7.32                          6.38
       Within individuals                             70.32                         69.40                         68.76
b)                                                    Proportion of variance (%)
       Source of variance                             Africa   Asia     Australia   Central America Europe North America South America All regions
       Between provenances                            9.72     5.36     − 1.18      − 0.66              16.66     10.43              − 0.09             4.28
       Between populations within provenances         16.97 18.01 18.78             15.42               12.48     6.83               13.57              21.31
       Between individuals within populations         3.50     9.53     7.31        6.70                5.47      6.52               10.55              6.32
       Within individuals                             69.81 67.11 75.09             78.53               65.39     76.22              75.98              68.09
Genetic variance explained according to (a) subcontinental origin based on separate analyses for wild, captive and combined provenances; (b) population
provenance (wild vs. captive) based on separate analyses for each subcontinent, as well as all regions. Significant variance components are highlighted in bold.
See also Table S7, Additional file 2
Kaya et al. BMC Biology (2021) 19:94 Page 9 of 22 Fig. 4. Inferred global distribution dynamics of Hermetia illucens genetic clusters. Pie charts represent proportions of individuals sampled in major geographic regions and assigned to genetic clusters according to Fig. 1 (see also Table 2 and Table S6, Additional file 2). Pie diameters correspond to sample sizes and pies comprising multiple samples reflect whole regions (see Table S10, Additional file 2, for more detail). a Map depicting biogeographically informative wild and/or captive populations as indicated according to the symbols plotted on starting points referring to major geographic regions. Colonisation routes, as inferred from ABC analyses (Figure S6, Tables S11-13, Additional file 2), are indicated by schematically simplified trajectories. Indigenous range expansions are shown by solid arrows and dispersal to non-native regions are differentiated to show founder events from single sources (dashed-dotted arrows), admixture between demographically independent introductions (dashed arrows), and serial colonisations (dotted arrows). Origins mostly refer to whole regions rather than specific locations. b Map depicting exclusively captive population pools from entire continents of North America, Europe, Africa and Asia, and inferred major trading directions of domesticated strains and their introgressants of clusters 1–5 (see Table S10, Additional file 2, and main text for more detail) of North American wild populations (Table 2, Figs. 1 additional ABC-based analyses indicated admixture pri- and 4, Table S6, Additional file 2). Central American marily between populations from south-eastern North mainland populations were thus assigned to the three America and central-eastern South America (P = 0.46; distinct genetic clusters 14, 15 and 16 (Figs. 1 and 3, Figure S6-C, Tables S11-13, Additional file 2). Table 2), which altogether exhibited far stronger IBD (r = 0.476) than South American populations (r = 0.149; Australasia Table S9, Additional file 2). These patterns indicate a Asian and Australian naturalised populations are closely striking north-south gradient of genetic variation in related and did not differ in AR, but harboured signifi- America (Figs. 2 and 4). To test whether this was the re- cantly fewer alleles than American wild populations (p < sult of a historic range expansion, we compared various 0.01; Tables S3, S5 and S8, Additional file 2), from which demographic scenarios with approximate Bayesian com- they are distinct (Fig. 2). Naturalised Asian populations putation (ABC) based on coalescent simulations. The formed cluster 6, while eastern and western Australian best-supported model considers central-east South populations grouped in cluster 8 and the genetically least American cluster 12 as ancestral, and the South Ameri- diverse but highly distinct cluster 7, respectively (Figs. 1 can cluster 14 as the source that colonised Central and 4, Table 2, Table S6, Additional file 2). Importantly, America and gave rise to Central American cluster 15, separate IBD patterns across Asian and Australian popu- from which North American populations of cluster 16 lations remained unchanged when pooled in a joint Aus- most recently derived (posterior probability [P] = 0.85; tralasian group (Table S9, Additional file 2). Individuals Figure S6-A, Tables S11-13, Additional file 2). The from Hawaii were allocated to diverse clusters, while Caribbean sample was distinct from all other American New Zealand populations grouped with Caribbean sam- populations (cluster 9 in Figs. 1 and 4, Table 2), and ples in cluster 9. These Polynesian samples were
Kaya et al. BMC Biology   (2021) 19:94                                                                         Page 10 of 22

altogether among the least differentiated compared to          east African cluster 11 and eastern Australian cluster 8
populations from other subcontinents (Figs. 3 and 4, Fig-      as the best scenario for the origin of western European
ure S5, Additional file 2). ABC analysis indicated that        populations (P = 0.75; Figure S6-G, Tables S11-13, Add-
northern Polynesia is the most likely origin of the colon-     itional file 2). Consistent clustering with wild popula-
isation of the entire Australasian region (P = 0.77; Figure    tions from the Americas was found in the
S6-D, Tables S11-13, Additional file 2). From there, ser-      Mediterranean: the southern European wild population
ial colonisations reached out first to Southeast Asia and      largely grouped with cluster 15, while individuals of the
successively, via the Pacific islands, to eastern Australia.   south-eastern European wild population were assigned
Our analyses indicate western Australian populations           to cluster 14 or cluster 16 (Table 2, Figs. 1, 3 and 4).
originated from admixture between Asian and eastern
Australian naturalised lineages (Figure S6-D, Tables           Origin and population genetic patterns of globally
S11-13, Additional file 2). ABC analyses further showed        predominant captive populations
that the original colonisation of Polynesia can be best        The majority of captive populations from North Amer-
explained by admixture between north-western South             ica, Europe, Africa and Asia grouped in clusters 1–4,
American and western North American populations (P             which exhibited shallow but distinct structure and simi-
= 0.50; Figure S6-E, Tables S11-13, Additional file 2).        lar levels of AR across subcontinents (Table 2, Figs. 1
                                                               and 3, Table S6 and S8, Additional file 2). Populations
Africa                                                         characterised by considerable individual assignments to
Allelic richness AR of African wild populations (Table         any cluster of this group also tended to show strong ad-
S8, Additional file 2) was significantly lower than in         mixture between these (i.e. comparatively lower within-
South and Central America (p < 0.05), but not different        population proportions of single cluster assignment,
from North American wild populations. Only wild popu-          Fig. 1c), suggesting common exchanges across farms
lations from central-east Africa and two wild popula-          worldwide, as supported by cross-locus inbreeding coef-
tions from west Africa grouped close to captive African        ficients FIS. Populations of clusters 1–4 did not signifi-
populations and North American wild populations (clus-         cantly differ from global wild populations, and both
ters 2 and 16, respectively, Table 2, Figs. 1 and 3). Clus-    groups showed significantly lower FIS than captive popu-
ter 13 exclusively comprised wild populations from west        lations that were locally derived from wild populations
Africa (Table 2, Fig. 4). This group was one of the most       of other clusters (Table S14, Additional file 2). Strikingly,
genetically distinct and least differentiated from South       however, most of the deviations from linkage equilib-
American populations (Figs. 1 and 3, Table S6, Figure          rium were detected in captive populations assigned to
S5, Additional file 2). All wild populations from south-       clusters 1–4, which often exhibited characteristic LD
east Africa formed cluster 11 (Table 2, Figs. 1 and 4),        across nine markers for seven of the 105 locus pairs (five
which appeared the least differentiated from Australa-         to 14 populations per locus pair). Linked pairs of loci
sian wild populations of all African wild populations. In-     were exclusively on the same chromosome, and at large
deed, ABC analysis revealed that south-east African            distances of up to 14.9, 48.4 and 20.8 Mbp for chromo-
populations most likely originated from admixture be-          somes 2, 3 and 4, respectively. Ratios of the variance
tween west African populations and a subsequent intro-         components for LD between (DST) and within (DIS) pop-
duction from Polynesia (P = 0.50; Figure S6-F, Tables          ulations [47] across all pairs of loci were significantly
S11-13, Additional file 2). Other demographic models           lower for populations assigned to clusters 1–4 than for
indicate that cluster 11 neither directly descended nor        wild populations worldwide, but not compared to wild-
experienced admixture from central-east African popula-        derived captive populations from other clusters (Table
tions of cluster 16.                                           S15, Additional file 2). Specifically considering the seven
                                                               pairs of loci in high LD, clusters 1–4 demonstrated sig-
Europe                                                         nificantly lower DST/DIS ratios than both wild and cap-
European wild populations exhibited significantly re-          tive populations in other clusters, but no significant
duced AR compared to wild populations from the Amer-           differences were detected between the two latter groups.
icas (p < 0.001; Table S8, Additional file 2). Cluster         By contrast, no significant differences among the three
analysis assigned all western European wild populations        groups were found across the remaining 98 pairs of loci.
to cluster 10 (Table 2, Fig. 4), related to south-east Afri-      Captive populations predominating across North
can and eastern Australian populations (Fig. 1). This pat-     America, Europe, Africa and (to a lesser extent) Asia
tern was also supported by FCA (Fig. 2), while DCH             were closely related but markedly distinct from the geo-
grouped all western European wild populations with             graphically closest wild populations (Fig. 2, Figure S5,
west African populations (Fig. 3). In line with these re-      Additional file 2). The closest match of these clusters 1–
sults, ABC analyses indicate admixture between south-          4 with North American cluster 16 (Fig. 1, Table S6,
Kaya et al. BMC Biology (2021) 19:94 Page 11 of 22
Additional file 2), particularly wild populations from Lastly, hybrids between Asian naturalised populations
south-eastern USA (Fig. 3), is in accordance with a priori (cluster 6) and captive populations of North American
expectations regarding the geographic origin of globally origin (clusters 1–3) were identified in Asian clusters 4
most widespread captive populations. ABC analyses and 5 (Table 2, Figure S8, Additional file 2). While clus-
favoured south-eastern North America as the direct ter 5 was inferred to be evenly admixed, including back-
source of North American captive populations in the crosses in both directions, cluster 4 appears only
significantly best-explaining model (P = 0.47; Figure S6- marginally introgressed, with very limited genetic signa-
B, Tables S11-13, Additional file 2). The latter form a tures of Asian wild populations.
genetically uniform group (Fig. 2) and strongly reduced Several wild populations sampled across considerable
genetic variance (Table 3b, Tables S3 and S5, Additional distances in Africa demonstrate introgression from mod-
file 2) rule out substantial gene exchange with regional ern BSF farms and research facilities (Figs. 1c and 3), in-
wild populations in the recent past. North American dicating that hybrid populations have established
captive populations were jointly assigned to cluster 1 repeatedly in nature in this region (Fig. 4). By contrast,
(Fig. 1, Table 2), together with several captive popula- all but one of the hybrid populations in Asia were cap-
tions from Europe and Africa which appear to have been tive, suggesting that more recently introduced farmed
sourced from North American captive populations in re- BSF have caused limited, merely local introgression into
cent years, as mostly confirmed by the sample providers. Asian wild populations. Instead, the close relatedness
Cluster 2 subsumes mostly European and a few African among Asian hybrid populations (Figs. 2 and 3) points
captive populations (Fig. 1, Table 2). Personal communi- to very few independent recent hybridisation events,
cation with sample providers allowed us to trace cluster followed by frequent subsequent transfers of up to mil-
2 back to an earlier introduction of North American lions of individuals each across Asian and European
captive populations to Europe around 2005, and more- farms (the latter being confirmed by sample providers).
over revealed that populations assigned to exclusively Interestingly, recent human-mediated admixture be-
captive clusters 3 and 4 stem from two more recent tween distantly related clusters contributed to increased
breeding programmes initiated independently in Europe genetic variance between individuals within populations,
and Asia (Fig. 1, Table 2). as exemplified for Asian populations (Table 3b), rather
than the expected increase of variance within individuals
Introgression between widely farmed strains and local that was typically found in American wild populations.
wild populations These patterns coincide with disproportionally strong
A better understanding of the frequency, extent and dir- deviations from HWE (Table S3, Additional file 2) across
ectionality of introgression between globally structured hybrid populations between captive North American
wild populations and genetically highly uniform and dis- and naturalised Asian or (to a lesser extent) African
tinct captive strains is key to evaluate the impact of in- origins.
creasing global trade and large-scale BSF farming on
indigenous and naturalised populations. Further, the Discussion
characterisation of genetic origins of cross-bred captive Our comprehensive population genetic study of wild and
strains could support future breeding efforts and captive populations of BSF on a global scale using highly
traceability. discriminating microsatellites permitted a fundamental
In this context, two west African wild populations genetic characterisation of this commercially important
assigned to admixed clusters 2 and 16 (Figs. 1 and 3), ra- insect. Our data provided novel insights into (1) the geo-
ther than cluster 13 as expected, were identified as F1 graphic distribution of genetic variation and population
hybrids and backcrosses with parental groups repre- structure of wild and captive populations; (2) the origin
sented by west African wild populations and European of specific colonisations and general patterns of range
captive populations (cluster 2) reportedly translocated to expansions across the world, including basic delimita-
a nearby BSF facility 2 years prior (Figure S7, Additional tions of historic vs. contemporary events; and (3) the
file 2). genetic relationships between wild and captive popula-
Similarly, ancestry coefficients revealed that wild and tions, which exhibit genetic footprints of domestication,
captive populations from central-east Africa that were and local gene flow between the two.
allocated to the North American cluster 16 were hybrids
between parental groups originating from south-east Af- Indigenous genetic hotspots, reconstruction of worldwide
rican (cluster 11) and regionally abundant captive popu- dispersal routes, and admixture as a trigger of rapid non-
lations (clusters 1–3) (Figure S8, Additional file 2), with native range expansion
extensive backcross re-assignments documenting vast Worldwide patterns of nuclear genetic diversity are con-
admixture across provenances in this region. sistent with the previously presumed origin of BSF inKaya et al. BMC Biology (2021) 19:94 Page 12 of 22 the Americas [39, 45]. In accordance with the centre of as first reports of BSF in South Africa are older than species diversity of the genus Hermetia [40], South those from Hawaii. This implies potential documenta- America was identified as a BSF genetic hotspot and the tion gaps regarding an earlier colonisation across Pacific cradle of a complex, presumably ancient dispersal his- islands, and/or a change in the originally colonised areas tory across the Americas, and more recently around the of pure cluster 13, which today is found only in west Af- world (Fig. 4). We provide evidence that central-east rican refuges and whose current genetic profile could South American BSF are ancestral, while Central Amer- have been shaped in the course of geographical shifts. ica was colonised from already derived source popula- Patterns observed in central-eastern Africa reflect pro- tions from north-western South America west of the gressing introgression between south-east African wild Andes. Spatial bottlenecks and climate shifts may induce populations and more recently introduced captive popu- drift and adaptive processes, respectively [48]. Both lations that are used in several large-scale farming facil- could be mirrored in the pronounced population struc- ities across the continent. However, an additional ture characterising the Central American range expan- independent introduction of North American wild popu- sion of BSF - by the isthmus of Panama and more arid lations of cluster 16 to central-eastern Africa cannot be regions in northern Mexico, before their dispersal into ruled out (Figs. 3 and 4) and is indeed supported by North America (Figs. 3 and 4), which was last colonised shared mitochondrial haplotypes between wild samples within the Americas. These inferences are corroborated from Kenya as well as Oklahoma and Florida, USA [45]. by the highly characteristic mitochondrial genetic struc- European wild populations are all highly distinct from ture of North American BSF [45]. Nevertheless, south- European captive populations and appear to stem from east North American wild populations were least differ- at least three independent introductions from the Amer- entiated in conjunction with signals of admixture in icas plus a fourth lineage that was the result of a remark- Caribbean individuals (Figs. 3 and 4, Figure S5, Add- able admixture event. Clusters 15 and 14 from Central itional file 2), suggesting occasional gene flow from and South America, which dominated southern and South America into south-east North America via the south-eastern European populations, respectively, were Caribbean islands. otherwise not detected outside their indigenous ranges Reduced genetic diversity in Asia and Australia indi- and are thus both considered unique introductions cates BSF is not native to these regions. Characteristic (Fig. 4). Both Mediterranean populations also featured genetic signatures and IBD patterns of naturalised BSF assignments to cluster 16, which suggests gene flow populations across the entire Australasian region suggest among them, and implies a third colonisation either a single successful colonisation event followed by succes- from North American wild populations directly, via po- sive range expansion, resulting in a unique population tential ongoing range expansions from central-east Af- structure (Fig. 1, Table 2). Polynesian populations com- rica into the Mediterranean, or vice versa (Fig. 4). pellingly trace back to a primary admixture event be- Moreover, despite their geographic proximity, ABC ana- tween distantly related lineages from the American West lyses indicate that neither Mediterranean population ap- Coast (Figs. 3 and 4). The inferred colonisation route of pears to have given rise to wild populations of western Australasia via serial introductions coupled with moder- Europe (cluster 10 in Figs. 1 and 4). Admixed ancestry ate genetic drift (Fig. 4) conforms to BSF documentation of the latter between two demographically distinct de- records [39] and identifies admixed Polynesian founders scendants of the primarily admixed Polynesian bridge- as bridgehead populations [49–52]. Western Australia, head agrees with BSF documentations from central which was most recently colonised, harbours the most Europe, which are younger than those from the Mediter- differentiated genetic cluster (Figs. 1 and 4, Table S6, ranean as well as those from eastern Australia and Additional file 2). Its origin from secondary contact be- south-east Africa. tween previously split Southeast Asian and eastern Aus- Our data conclude that BSF became naturalised virtu- tralian lineages can explain several private alleles that ally everywhere outside its native range in the Americas. might have ‘surfed’ at lacing edges of the Australasian Inadvertent anthropogenic introductions from the range expansion [48, 50]. Americas before the 19th century via historic shipping We infer that Africa was colonised via three independ- routes (e.g. in organic cargo or waste) would be plausible ent demographic events in different parts of the contin- for all non-native regions. Not only in the Mediterra- ent (Fig. 4). Consistent with the phylogeographic signal nean, where our finding of a Central American origin of the mitochondrial COI marker [45], our nuclear gen- supports previous speculations on local BSF occurrence etic data indicate an exclusive South American origin of by the 16th century [53], but also across Polynesia and west African cluster 13. The south-east African cluster West Africa. Nevertheless, assuming the earliest verified 11 showed admixed ancestry between west African and documentation dating back to the 1920s–1950s in Af- Polynesian origins (Figs. 1 and 4), which was unexpected rica, Europe, Asia and Australia reflect the true onsets of
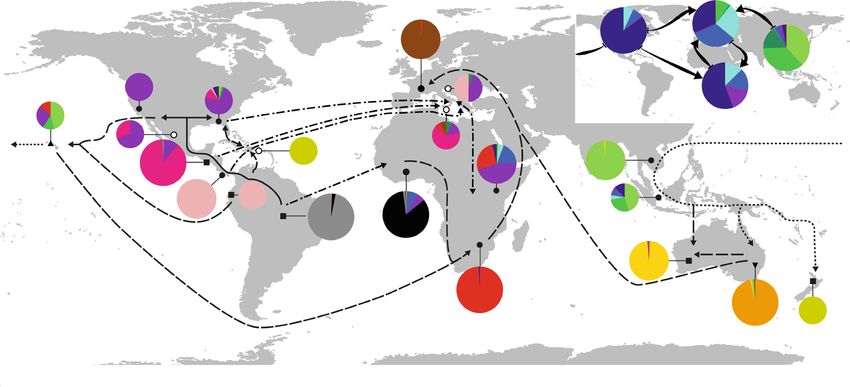
Kaya et al. BMC Biology   (2021) 19:94                                                                          Page 13 of 22

wider successful colonisations, our data imply that BSF         south-east Africa and western Europe, and most likely
accomplished cosmopolitan range expansions during the           occurred during lag phases and prior to rapid invasions
last century at the same rate as Harmonia axyridis,             [50, 62, 63]. Thus, BSF dispersal in most non-native
Drosophila suzukii, Aedes albopictus or Anoplophora             areas likely followed a fast and continuous ‘wave-of-ad-
glabripennis [51, 54–57]. In several contemporary exam-         vance’ scenario [46, 48]. This may reflect a species-
ples of invasive insects, it has been demonstrated that         specific dispersal strategy that was most likely initiated
decisive bridgehead effects involving intraspecific admix-      by humans but subsequently only passively promoted by
ture were the trigger for rapid large-scale range expan-        them through widespread availability of suitable breed-
sions across non-native areas, irrespective of occasional       ing habitats for this opportunistic synanthropic fly [61].
older, locally more restricted single-source colonisations      Surprisingly, little is known about natural BSF dispersal,
[50–52, 54, 55, 58]. Admixture between differentiated           but a presumed bivoltine lifecycle in most climates com-
lineages is supposed to increase genetic variation and          bined with high fecundity may predispose BSF for quick
generate novel genotype combinations for selection to           dispersal, even to areas characterised by only seasonally
act on [49, 59, 60]. Naturalised populations in south-east      suitable habitats.
Africa and western Europe both independently trace
back to multiple consecutive admixture events, with
common origins in the primarily admixed bridgehead              Demography and genetic signatures of domesticated BSF
that previously initiated the Australasian invasion-hub         Clusters 1–5 comprise the majority of captive popula-
(Fig. 4). Thus, our finding that the largest non-native         tions used for commercial operations and academic re-
areas were invaded by admixed populations, while only a         search worldwide. The complementary analyses detailed
limited number of the BSF colonisations traced back to          above indicate they represent direct descendants (or in-
single founder events deriving from native American             trogressants) originating from a single source in south-
sources directly, such as west and central-east African         eastern North America that were spread successively
and Mediterranean populations, represents a compelling          across other continents, notably Europe, Africa and Asia.
example in favour of this hypothesis. Our observation           This conclusion is supported by a recent phylogeo-
coincides with previous evidence that two distantly re-         graphic study based on mitochondrial COI markers [45].
lated COI haplotypes prevail across entire Australasia,         This founding stock most likely goes back to an estab-
which are neither abundant in indigenous ranges nor             lishment of approximately 20,000 wild-collected pupae
present in common captive populations outside this re-          in the course of some early work in 1998 in Alma,
gion [45]. Yet, one of them is indeed uniquely shared           Georgia, USA [44, J.K. Tomberlin, personal communica-
among wild populations from western Europe and                  tion] (i.e. almost 200 generations ago, considering 8–9
south-east Africa [45].                                         generations per year under suitable captive conditions).
   After initial establishment (with or without admix-             North American captive populations of cluster 1
ture), human activity could have mediated numerous un-          (Fig. 1, Table 2) harbour low microsatellite allelic diver-
intended secondary translocations within non-native             sity (Table S5, Additional file 2), indicating that their
continents that may have accelerated range expansions           genetic signatures were shaped by a pronounced founder
even prior to the recent advent of BSF farming. How-            effect, coupled with strong artificial selection in isolation
ever, long-distance dispersal of initial colonisers did not     (e.g. [64]). An early division of this captive North Ameri-
disturb pronounced IBD patterns of naturalised popula-          can gene pool, represented by cluster 2, features more
tions at large and medium geographic scales (Table S9,          diverse mitochondrial haplotypes also found in North
Additional file 2), nor did independent transcontinental        American wild populations [45]. This may be owing to
introductions break up the apparent genetic distinctive-        introgression from wild populations in Europe (or Af-
ness of founder populations by generating detectable            rica) shortly after its introduction there around 2005,
substructure patches of diversity [48], with the exception      and/or stronger drift across North American captive
of the serial colonisation of Australasia as a whole (Figs. 3   populations during the last decade. Interestingly, the op-
and 4). Therefore, the lack of noteworthy wider geo-            posite extremes of two more recent breeding approaches
graphic substructure beyond IBD within each of these            generated only modest, albeit detectable, genetic signa-
non-native regions indicates that unique admixture              tures (Fig. 1, Table 2): cluster 3, derived from a Euro-
events upon independent introductions preceded suc-             pean breeding programme, should have experienced
cessful range expansions, which were not substantially          even more pronounced drift, while cluster 4 demon-
affected by genetic signatures of potential subsequent          strably involved outcrossing with Asian wild populations
demographic effects [61]. Both genetic drift and eco-           prior to subsequent selection. Nevertheless, similar gen-
logical adaptation (see below) may have contributed to          etic footprints of the original North American strain are
highly distinct genetic profiles of BSF across Australasia,     seen worldwide.
You can also read