GOOD PRACTICE EXAMPLES - SOLUTIONS TO IMPROVE THE URBAN TRANSPORT SYSTEM TOWARDS SUSTAINABLE URBAN MOBILITY - Sumba
←
→
Page content transcription
If your browser does not render page correctly, please read the page content below
SUSTAINABLE URBAN MOBILITY AND COMMUNTING IN BALTIC CITIES

                                                             GOOD PRACTICE EXAMPLES
                                                             SOLUTIONS TO IMPROVE THE URBAN
                                                               TRANSPORT SYSTEM TOWARDS
                                                               SUSTAINABLE URBAN MOBILITY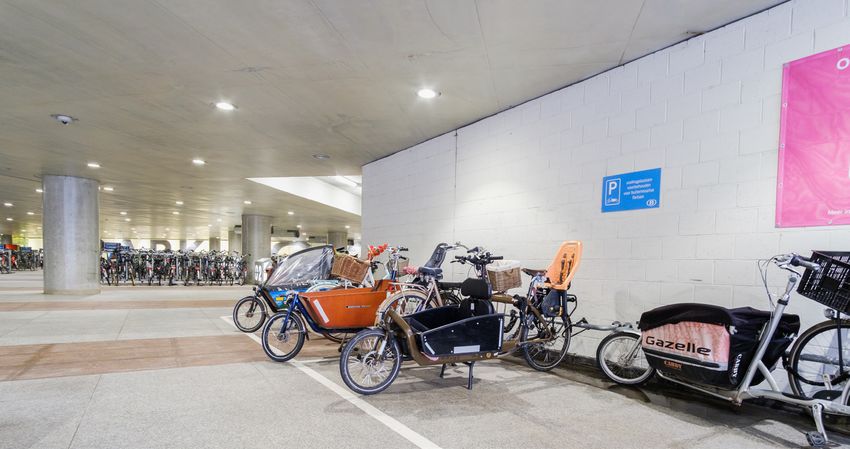
IMPRINT
Authors: Aksel Part, Kay Gade, Heike Bunte, Liga Pakalna, Matthias Grätz, Mari Jüssi,
Laura Remmelgas, Colin Hale.
Baltic Environmental Forum Estonia
Liimi 1, 10621
Tallinn, Estonia

Layout: Matthias Grätz & Elionor Ferrer, Baltic Environmental Forum Germany
Cover picture: Mika Baumeister, unsplash.com
This report was developed in the SUMBA project (#R074), with financial support of the INTER-
REG Baltic Sea Region programme of the European Union. The contents of this brochure solely
reflect the views of the authors and do by no means represent the view of the INTERREG pro-
gramme or European Commission.
© Tallinn 2020

TABLE OF CONTENTS
1. Introduction................................................................................................................................... 4
2. Transport and urban planning............................................................................................... 5
   2.1 Relevant common challenges and problems.......................................................... 5
   2.2 Relevance for commuting and intermodality........................................................... 5
   2.3 Possible solutions............................................................................................................... 5
   2.4 Indicators for success...................................................................................................... 6
   2.5 Good practice examples................................................................................................. 6
3. Analysing the transport system......................................................................................... 12
   3.1 Relevant common challenges and problems ...................................................... 12
   3.2 Relevance for commuting and intermodality ....................................................... 13
   3.3 Possible solutions............................................................................................................ 13
   3.4 Indicators for success .................................................................................................. 14
   3.5 Good practice examples ............................................................................................. 15
4. Infrastructure .......................................................................................................................... 18
   4.1 Relevant common challenges and problems ...................................................... 18
   4.2 Relevance for commuting and intermodality........................................................ 18
   4.3 Possible solutions .......................................................................................................... 18
   4.4 Indicators for success................................................................................................... 19
   4.5 Good practice examples.............................................................................................. 19
5. Integrated Ticketing and Tariff systems ......................................................................... 27
   5.1 Relevant common challenges and problems ...................................................... 27
   5.2 Relevance for commuting and intermodality ...................................................... 27
   5.3 Possible solutions .......................................................................................................... 27
   5.4 Indicators for success................................................................................................... 27
   5.5 Good practice example ................................................................................................ 28
6. Services...................................................................................................................................... 30
   6.1 Relevant common challenges and problems ...................................................... 30
   6.2 Relevance for commuting and intermodality ....................................................... 30
   6.3 Possible solutions............................................................................................................ 30
   6.4 Indicators for success................................................................................................... 31
   6.5 Best practice examples................................................................................................. 31
7. References................................................................................................................................. 36

                                                                              3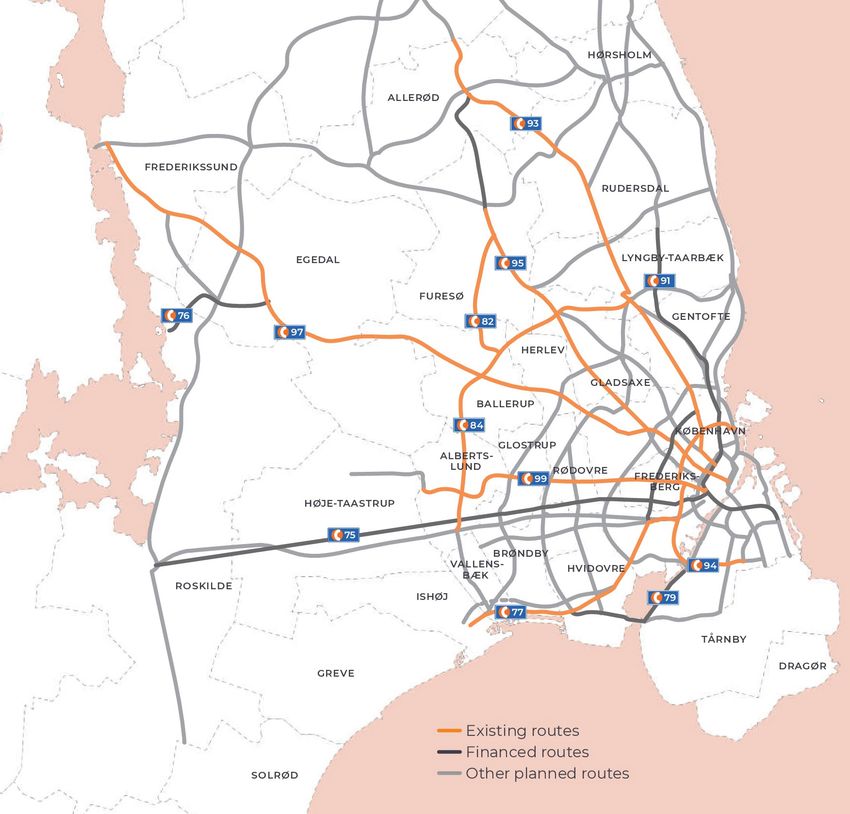
1.     INTRODUCTION
Commuter traffic accounts for a high proportion of the traffic volume and is therefore the focus
of attention in the transformation of traffic towards a more environmentally friendly transport
system. Many cities struggle with different challenges in terms of transport and commuting
in general and with a high proportion of car use among commuters in particular. In order to
meet these challenges, numerous solutions have already been developed and implemented,
many of them being transferable to other cities.
Within the project SUMBA, the partner municipalities will address their challenges by finding
and defining possible solutions. For this purpose there has been an intensive knowledge ex-
change of good practice solutions within the consortium. Some of the findings are summari-
sed in this compendium of problems and challenges in commuting countered by good practice
solutions. With the aim of contributing to the existing knowledge of stakeholder groups, these
solutions are presented here in the form of case studies. As such, they are not intended to be
universally applicable, but rather to serve as inspiration for cities to develop their own context-
specific solutions.
The larger issues that this compendium seeks to address are those created/compounded by
large-scale car dependent commuting activities common in cities in the Baltic Sea Region (and
elsewhere). These issues include climate change, congestion, air pollution, road safety, poor
health, obesity, shortage of urban space for non-driving activities. Reducing commuting or
redirecting it from private cars to more sustainable transport modes would help alleviate all of
these important issues. As such, the good practice examples in this document point towards
ways for addressing various challenges that are common when attempting to make current
commuting patterns more sustainable.
Five main topics were identified which are common to the cities in the Baltic Sea Region, as
they emerged from the discussions between the partner cities and from the results of the
SWOT analysis carried out in each city. The topics are
    •    Transport and urban planning,
    •    Analysing the transport system,
    •    Infrastructure
    •    Integrated ticketing and tariff system,
    •    Services
Each of them represents one chapter of the document. The topics are described in more detail,
their relevance for the topic of commuting is worked out and possible solutions and indicators
of success are presented. Each chapter concludes with a detailed description of good practice
solutions that have addressed the outlined challenges well.

                                                4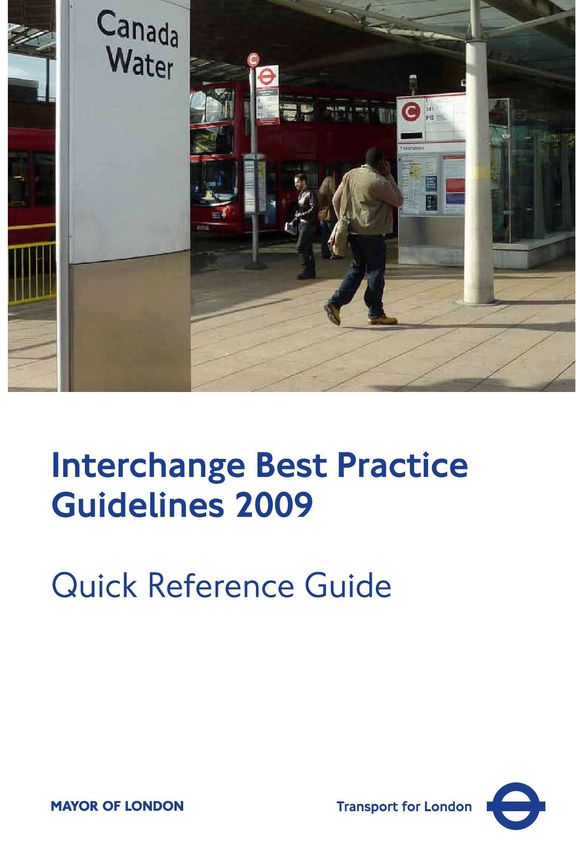
2.     TRANSPORT AND URBAN PLANNING
2.1    Relevant common challenges and problems
One of the main issues regarding mobility and urban planning processes in today’s cities is
their fragmentation along administrative as well as departmental borders. Being composed
of a city and its commuting zone, a functional urban area (FUA) encompass the economic and
functional extent of a city based on daily people’s movements. Administratively, a FUA is usu-
ally made up of a number of municipalities and/or other administrative units. This complicates
planning a well-functioning transport system within the functional urban area as cooperating
with other administrative units can be quite a challenge. When cross-border cooperation is
not working well enough, the result is a fragmented transport system where various services
and bits of infrastructure are not connected into coherent routes and journeys between rele-
vant destinations throughout the urban area. This is especially true for public transport (PT)
and active modes of transport (e.g. walking, cycling) as the infrastructure and organisational
solutions for these modes are still being developed in most cities, whereas car infrastructure
is already connected and usually relatively well developed. In addition, the status of active
modes as modes of transport relevant to commuting (as opposed to a recreational activity) is
very recent and, at times, still contested. As such, the political will and administrative capacity
to develop these modes (across municipal borders or as means of access to public transport)
is often lacking when compared to motorised transport. Thus, poor cooperation between neig-
hbouring municipalities within the same functional urban area is a significant issue for develo-
ping a well-functioning transport system for PT and active modes of transport.
Organisationally, land use planning and mobility planning are often carried out by separate
departments without much coordination. This is an issue for planning a well-functioning trans-
port system because land use and transport systems have profound influences on each other.
Land use dictates the distribution and overall quantity of demand for mobility, which directs
the development of transport systems and travel behaviour, at least in the long term. At the
same time, the existence of transport systems is a necessary prerequisite for enabling new de-
velopment. Additionally, changes in existing transport systems are often necessary to support
changes in land use patterns in existing neighbourhoods. Due to paying too little attention to
this relationship between these two fields, single use neighbourhoods far from the existing PT
lines are allowed to emerge in many cities. As a result, commuting distances and car depen-
dency are increasing. Thus, insufficient coordination between land use planning and mobility
planning is currently a widespread barrier for developing a sustainable and well-functioning
transport network.

2.2    Relevance for commuting and intermodality
Fragmentation of mobility and land use planning has obvious adverse effects on commuting
and intermodality as the resulting mono-functional developments, poor service level of public
transport service, fragmented active travel networks make it difficult to use these modes for
commuting or essential daily errands, especially when one’s journey crosses administrative
borders. This reduces the opportunities for performing multi-modal journeys and increases
car dependency.

2.3    Possible solutions
One way to address both challenges outlined above is to adopt a specific regional planning
concept for increasing accessibility as well as mobility by PT and active modes of transport,
that incorporates specific land use and transport system configurations into a unified strategy. Drawing
on this concept, a strategy and action plan should be developed for the whole functional urban area. Of
course, this requires extensive cooperation and coordination on the part of relevant administrative units
and departments. However, it is easier to cooperate if a common direction is set out first.

                                                   5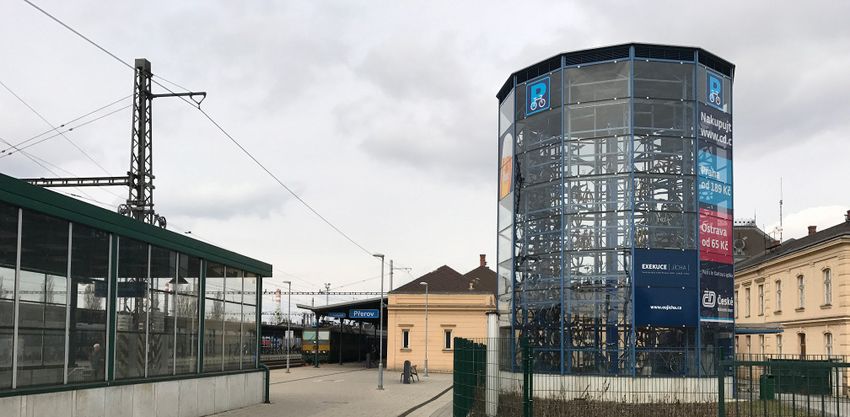
A good example of a regional planning concept is the concept of decentralised spatial concen-
tration (Dezentrale räumliche Konzentration). The general principle for the development of the
concept of decentralised spatial concentration is that it consists of a polycentric net. In order
to disburden the core centre, it is surrounded by other (smaller) high performance centres.
Additional tangential transport connections complete the radial transport structures to streng-
then not only the connection between the smaller centres but also to enable the core centre
to develop itself. Such a concept provides specific directions for land use as well as mobility
planning. In both areas, it aims to increase accessibility by PT and active modes of transport.
In terms of land use, a pattern is introduced where there are more jobs and services close to
residential areas. At the same time, people’s mobility is improved by the fast PT connections
between centres.
Administratively, to set up and carry out a regional planning concept, a regional body needs to
be established that brings together all the relevant departments from relevant administrative
units (and other relevant actors if necessary). The level of integration depends on the speci-
fic type of body chosen. On the less integrated end of the spectrum is a regularly convened
council where joint decisions are made, actions planned and responsibilities allocated by in-
dependent members. On the more integrated end is a regional land use and mobility planning
organisation with the capacity to plan and carry out activities on its own. Both ends of the
spectrum can work if they fit well with the local context. However, it is important to make sure
that cooperation between relevant agents is regular and consistent.

2.4    Indicators for success
The following indicators should be measured to gauge the city region’s performance in solving
the problem of fragmented mobility and land use planning:
    •    Plan: existence of a regional plan directing mobility and land use planning
    •    Sustainability: inclusion of sustainability principles in land use as well as mobility plan-
         ning within the regional plan.
    •    Integration: organisational integration between land use and mobility planning. Can
         be assessed by reviewing the organisational structure of the city administration for
         managing mobility and land use planning (is it done in one department or separately)
         and by verifying the existence and extent of institutionalised procedures for coordina-
         ting the activities of the two departments/areas
    •    Cooperation: consistent cooperation between municipalities (e.g. how often parties
         meet to coordinate their activities)
    •    Compliance: compliance of municipalities’ activities with the regional plan. Can be as-
         sessed by reviewing the activities carried out by municipalities and comparing them to
         the activities prescribed in the plan or by measuring progress towards the goals set in
         the regional plan, e.g. by measuring changes in modal share and accessibility measu-
         res for PT and active modes of transport.

2.5    Good practice examples
The intention of this (sub-)chapter is to give insight into transport and urban planning struc-
tures relevant for commuting and intermodality. It was not the attempt to compare the two
regions presented here: Utrecht and Hanover. Both regions face similar challenges nowadays
and in future times. Moreover, both regions:
    •    have a relatively high number of small and medium sized municipalities,
    •    have a higher amount of commuter activities due to an economic increase in workfor-
         ce,
    •    are central and important “traffic pivots” because of geographical position for all me-

                                                 6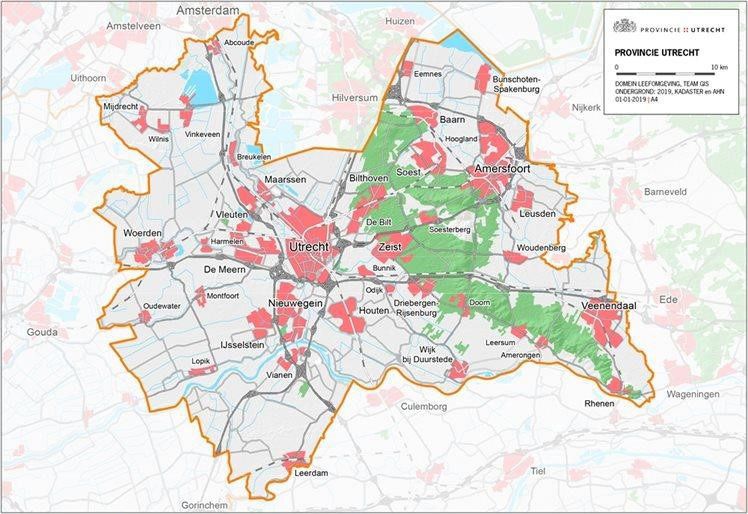
ans of transport,
    •    develop/developed “mobility (climate) action plans” for different modes of transport,
    •    use a similar approach to transport and urban planning.

Figure 1. Modal split for the Region of Hanover

2.5.1 Region of Hanover
2.5.1.1 Administrative structures for cross-border and cross-operator coordination
The “Region of Hanover” consists of 21 municipalities with the main public administrative cen-
tre being situated in the City of Hanover. The city of Hanover itself is the capital of the federal
state of Niedersachsen (Lower Saxony). The “Region Hanover” is a relatively young form of a
regional authority (“Gebietskörperschaft”) founded in 2001. In the 21 municipalities there are a
total of 1.1 million inhabitants.
The City of Hanover plays an important role as an economic centre, with attractive workplaces
in various fields, such as science, trade and industry. This not only for the 21 municipalities, but
also for the whole northern part of Germany. The city of Hanover is also a central axis in the
northern part of Germany for train, car, public transport, other transport (people and goods)
in all four main directions as well as Europe (The Netherlands/Poland). Hence daily commuter
activities are booming and transport of goods around the main traffic axes is increasing. As
an example of this, the central railway station in Hannover experienced an increase of 68 % in
passenger volume between 1999 and 2011.
One of the main tasks of the regional authority is transport planning. Specifically, the Region of
Hanover is responsible for managing regional public transport and carrying out interventions
to support sustainable commuting. These activities are supported by municipalities which are
responsible for restrictive actions/sanctions i.e. management of parking facilities like P+R pla-

                                                  7
ces, removal of street lanes or formation of low emission zones to reduce individual motorised
transport.
The sustainable transport strategies are outlined in the SUMP created in 2011 by the Region
of Hanover. The SUMP is called “VEP - pro Klima” (VEP-Verkehrsentwicklungsplan) and it includes
the following five main (administrative) pillars:
    •    tightly coordinating new land developments and development of regional cycling con-
         ditions in order to increase sustainability of the regional transport system,
    •    developing regional public transport,
    •    fostering traffic management, street infrastructure and parking,
    •    developing a mobility management strategy,
    •    additional concept for developing freight traffic due to an increase in economic activi-
         ty in that area (+25 %).

In terms of specific policies, public transport options for daily commuting in the Region of
Hanover are provided by a radial railway network between municipalities complemented by
feeder buses (responsibility of the regional authority). Additionally, bicycle highways are in the
planning stage to connect residential areas with the city centre. An important regional goal
is to provide access from any point in the region to the city centre using ‘S-Bahn’ (suburban
railway) within a maximum of 45 minutes. This goal is aimed to be achieved by providing ad-
ditional first and last mile transport options, such as Park + Ride and Bike + Ride facilities
(responsibility of the municipalities). Every five years a revision of the sustainable mobility net-
work in the whole region is carried out and the SUMP is updated accordingly to include the
consideration of current developments in land use planning.

Socio-economic and geographical aspects Region of Hannover

Population:       1.1 million       •    Strong regional cooperation between Region of Hanover and City of
                                         Hanover
Surface:          2.291 km²
                                    •    Status: regional administration
Municipalities:   21                •    Regional „supply and development“ urban/ peri-urban concept
Geography:        Mostly flat;      •    Bicycle highways in planning
                  some “hilly”      •    Transport development plan “Pro Klima” and “Masterplan 100 % for
                  parts                  climate protection” to promote e-mobility
                                    •    Urban logistic concept - main goal: CO2- free (city) logistic till 2030
Table 1: Overview socio-economic and geographical indicators Region of Hanover (own source)

2.5.1.2 Integrated regional transport, spatial planning and housing policies
The Region of Hanover is responsible for both transport and spatial planning. Such an admi-
nistrative configuration supports integrated mobility and spatial planning.
Since 2000 Region of Hanover has worked towards establishing sustainable spatial settlement
patterns. This has included a twofold approach: a) enforcement of administrative cooperation
between municipalities to realise the overall concept of regional planning (see above) and b)
development of the overall concept: Stadt der kurzen Wege (“City of short Ways”) (Beckmann et
al. 2011). This concept is complemented by “Leben an Schienenachsen” (Living next to tracks).
These two concepts aim, respectively, to reduce commuting distances by encouraging mixed
land use patterns and to improve residents’ mobility by PT. To work towards the latter aim, the
administration has built “S-Bahn” (urban-suburban commuter railway system) lines that cater
to the high amount of daily commuting into the city (centre) of Hannover. These two concepts
contribute towards realising the broader urban planning vision/concept of decentralised re-
gional spatial planning (see above).

                                                     8
Figure 2. Region of Hanover and its 21 municipalities (Source: https://en.wikipedia.org/wiki/Hanover_Region)

Indicators of success (Hanover)

 Indicator:       Result:
 Plan             SUMP: VEP - Prom Klima; regional concept: decentralised spatial concentration
 Sustainability   PT, cycling and pedestrian accessibility and mobility are prioritised through mobility as well as
                  land use planning
 Integration      Land use policies present in SUMP; same organisation for mobility and land use planning
 Cooperation      Areas of responsibility are allocated between the regional body and municipalities; every 5 years
                  the SUMP is renewed together
 Compliance       n/a

2.5.2 Region of Utrecht - The Netherlands
2.5.2.1 Administrative structures for cross-border and cross-operator coordination
The “Region of Utrecht” is part of the “Randstad” area. This western area in NL has a popula-
tion of 8,2 million. The “city circle” covers the cities of Amsterdam, Rotterdam, Delft, Gouda,
Leiden, The Hague, Dordrecht, Hilversum, Almere, Haarlem and city of Utrecht. As a result, the
region is confronted with daily commuting activities which lead to 57 million travellers per year
through the main train station of the city of Utrecht. The region of Utrecht is the fastest gro-
wing regional economy in the Netherlands. The city itself will face a population growth of up to
400,000 inhabitants between 2025 and 2030, which is an increase of 17 % (compared to 2017).
The Region of Utrecht is an administrative organisation like the Region of Hannover. Hence,
they cooperate with different entities and partners like the state or municipalities in that area.
The regional authority unites 26 municipalities with the aim to plan an effective transport net-
work throughout the entire urban functional area. Each municipality in the region can apply for
subsidies. The Region of Utrecht is the central pivot for the municipalities and their develop-
ment. Democratic structures like “eerste kamer and tweede kamer” (first and second chamber)
confirm and justify various measures for the development of sustainable mobility options and
detailed “mobility plans” so that the Region of Utrecht can actively implement them.

                                                         9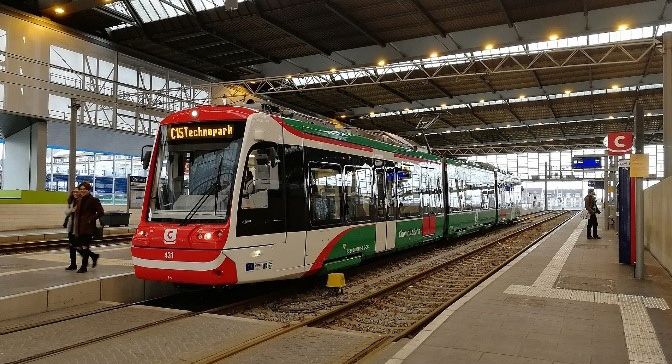
In terms of specific policies, the Region of Utrecht has put a lot of emphasis on developing
multimodal transport options. By doing this, they have achieved a high number of intermodal
trips within the region. For example, 40 % of all train trips start with a bike ride. One of the
most important policies for encouraging multimodal trips is the national “OV chipkaart” (public
transport electronic chip card). This electronic card allows commuters to use various modes
of public transport in the Netherlands. The main advantage of this card is that customers are
not confronted with different tariff systems in different regions or companies nor direct paying
processes. The card can be used to access the public bike sharing system at stations as well as
all public transport modes like buses, trams, and commuter trains for (short and long distan-
ces). The electronic “OV chipkaart” provides not only good conditions for intermodal trips but
also an easy and quick access to public transport in general.
In order to continue to encourage intermodal trips, the region plans to use more direct bus li-
nes with fewer stops in villages. In the remaining stops, bike parking facilities will be improved.
By 2030 to 2035 a redistribution of train services in the region is planned to lighten the load on
Utrecht central station.
In addition to intermodality, improving cycling conditions is an area of focus. In 2016, the re-
gion established the “Realisatieplan Fiets 2016-2020“ (Realisation of Cycling Plan 2016-2020)
with a budget of €30.75 million for this period. In this plan, the central aspects are safe routing
for cyclists to support connections between residential areas and main destinations (e.g. train
and bus stations, schools and working places). This was complemented by investments into
cycling infrastructure for similar purposes made under „Mobiliteitsplan“ (Mobility plan 2014-
2028). Examples of these infrastructure investments include improving existing cycling paths
by adding smart lighting, building cycling tunnels to guarantee a constant traffic flow for cyc-
lists and widening cycle paths.

Socio-economic and geographical aspects Region of Utrecht

 Population:       1.285 million     •    “Region of Utrecht” and City of Utrecht developed during the last de-
                                          cades a strategy to manage a) mobility and traffic in terms of acti-
 Surface:          1.378 km²              ve mobility towards sustainable modes of transport (biking, public
 Municipalities:   26                     transport, walking etc.) and b) regional - urban and peri-urban plan-
                                          ning in general.
 Geography:        Flat              •    Mobility Masterplan 2014-2028
                                     •    Several research programmes on public transport, cycling, (city-)lo-
                                          gistics
                                     •    “Cycling Plan 2016-2020” plus additional projects and programs (i.e.
                                          safety, cycling highways, connection with public transport etc.)
Table 2: Overview socio-economic and geographical indicators Region of Utrecht (own source)

2.5.2.2 Integrated regional transport, spatial planning and housing policies
Under the Region of Utrecht, spatial and transport planning are, similarly to the Region of
Hannover, integrated as both are carried out by the same regional body. In cooperation with
the state and municipalities, a common urbanisation strategy is carried out.
Specifically, the Region of Utrecht is making an effort to connect residential and popular des-
tination areas into the transport network. Good examples are improved connectivity of cyc-
ling infrastructure carried out under the Realisatieplan Fiets 2016-2020 (see above) and a new
tramline that will connect Utrecht’s central train station and Utrecht Science Park, which is
currently not accessible via train. Such measures improve the mobility of Utrecht’s residents.
In order to guide the development of new land so that accessibility and mobility are offered
at a high level, the City of Utrecht encourages development of dense mixed use neighbour-
hoods within the inner city that are well serviced by PT and cycling infrastructure. Such neig-
hbourhoods are designed in tight cooperation with private developers to ensure the holistic

                                                     10
functionality of these neighbourhoods. Within new developments sustainable transport hubs
are planned. These hubs bring together various sustainable transport options to facilitate sus-
tainable individual transport. Cars must be parked at the edge of the development, usually
underground, while cyclists, pedestrians, PT users and car-share users can access the very
centre of the neighbourhood at the transport hub. Such hubs improve residents’ opportunities
for multimodal trips and enhance overall mobility.
All these specific policies are set in the historical context of broader land use regulations under
the Dutch ‘ABC’ land use policy. This nationwide policy has had a profound effect on the land
use pattern in the Utrecht region. Essentially, the ‘ABC location policy’ sorts urban areas into
various zones (A, B and C) with descending levels of pedestrian, cyclist and PT user comfort and
ascending levels of car user comfort. The most ambitious tier, A, is mostly dedicated for central
areas where businesses with many employees and visitors are required to be located. Zones
designated as B are usually located slightly further out and require good PT connections but
also good access by private car. Zone C is mostly reserved for areas on the perimeter of the city
where car-dependent industrial activities are encouraged, e.g. hauliers, couriers.
The ‘ABC’ policy has directed most workplaces to be located in the inner city, thus reducing the
commuting distances. In addition, the policy has made sure that most of such areas are very
convenient to access using sustainable modes of transport and inconvenient to access using
a private car. In these two ways, this land use policy has actively directed people’s mobility
patterns.
Figure 3. The Region of Utrecht and its 26 municipalities (https://www.provincie-utrecht.nl/algemene-onderde-
len/serviceblok/english/province-utrecht/)
11Figure 4. The Train-Network of the region of Utrecht
Indicators of success (Utrecht)
Indicator: Result:
Plan Mobility Masterplan 2014-2028
Sustainability Cycling, PT and pedestrian movement prioritised; land use development in the inner city
Integration Same regional organisation responsible for land use and mobility planning
Cooperation Municipalities apply for funds through the regional body
Compliance n/a
123. ANALYSING THE TRANSPORT SYSTEM
3.1 Relevant common challenges and problems
3.1.1 Data collection and sharing in multi-governance structure.
One of the main challenges in contemporary cities and towns is obtaining sufficient data on
people’s movements and transport habits for evidence-based transport planning. Without re-
levant data, it is difficult to strategically and consistently direct a city’s transport system to-
wards the goals and targets set (or indeed even set these targets). This issue is highlighted in
the context of the increasing need to transition to sustainable transport systems. Considering
the urgency of the issue and the availability of various new technologies that make data collec-
tion a lot easier than it has been previously, there is really no good excuse for failure to gather
relevant and sufficient transport data. While many cities do have data collection systems in
place, these systems are often very car centric as it is easier to measure and monitor vehicular
traffic, while pedestrian, cyclist and public transport (PT) user patterns are more complex. This
is an issue because it prevents evidence-based planning of sustainable modes of transport
while developing further the already prioritised conditions for driving. Thus, perhaps even
more important than setting up ambitious and innovative data collection systems, is making
sure that these systems do not support the further prioritisation of vehicular traffic over PT
and active modes of transport (walking, cycling and other micromobility).
Regional transport models. The data collected on people’s transport needs and behaviour
must be analysed to provide guidance to transport planners. Perhaps the best way to do this
is by using transport models. Models enable analysing the current state of transport systems
as well as predicting future developments in various scenarios. The latter use is especially
important as it allows planners to estimate the effects of various potential interventions and
choose/prioritise the most effective and/or cost-effective ones. Transport models have been in
use for a while, but their accuracy and utility has been fairly limited when it comes to modelling
public transport demand, active modes of transport and multimodal trips. While today there
exist some models that are very good in that respect, their use in practice is still not nearly as
widespread as that of motorised transport models. This has greatly contributed to the prioriti-
sation of vehicular traffic in cities and towns as models have provided great insights and some
measure of certainty in the case of motorised private modes, while leaving transport planners
in the dark when it comes to planning systems for sustainable transport modes.
3.2 Relevance for commuting and intermodality
Data collection and modelling provide information about current mobility patterns and poten-
tial interventions. This enables planning and creating a more convenient and fit for purpose
transport system in the whole functional urban area, which is essential for sustainable com-
muting. For intermodality, data collection and modelling are especially important because in-
termodal journeys are more complex than journeys using only one mode. Data and modelling
help planners to understand the specific needs and problems of intermodal commutes.
3.3 Possible solutions
3.3.1 Data collection and sharing in multi-governance structure.
The type and amount of data that needs to be collected for effective transport planning de-
pends to a large extent on the specific (types of) models chosen. As such, data gathering activi-
ties should be closely coordinated with transport and land use modelling activities. The easiest
way to make sure enough relevant data on PT and active modes of transport is gathered, is to
first choose models that enable high quality modelling of PT and active modes (see next para-
graph) and then plan data gathering activities according to the requirements of these models.
13For macromodels including many modes of transport, the main types of data needed include,
among others, distribution of population, jobs, schools and other main functions, origin-de-
stination and modal split trips, routes used, topography (for active modes) and journey times.
There are various sources from which these data can be collected (see the ‘SUMBA Guidance
for modelling and data collection’ document) and often it is beneficial to gather the same data
from multiple sources for validation. An increasingly popular method is using mobile positio-
ning data because it offers a lot of useful information about people’s movement. However,
even mobile positioning data is usually complemented by more traditional data sources like
travel surveys.
When planning transport modelling and data collection activities, it is important that this be
done in close cooperation between the municipalities making up the functional urban area to
ensure that data on the whole area is included and concistently used. Otherwise, modelling
will be of limited use as it will not be able to accurately predict transport patterns without all
the relevant data. Similarly, the results of modelling and the activities based on these, should
be shared and coordinated between the municipalities to ensure the effectiveness of transport
planning in the functional urban area (see chapter 2.1 for more).
For a more detailed overview on the types of data necessary for specific types of transport and
land use models, please refer to the document ‘Guidance for modelling and data collection’
compiled under the SUMBA project.
3.3.2 Regional transport models
There are many different types of models that are used for analysing different scales/aspects
of transport systems. A set of models should be chosen that cover the relevant scales and fit
well with each other. However, the main priority when choosing these models should be their
ability to model PT, active modes of transport and multimodal journeys at a high level. While
it is necessary to also model motorised transport, this capacity is present in most any general
traffic modelling tool anyway. Focusing on PT and active modes of transport is essential for
being able to plan a healthy, sustainable and well-functioning transport system in an urban
functional area.
For an overview of the different types of models as well as descriptions of specific modelling
tools, please refer to the document ‘Guidance for modelling and data collection’ compiled un-
der the SUMBA project.
3.3.3 Measuring accessibility
One method that has been recognised as crucial for developing a sustainable transport system
is modelling accessibility. Accessibility is often defined as the property of a location that shows
the number of relevant places/activities that can be accessed from this location in a given time
period by a given mode of transport. For example, measuring accessibility by PT for commuting
shows how many workplaces can be reached from a certain point in, say, 30 minutes using PT.
Accessibility is perhaps the most important criterion (although certainly not the only one) for
assessing the performance of a mode of transport or the overall transport system because it
measures the opportunities people have access to, which is arguably the main goal of transport
planning. As such, accessibility for various uses and modes of transport should be modelled. Ho-
wever, measuring (and improving) accessibility by PT, active modes of transport and multimodal
solutions should be prioritised as these modes can be used by more groups of people (e.g. chil-
dren, elderly, the less wealthy) when compared to driving due to low costs and lower physical/
mental capacity requirements. These modes of transport are also much cheaper to develop and
much less disruptive for other activities and modes of transport (when compared to driving).
Specific modelling tools for computing accessibility include
• ArcGIS Network Analyst by ESRI,
14• Sugar Access by Citilabs,
• UrMoAC by German Aerospace Centre.
As accessibility is affected by both land use patterns and available mobility, it is also a necessary
piece of data for most Land Use Transport Interaction (LUTI) models. For more information ab-
out specific accessibility and LUTI models, please refer to the document ‘Guidance for modelling
and data collection’ compiled under the SUMBA project.
3.4 Indicators for success
In order to measure progress on addressing the above mentioned challenges, these indicators
should be measured:
• Data: historically consistent (comparable) basic transport data collection on PT and
active modes. Can be measured by the period for which basic data are available.
• Modelling: use of models in planning for PT and active modes. Can be measured by
how many different types/scales of models are used in planning.
• Accessibility: modelling accessibility scores for PT and active modes.
3.5 Good practice examples
3.5.1 Data collection and sharing in multi-governance structure: scooter-share data
management in Chicago
In June 2019 the City of Chicago launched an e-scooter sharing pilot programme. The pro-
gramme was restricted to only a part of the city and included a total of 2500 scooters from
10 different private operators (250 each). All scooters were required to have an attached GPS
device so that their movement could be monitored. However, the multitude of operators made
it difficult to manage the overall system as there were various levels of compliance with data-
sharing requirements as well as a large number of complex data streams that had to be moni-
tored and analysed. In order to overcome this challenge, the public administration decided to
use a shared mobility management platform offered by a company called Populus.
Populus worked with the operators to achieve the required levels of data-sharing and conso-
lidated the various data streams onto a single platform that enables the city administration
to conveniently monitor the availability and movement of all scooters in real time as well as
historically. This data allows the city administration to manage the daily operations of scooters,
e.g. limit the overall number of scooters and their movement to within the selected pilot area.
An important aspect that can be monitored is the equitable distribution of scooters throug-
hout the pilot area. In U.S. cities in general, wealth and service provision inequalities between
different city districts is an important issue. Thus, one of the priorities when launching shared
mobility services, is to make sure that these services do not contribute further to this inequa-
lity. In Chicago the equitable distribution of scooters is sought by requiring all operators to
deploy at least half of their fleet in two areas identified as historically underserved. The mobi-
lity platform provided by Populus has a special feature that enables the city administration to
monitor operators’ compliance with this regulation.
In addition to helping to manage the scooter system, the unified platform provides data that
can be used in future infrastructure decisions. Visualisation of the trips taken highlights the
most popular routes where multimodal hubs could be planned and road safety conditions
improved. It also points to potential issues on the lesser used routes that need to be addres-
sed. These data can also be used in broader mobility models to enhance overall conditions for
micromobility.
All in all, this platform provides the city administration data that can be used to manage the
often chaotic scooter-sharing schemes, thus improving the user experience, as well as to sup-
15port further improvements in the (infrastructure) conditions of micromobility.
Indicator: Result:
Data Well-organised data collection of the scooter-share scheme from the very beginning
Modelling Not yet present for the scooter-share
Accessibility Not yet present for the scooter-share
3.5.2 Regional transport models: Data-driven solutions for public transport system de-
velopment (Tartu, Estonia)
In the summer of 2019, a new public transport network was implemented in Tartu, Estonia
that was put together through modelling (the previous network was not). The model was not a
comprehensive traffic model which would include other modes of transport and be responsive
to changes in modal share as a result of changes in PT network. Rather, it was a network mo-
del that used current PT demand as fixed to model optimal (in terms of travel time) bus lines.
Such an approach is fine as long as its limitations are acknowledged and possibly addressed
in future modellings. These limitations include (probably) underestimating actual demand for
PT, inability to estimate potential route modifications’ effect on modal share and inability to
estimate the modal share effects of potential changes in driving conditions (e.g. reduction of
parking spaces in the city centre).
The main piece of data used for modelling was mobile positioning data, which provided the
information on people’s movements in space and time. This was complemented by land use
data, verification data from electronic bus cards, the demographic profile of urban districts
and many other types of data. All this data was compiled into an origin-destination matrix that
was an important input for modelling a PT network that would minimise travel time. Other
major inputs included the road network and the location of bus stops. The limits in terms of
public spending were set by Tartu city government.
After modelling, feedback was gathered from the public on the new proposed PT network. As
a result some changes were made to cater to students, night shift/early-morning workers and
the elderly. This was an important step of public involvement that brought to the fore some
necessary aspects of a PT network that were missed during modelling. The result was a time
(and money) efficient PT network that caters well to the needs of various user groups.
The main changes in the new network were replacing circular lines with pendulum routes,
increasing the frequency of buses (10 to 20 minutes between buses at peak times) and better
connections between lines. As a result of public feedback, one circular line and night buses
were added to the modelled network.
As of this writing, the effects of the new PT network have not yet been analysed extensively,
but early results indicate that the number of passengers has increased by around 10 %. Over-
all, modelling new bus network allowed the city government to increase the time competitive-
ness and thus attractiveness of PT while maintaining similar levels of expenditure.
Indicator: Result:
Data Data on bus use collected using mobile positioning technology as well as data from validation of
electronic bus cards. The former was collected as a one-time thing but electronic bus card data
is available since its launch in 2015.
Modelling A high quality PT network model used. Has some limitations that need to be addressed with
future modelling.
Accessibility Not present.
3.5.3 Measuring Accessibility: Riga Public Transport System accessibility assessment
Riga Public Transport System accessibility assessment carried out in 2017 was based on travel
16time measurements. More specifically, the travel time of using public transport was compared
to that of driving. While it is more common to single out specific (types of) destinations, in this
study the destination was simply the city centre. This simplification was made because some of
the necessary data for conducting the study was missing and the city centre is the area of the
city where jobs and services have clustered the most. The assessment was based on the EMME
transport model that enabled considering car traffic’s effects on public transport (speed). A
total of 180 locations (potential mobility hubs) were picked within the functional urban area for
which the travel time to the city centre was modelled by both PT and car. The assessment of
accessibility was based on tiers of time where ‘0-8 minutes’ was the best and ‘over 48 minutes’
the worst tier (see Figures 4 and 5).
Figure 5. Map showing Riga PT impedance created by Figure 6. Map showing Riga car impedance created
EMME in minutes (Source: EMME software):(green: 0–8, by EMME in minutes (Source: EMME software); green:
yellow: 8–16, light blue: 16–24, blue: 24–32, orange: 0–8, yellow: 8–16, light blue: 16–24, blue: 24–32,
32–40, red: 40–48, purple: >48). orange: 32–40, red: 40–48, purple:> 48).
As can be seen from the figures above accessibility measurements for PT were generally wor-
se when compared to driving (especially for longer distances). Perhaps most strikingly, 23 %
of the locations had the worst accessibility score for PT while only 7 % had such a score for
driving. These results provide an effective way for measuring the quality and functionality of
PT in Riga area. In the context of ambitious EU-wide climate commitments, the comparison to
driving is especially useful since it provides a definitive accessibility goal that needs to be rea-
ched in order to effectively curb driving in Riga.
Indicator: Result:
Data Data from Riga Traffic Model (O-D matrices, bus routes, road network)
Modelling Accessibility modelling using EMME software
Accessibility Present and fairly well done for PT
174. INFRASTRUCTURE
4.1 Relevant common challenges and problems
A well-developed infrastructure that takes all modes of transport into account plays a key role
in the design and transformation towards a sustainable transport system and in promoting
sustainable transport behaviour. In this context, the infrastructure for each individual mode of
transport has to be considered as well as interchange points with respect to intermodal routes
combining different modes of transport.
In many cities, however, a one-sided focus is often placed on the expansion and continuous
improvement of car infrastructure. As a result the conditions for the use of sustainable modes
of transport are in great need of improvement and are not competitive compared to car use.
More specifically, there is a need for convenient and reliable public transport connections as
well as good infrastructure for non-motorised traffic, such as footpaths and cycle paths. At
present, for example, the cycling infrastructure in many cities is severely underdeveloped and
does not form a coherent, extensive network, and, particularly relevant for commuting, there
is often a lack of safe and comfortable connections between the city centre and the suburbs.
As mentioned above, in addition to the network infrastructure, public transport stops play a
particularly important role, as they serve as the „entry gates“ to the public transport network.
Moreover, in addition to the infrastructures for the individual modes of transport, the inter-
linking of means of transport plays an important role with the aim of promoting intermodal
transport behaviour. Intermodality in this context refers to the combination of different means
of transport on one route and allows the individual advantages of the means of transport to be
used with the aim of optimising the overall route. However, the change of means of transport
is associated with inconveniences, especially in comparison to car use, which usually allows a
door-to-door journey. Accordingly, the design and equipment of interchanges also plays an
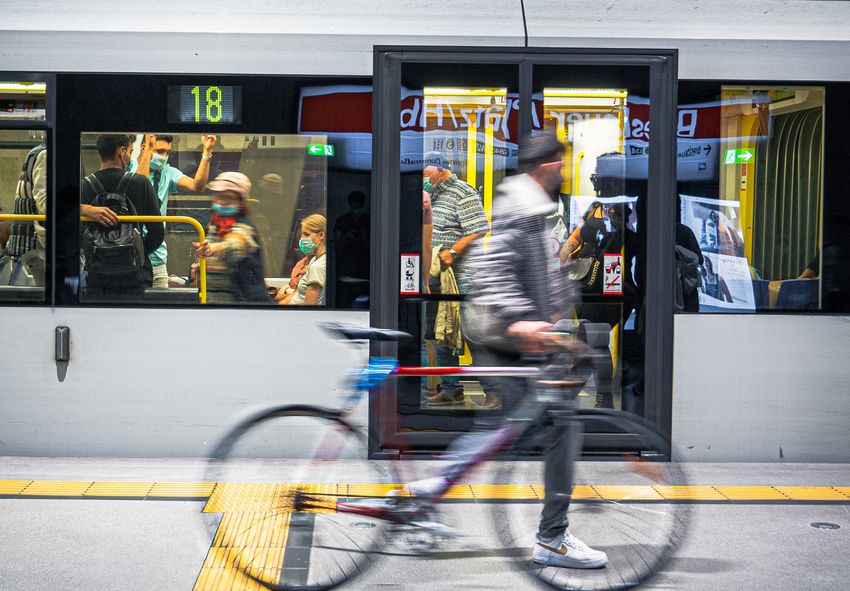
important role. Broadly speaking, two types of relevant amenities can be distinguished: those
needed for continuing one’s journey and those needed to make the stopping/waiting period
more comfortable. The first sort includes, for example, sheltered bicycle parking, hubs where
many transport modes meet, availability of bike and car share systems. The second sort in-
cludes seating, shelter from weather in the waiting area and facilities offering food and drink.
However, the current design of public transport stops in many cities does not meet user expec-
tations. In many cases the listed amenities are missing, as well as an informational and also
architectural connection between the various means of transport.
4.2 Relevance for commuting and intermodality
Commuter traffic accounts for a high proportion of the daily traffic volume; the dimensions
of the road infrastructure are usually planned and built for the period of maximum demand,
which often represents the morning peak. Accordingly, the capacity of the infrastructure is
only utilised for a short period of time. In order to satisfy the mobility needs in a cost and space
efficient way, it is therefore in the interest of the cities to motivate commuters to use environ-
mentally friendly means of transport as much as possible. This requires well developed infras-
tructures (network, stops, interchanges, and vehicles) for public transport and active modes to
achieve a sustainable modal shift towards sustainable transport systems.
Well-designed interchanges and intermodal nodes play an essential role in intermodal travel
chains. As changing is inconvenient both within public transport and between different modes
of transport, the aim must be to make transfers as smooth, seamless and stress-free as pos-
sible.
4.3 Possible solutions
The spectrum of possible solutions ranges from the creation of coordinated planning tools, the
definition and enforcement of uniform design and equipment specifications for stops, inter-
18changes and intermodal hubs, innovative vehicle and network approaches to reduce the num-
ber of transfers, and the improvement of network infrastructures for each mode of transport.
To improve interchanges between various modes of transport, it is essential that all transport
networks for all modes in the region are planned together so that the intersections of these
networks could be created and located where they are needed most for commuting journeys.
This requires extensive cooperation between relevant departments and probably some form
of unified body for transport planning in the region.
For improved waiting amenities in interchanges and multimodal hubs, it is useful to devise and
enact quality standards. Such standards should include adequate shelter, seating, food places,
possible recreational facilities and other amenities deemed necessary for creating convenient
multimodal hubs. By implementing these standards, an evenly good level of comfort can be
guaranteed in interchanges and multimodal hubs. A complementary approach would be to
reduce the need for interchanges altogether by using public transport that can transition from
regional line to an urban one. This would be suitable for interchanges where the main inter-
change is between regional and urban modes of PT, e.g. regional train and urban tram.
To enable the use of active, non-motorised modes, suitable infrastructure networks need to be
developed. A good solution is bicycle highways that connect suburbs directly to the city centre.
The idea behind such highways is to provide direct and interrupted connections ideal for high
speeds and long distances. Combined with the growing use of e-bikes, such highways provide
a very real alternative to car-based commuting.
4.4 Indicators for success
• Hubs: Number of good quality intermodal hubs
• Standards: Existence of quality standards for transport interchanges and intermodal
hubs
• Connections: Availability of commuting opportunities using active modes. Can be mea-
sured by share of suburban areas well connected to the city centre for active travel
(e.g. with bicycle highways)
• Changes: How many mode changes people need to make when commuting. Can be
measured by the average number of necessary changes of transport mode during a
commute for suburban residents.
4.5 Good practice examples
In the following sub-chapters good practice solutions for individual infrastructure aspects are
presented.
4.5.1 Quality standards for interchanges
Interchanges play an essential role in the transport system as they are both, the gateways to
the public transport network as well as purpose-built facilities where interchange between
different transport modes takes place. Therefore the overall aim for interchanges should be to
fundamentally improve the interchange experience and make transfers as smooth, seamless
and convenient as possible.
There are different types of interchanges regarding their size and function, ranging from PT
stops with shelters till the central interchange in a very large city. According to their size and
function within the PT network, there are different aspects to be considered regarding quality
standards. Such aspects range from embeddedness and connectivity of the stop in the built
environment, to the quality of stay and the provision of information, to additional offers such
as retail and service. In order to cover the wide range of aspects, instead of presenting indi-
vidual good practice solutions, reference is made below to knowledge, tools and guidance
already compiled in other (European) projects. These have dealt in detail with the tasks, actors
19and quality standards of PT stops and interchanges.
The European collaborative research project NODES (New Tools for Design and Operation of
Urban Transport Interchanges), co-funded by the Seventh Framework Programme, focused
on the development and testing of a toolbox to help European cities to assess and bench-
mark new or upgraded urban transport nodes with the aim of improving performance and
customer satisfaction. The NODES Toolbox contains a catalogue of integrated planning, design
and management tools along the five key areas identified (1) strategies for integrated land
use planning with urban passenger infrastructure planning, (2) innovative approaches relating
to the design of new or upgraded efficient transport interchanges, (3) intermodal operations
and information provision, (4) management and business models: the interchange as business
case for the local economy and in itself, and (5) energy efficient and environmental friendly
interchanges. The toolbox is available online at https://nodes-toolbox.eu/.
In addition, reference can also be made to already
publish guidelines for the design of interchanges.
In order to provide advice and guidance for im-
proving the quality and efficiency of interchanges,
Transport for London has designed the Interchan-
ge Best Practice Guidelines. Although they focus
on the interchanges in Greater London, they give
a very good overview of the aspects to be conside-
red and suggest possible solutions. The guidelines
consist of a design and evaluation framework cover-
ing the four main design themes of (1) efficiency, (2)
usability, (3) understanding, and (4) quality and the
principles and criteria supporting them. Each princi-
ple comprises one or more criteria, presented in the
form of a series of questions. Furthermore, a list of
important needs and aspirations of relevant stake-
holders such as passengers, local residents, station
manager and service providers is presented.
In summary, the guidance is a very good opportuni-
ty to inform about relevant aspects as well as to eva-
luate existing or planned interchanges and identify
areas for possible improvements. More information
and the Interchange best practice guidance are Figure 7. Interchange Best Practice Guidelines
available online at www.tfl.gov.uk/interchange. (source: Transport for London. 2009)
4.5.2 Intermodal / Mobility hubs
In recent years, a variety of new transport services and providers have emerged, especially in
cities, such as station-based and free-floating bicycle rental systems, e-scooters, car sharing
etc. These form the basis for a mobility of the future consisting of intelligently interconnected
systems. More and more often, journeys are not made with one‘s own car from start to finish;
instead, different mobility offers are combined depending on the situation and needs: By car
to the train station, from there by train to the city centre and then by bus or shared bicycle or
e-scooter to the destination. On the one hand, this enables users to use the most suitable me-
ans of transport for their chosen route. With regard to intermodality, it also enables users to
choose the appropriate means of transport for each part of an intermodal route chain.
Especially on the feeder routes of rapid transit systems, the so-called first/last mile, such trans-
port offers can greatly increasing the number of destinations reachable by public transport
and generate a modal shift away from the car. Concerning commuter traffic, dedicated areas
for parking cars (Park&Ride) or bicycles (Bike&Ride) are often already available in the periphery
of a city and enable the use of one‘s own vehicle as a feeder to the rapid transit system. The
20You can also read